

How our solutions team engineered WaterHack 2018


To celebrate World Water Day 2018 we partnered with Vizzuality to host WaterHack 2018. During this environmental and social datathon participants analyzed and visualized survey data collected by ONGAWA a NGO promoting human development and social change with the help of new data sharing technologies.
Currently ONGAWA leads a project supported through the European Union’s Global Climate Change Alliance tackling water insecurity in Tanzanian villages in the East Usambara Mountains. ONGAWA supports populations vulnerable to the effects of climate change with an eco-village model that (1) introduces efficient management of natural resources (2) improves water supply and sanitation services and (3) promotes the use of sustainable technologies.
Recently ONGAWA conducted a survey on living conditions in these 8 Tanzanian villages but the data collected from the survey’s 340 respondents needed a more accessible structure in order to be useful. During WaterHack 2018 participants helped explore this survey data using programming languages like R and Python interface tools like pandas and CARTOframes and Javascript libraries like D3.js and CARTO.js.
Let’s take a look at what they discovered!
Building a vulnerability index
ONGAWA’s efforts to reduce water insecurity also aims to reduce inequality. According to Ángel Fernandez the president of ONGAWA water insecurity increases inequality:
- Water scarcity disproportionately impacts select populations including women and girls ethnic minorities and the disabled
- Currently 1.8 billion people around the world access water from a contaminated source
- 1 000 children die each day due to water and sanitation-related diseases
- Children miss 443 million days of school each year because of water and sanitation-related illnesses
The inequalities resulting from water insecurity however disproportionately impact women and girls. When women and girls travel long distances to collect water girls are more likely to miss school which limits their access to education and places them at a disadvantage. When women and girls collect water that is contaminated this already vulnerable population faces even greater health risks.
For our datathon we decided to explore the spatial relationship between water insecurity and gender inequality. Participants were provided access to several CSV files containing survey data and in working groups were tasked with answering the following three questions:
- What village has the most gender equality in terms of water collection?
- Do women men or children travel farthest to collect water and how many buckets do they carry?
- What households in each village are most vulnerable to the effects of climate change?
Several groups began to answer these questions by first creating a data index to accelerate data retrieval operations across several CSV files. In addition data indices can be arranged so that column fields with geographically related values appear next to one another which can help identify missing values and/or highlight substitute values needed.
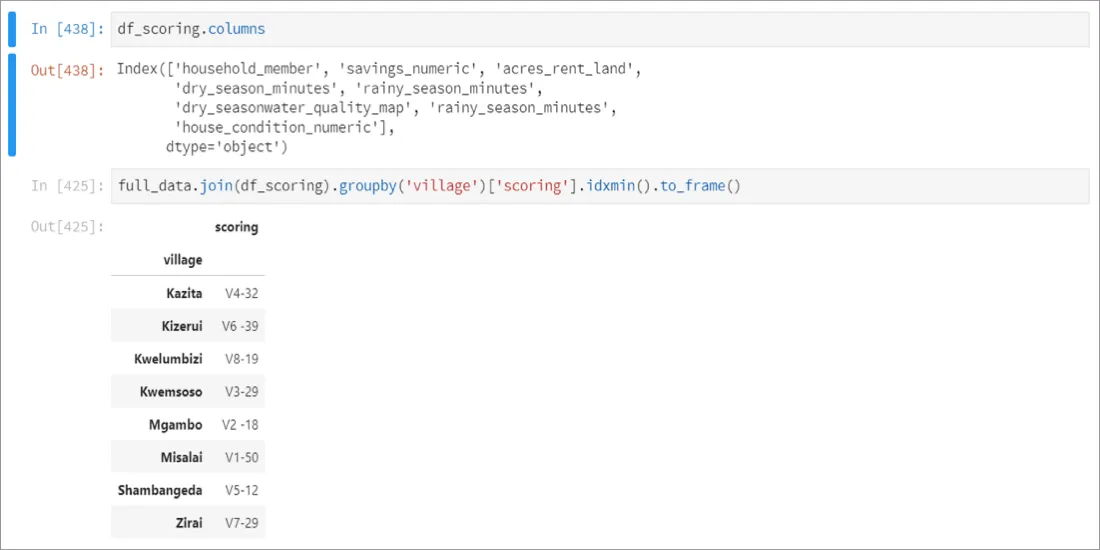
In answering question three for instance one group created a vulnerability index to help relief organizations. The group augmented survey data with new variables and then aggregated the data in order to (1) identify vulnerable households in each village and (2) allocate resources so the most vulnerable households are prioritized.
If you would like to learn more about fostering sustainable development with Location Intelligence then make sure to read our recent case study on measuring food insecurity in Ethiopia with spatial analysis Download Today!
Data visualizations map water accessibility
Another method for exploring this data involved building data visualizations. In the map below each village is represented with a graduated circle proportionate to the population size.
This data also reveals how long it takes for each village to travel to a water source. The data visualization below maps travel time using the same collector types as in the previous map.
While the average time for all villages clocks in at an alarming 46 minutes and 45 seconds the severity of this problem is much worse for some villages than others. Selecting the autostyle feature on average time to water source reveals that adult women in Zirai travel approximately 2 hours and 21 minutes for water.
More generally participants discovered that in households where women made most of the decisions they not only continued to collect water but walked further and carried more liters on average than men as well.
Conclusion
In addition to helping raise awareness on the global water crisis WaterHack 2018 was able to highlight the problem’s multidimensional nature and the impact water insecurity has had on gender inequality. As Earth Day 2018 approaches it is more important now than ever to work with data sharing technologies to find sustainable solutions to combat the effects of climate change.


