4 Powerful Historical Maps Every Data Analyst Should Know


While early cartographers didn't use the term "location intelligence " they were keenly aware that their maps had an intended purpose.
Sometimes that purpose was as straightforward as conveying the dimensions of an unfamiliar city. Other times it was as controversial as exposing racial violence.
Our Chief Product Officer Sergio found these four historical maps which reveal that innovations in a map's perspective data and aesthetics all contributed to the complex five-century evolution of location intelligence.
Leonardo da Vinci “Town plan of Imola ” 1502
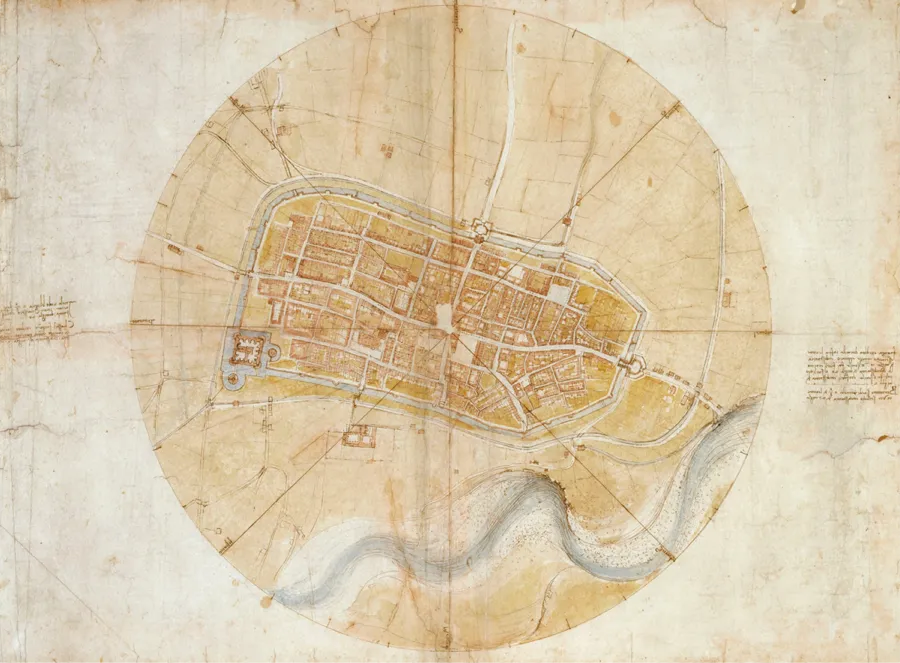
In 1499 Cesare Borgia a general from Rome conquered the city of Imola in northern Italy. Now responsible for defending the unknown territory Borgia commissioned Leonardo da Vinci to map it.
What da Vinci produced looks familiar because it uses the same bird's-eye perspective as Google Maps (called ichnography) but this technique was neither obvious nor easy.
Before da Vinci cartographers primarily used an "oblique perspective" that showed a city's various elevations but da Vinci rightly surmised that a flat point of view would better align with Borgia's desires.
However without aerial photos da Vinci had to rely on meticulous measurements of every building road and plot of land. Though he slightly distorts a few areas for aesthetic reasons his map is a fairly precise rendering of Imola and the oldest surviving record of ichnography.
Petrus Plancius "The Molucca Islands " 1594
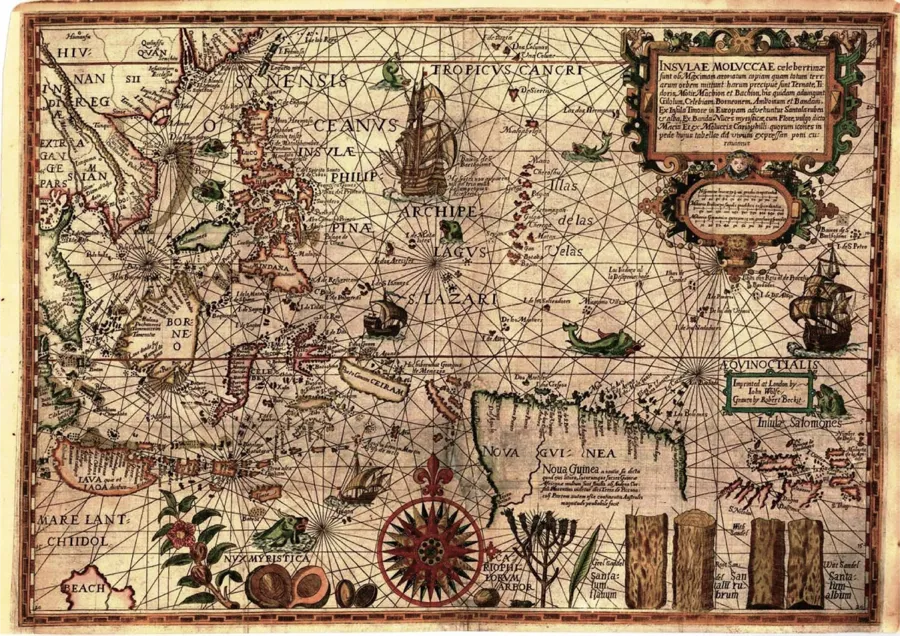
In the late 16th century Portugal was a global maritime power with trade outposts on every continent except Australia and such a commanding fleet required equally sophisticated maps.
Twenty-five years before Plancius published "The Molucca Islands " Gerardus Mercator had solved the problem of representing Earth's spherical shape on a flat surface. But the technique required calculations that were too complex for most cartographers and wasn't widely used.
Plancius' map reveals that he understood not only the mathematics involved but also the psychology of how to sell a new perspective.
By using rich colors filling empty spaces with fantastical drawings and reminding sailors of their commercial aspirations with illustrations of exotic spices Plancius ensured that of the many maps available at the time his became the standard.
Matthew Fontaine Maury "Whale Chart " 1851
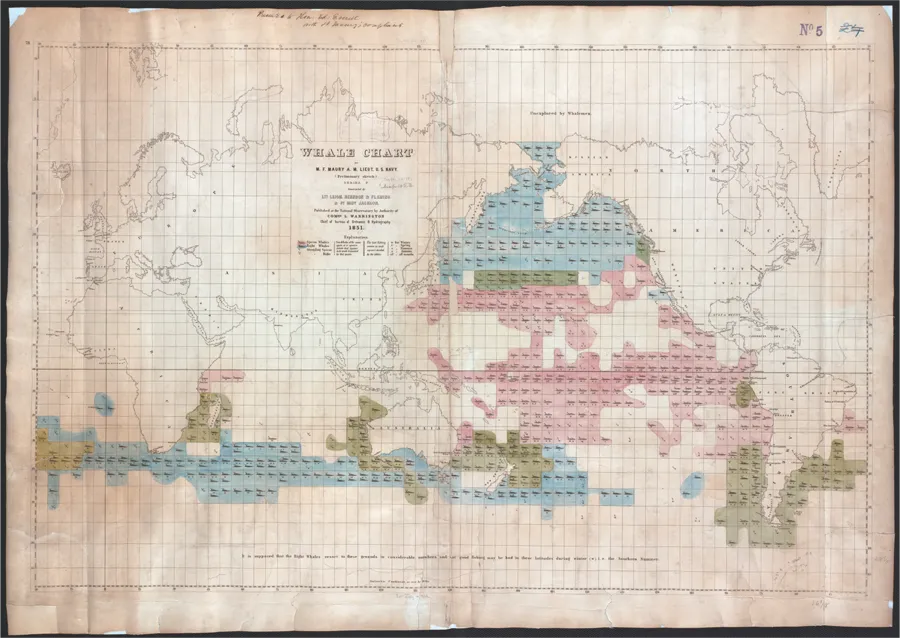
Before the invention of kerosene the preferred way to produce light was whale oil. A single whaling expedition could net million of dollars in profit and unfortunately the potential extermination of some of the world's smartest marine mammals.
In regards to location intelligence Maury's map is important for two reasons. First it's an early example of crowdsourcing. Maury designed special logbooks to track weather winds currents and water temperatures and distributed them to whale hunters. In exchange for their recordkeeping they received the whale chart pictured above which one sailor called "a precious jewel. . . sought for by all interested in whaling."
Second it introduced a new kind of location intelligence. Instead of conveying information about fixed points it offered something much more complex and therefore valuable: a prediction of where mariners were most likely to succeed.
William Bunge "Where Commuters Run Over Black Children on the Pointes-Downtown Track " 1971
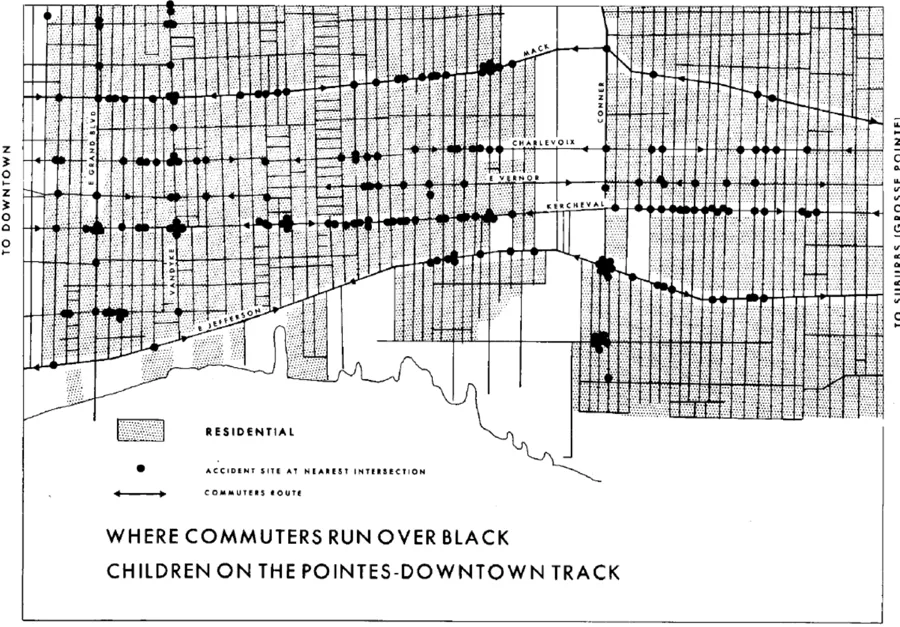
Bunge's map is a provocative and tragic culmination of the previous four. It uses a bird's-eye perspective to give a holistic view of the chosen area it reveals navigational routes and patterns (those of commuters in Detroit) and it relies on data collected from various sources including local residents newspapers and police reports.
What Bunge's map adds though is an implicit argument that transcends the data it depicts.
As a geography scholar commented "Any Detroiter would have known that. . . this is a map of where white people as they rush to and from work run over black children. . . It is a map of racist infanticide a racial child-murder map." In that regard Bunge's work doesn't just depict the world. It helps to change it.
To see more of Bunge's work check out Radical Cartography and Theoretical Geography.
As the technology behind cartography evolves so too does location intelligence. To keep ahead of the latest trends (and to learn more about cool maps like da Vinci's ichnography) subscribe to our CARTO 5 newsletter.