COVID Vaccine: Mapping Rollout & Optimizing Supply Chain


With over 224 million doses of COVID vaccine having been administered to date worldwide this week also sees the first shipments of the COVID-19 Vaccines Global Access (COVAX) arriving in low- and lower middle-income countries to ensure global equitable access.
Distribution of the various vaccines now available including freight logistics and storage involves many spatial aspects. At the end of last year when the vaccines were first starting to rollout we looked at how Location Intelligence can play a role in the optimization of cold chain transportation.
As the rollout picks up pace and more types of vaccine become available many public and private organizations are using location data to ensure an efficient and equitable immunization strategy.
Combining Open Data in New York State
With over 1.6 million cases and nearly 50 000 deaths since the beginning of the pandemic New York State has been a region hit particularly hard. As of time of writing nearly 3 million residents in the state equating to 15% of the population have received at least one vaccine dose.
Using publicly available information from the Centers for Disease Control and Prevention (CDC) and other sources our own Data Science team built the interactive map below which includes a number of data sets including:
- CDC Social Vulnerability Index
- Pharmacies Hospitals & Schools
- COVID Rates
- Mask Utilization
By changing the viewable map area it is possible to view a listing of all hospitals pharmacies and medical facilities (potential sites for the administration of vaccines) alongside population figures including those aged over 65 and within a minority.
The filters on the right hand side allow the map to be updated by drive time facility type and count and demographics with the data available for each selected census tract also available for analysis.
Ensuring Equitable Access in Philadelphia
PlanPhilly a project of WHYY News provides in-depth original reporting on Philadelphia's neighborhoods. Using data from the Philadelphia Department of Public Health they looked into where the city's vaccine supply was going and found that it was "flowing to wealthy suburbs 4 times faster than many city neighborhoods".
Reporting on disparities such as these can allow authorities to respond and ensure more equitable vaccine distribution. In this case and as reported by PlanPhilly the city is making efforts to reach people in undervaccinated ZIP codes through its own neighborhood clinics and using its ZIP code map to oversample residents in undervaccinated ZIP codes when inviting people to future events.
Dose Availability in Texas
NBC Universal created a map detailing first dose vaccine availability at clinics pharmacies and other care facilities across the state of Texas giving residents and decision makers the ability to see at a glance where the doses are available.
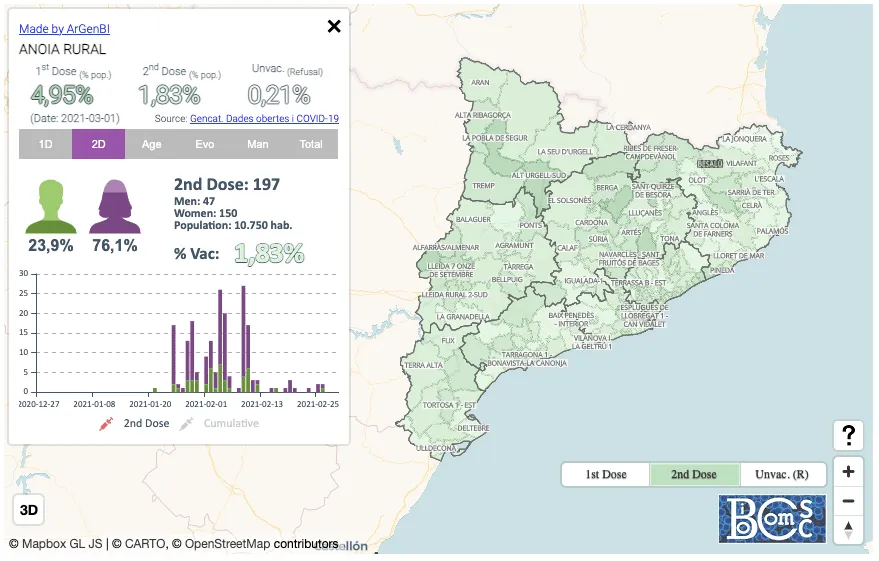
Vaccination Rates in Catalonia
Using data from the Generalitat de Catalunya the Research Group on Computational Biology and Complex Systems of the Physics Department at the Universitat Politècnica de Catalunya visualized vaccination rates in the region in order to analyze the distribution and demographics (gender and age) of those receiving the first and second doses of the vaccine.
The pop-up within the maps also shows the evolution by age group the distribution of vaccines by manufacturer as well as a summary of the total vaccinated population in the region.
Now that vaccinations are underway the big question is when will life return to some sort of normalcy? With the latest vaccine rate reported at 6.79 million a day it will take an estimated 4.5 years to cover 75% of the world’s population with a two-dose vaccine.
However with this rate increasing new vaccines becoming available and the adoption of new technologies including Spatial Data Science we will be able to meet this goal sooner.
Want to learn more about COVID-19 use cases?