

5 ways to transform spatial analysis for environmental resilience


Public sector decision-makers are navigating unprecedented complexity: disaster resiliency, aging infrastructure, regulatory pressures, and rising demands for transparency and accountability. At the heart of tackling these challenges is spatial data - and the ability to leverage it in ways that are proactive, scalable, and accessible.
But too often, the potential of spatial analysis is undercut by outdated technology and fragmented data environments. Critical insights are trapped in silos, decision-making is slowed by manual processes, and cross-agency collaboration is stifled. The result? Delayed responses, missed opportunities, and reduced public trust.
So… what can organizations do to change this? Here are five ways to transform your spatial analytics to better support environmental resilience, improve efficiency, and enable data-driven decisions.
1. Unify disparate data to break down silos
Spatial data in the public sector is often scattered across legacy GIS platforms, spreadsheets, isolated databases, and local storage. This fragmentation slows collaboration, leads to redundant work, and increases the risk of missed opportunities.
By analyzing spatial data directly in cloud lakehouses like Google BigQuery, agencies can skip the slow, costly Export-Transform-Load (ETL) processes that traditional GIS solutions require. The cloud-native approach - offered by platforms like CARTO - enables real-time collaboration, not just within GIS teams but across departments such as emergency response, planning, and public health. This makes it even easier to leverage data from sources like Google Earth Engine - check out our recent webinar Analyzing the Earth at Scale to see this in action!
With everything running in a unified, governed environment, agencies gain a clearer view of their operations and can act more decisively, together.
💡 In action: flood risk and social vulnerability assessments
The visualization below (explore in full-screen here) allows users to understand flood risk and social vulnerability levels across Texas, as well as their impact on agency-owned assets. Created in CARTO Builder - our tool for creating rich, interactive and large-scale visualizations - viewers can use the interactive elements to pinpoint assets of interest, all assisted by AI Agents.
The data used to build this analysis - such as flood risk, demographics and public sector infrastructure - are often housed in separate systems across departments. By unifying datasets in BigQuery, agencies gain a comprehensive view to plan, coordinate, and make cost-efficient decisions faster.
Want to learn how your organization can benefit from a more unified approach to spatial analysis? Request a demo from one of our experts!
2. Prioritize resources, at scale
Too often, spatial projects in the public sector are treated as one-off exercises, disconnected from ongoing decision-making. Decision-makers can struggle navigating huge volumes of results and manually reviewing data, which slows progress and risks missing the most critical priorities.
To make spatial analysis a trusted input into policy and operational decisions, it needs to become more automated, parameterized, and repeatable. Decision-makers can then focus on high-impact projects instead of wrestling with masses of data.
💡 In action: automating urban heat priority scoring and interventions
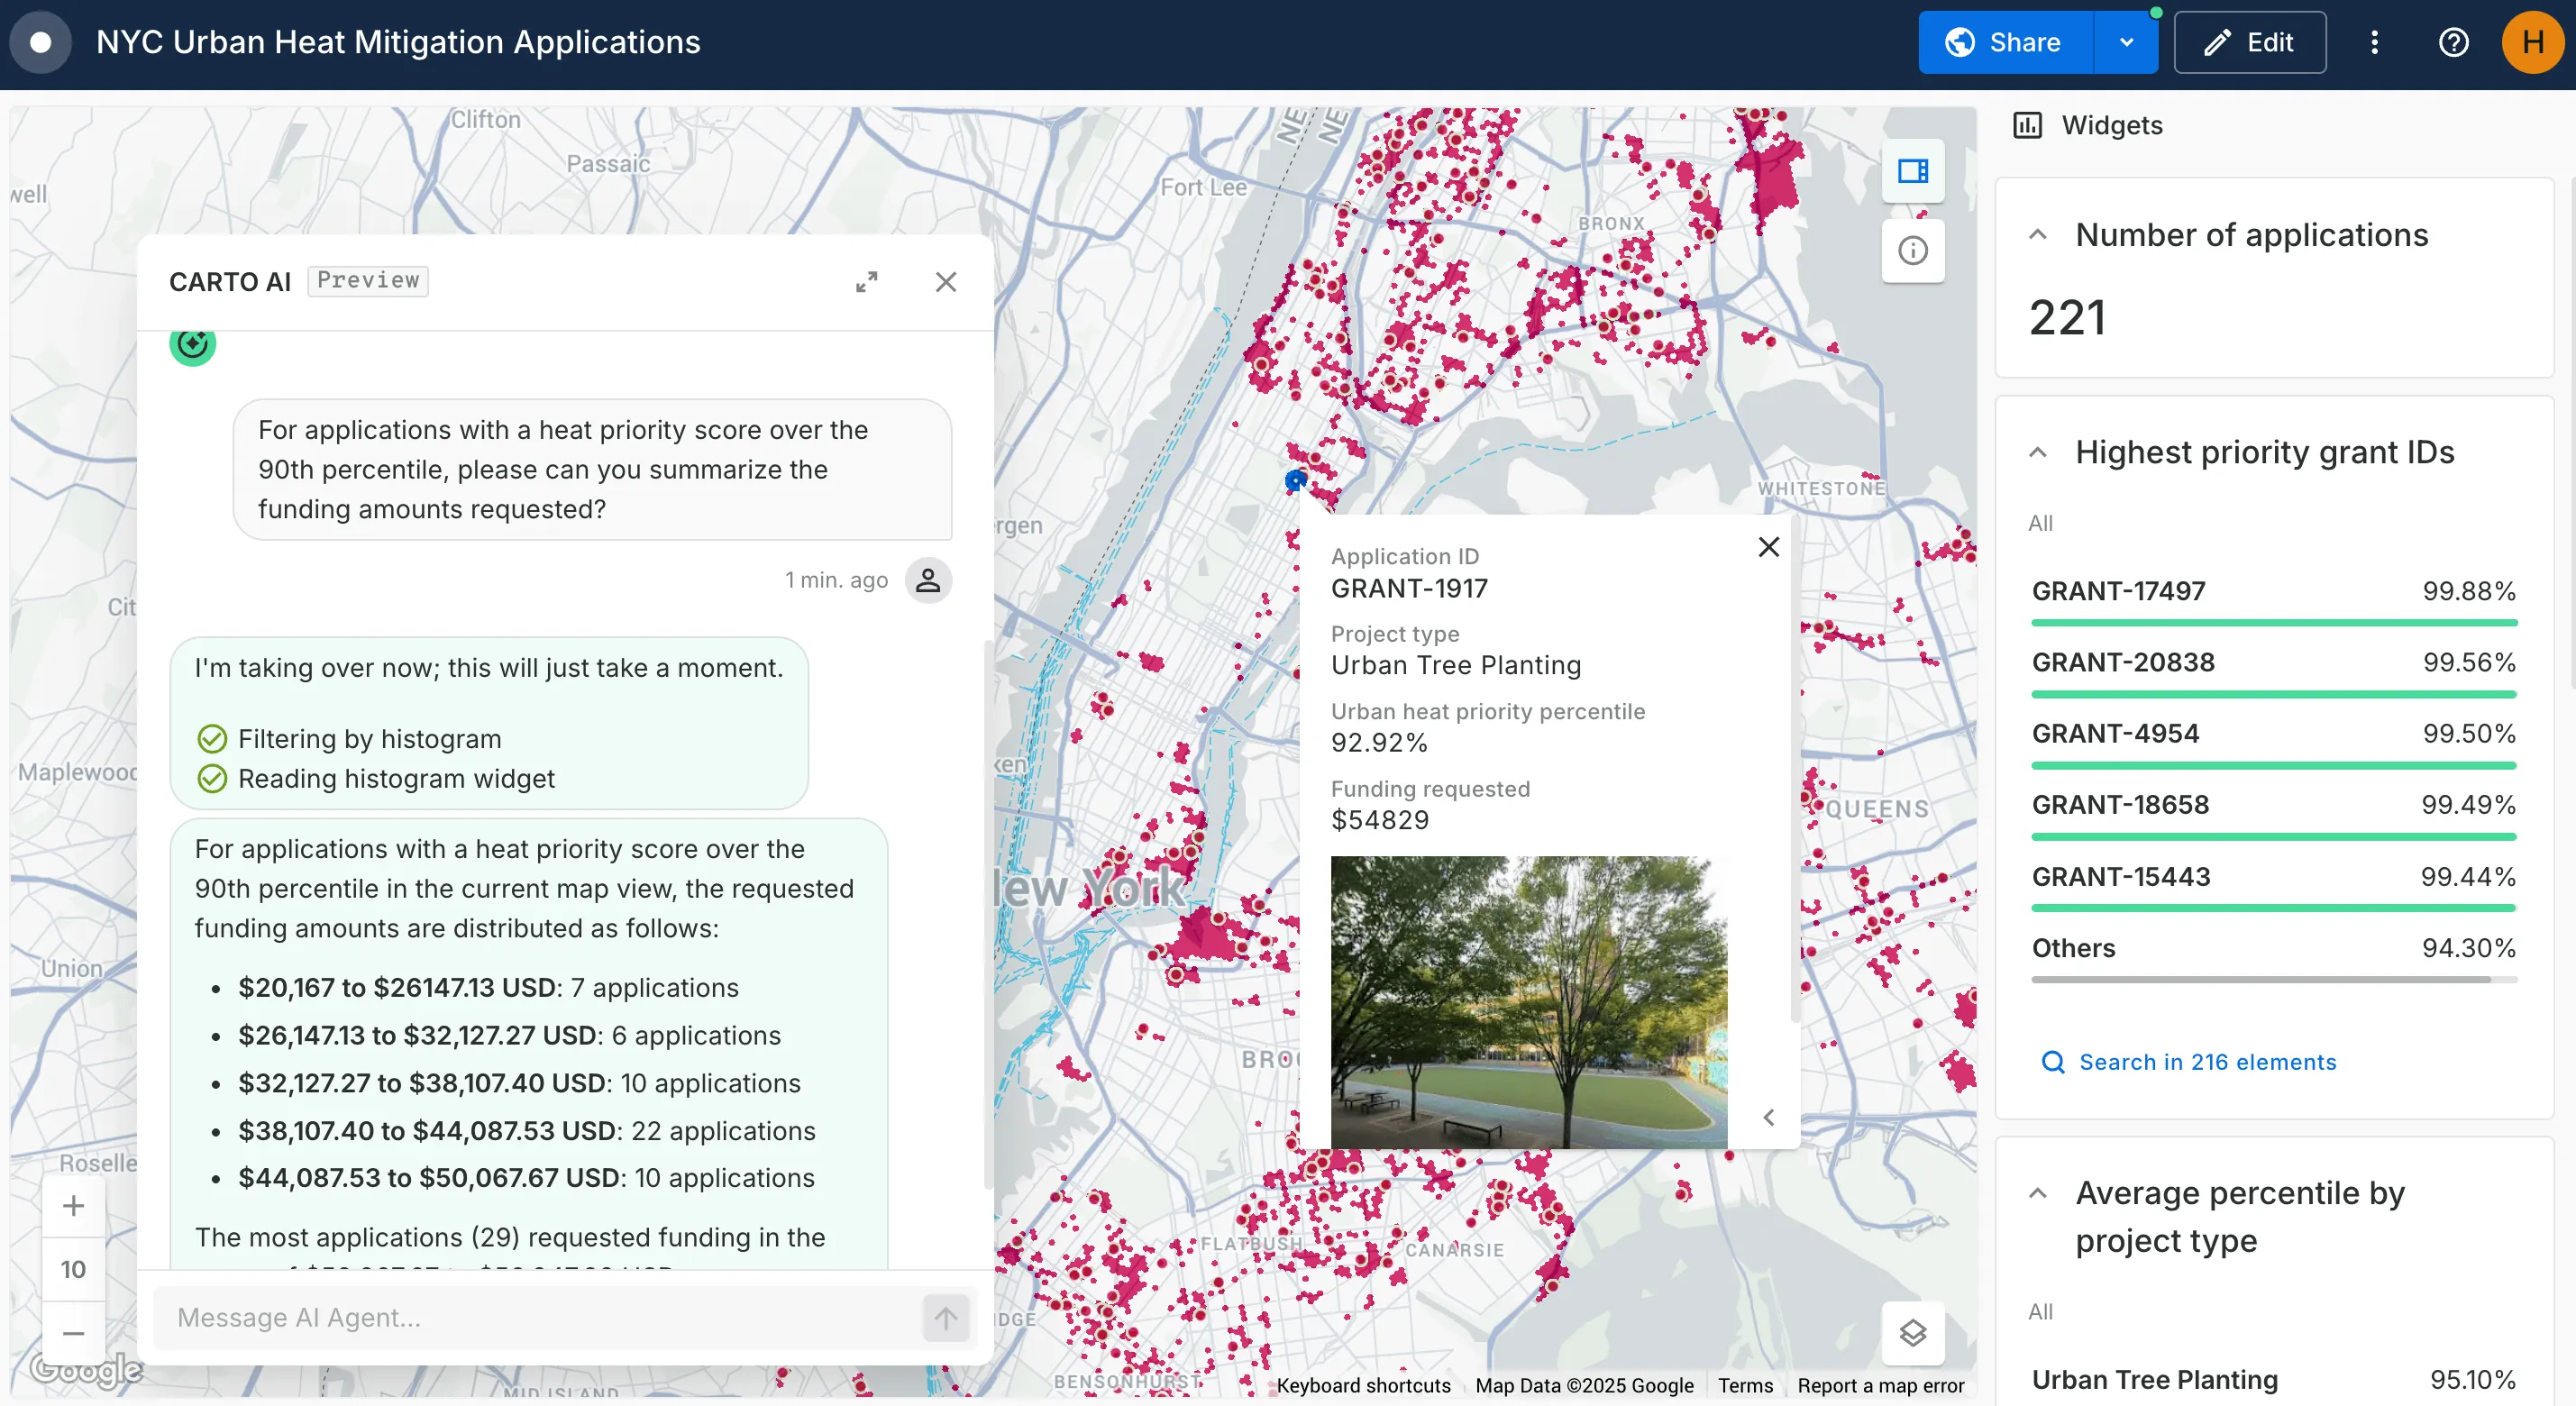
In this map (explore in full-screen here), scores ~3,000 fictitious urban cooling project applications based on population density, social vulnerability, tree coverage, and proximity to green space.
Those making funding decisions can use this to prioritize interventions faster, rather than individually assessing all 3,000 applications. This creates faster, fairer, and more repeatable decision-making - critical for scaling environmental resilience and adaptation in the face of rising heat.
3. Go real-time
Building environmental resilience isn’t just about sustainable, long-term planning - it also means being ready to respond to rapid change with real-time analytics. However for many agencies, real-time analytics have been out of reach behind a high skills barrier.
That’s changing - organizations are now able to access real-time data through low-code solutions, allowing agencies to deliver timely insights where - and when - they’re needed most.
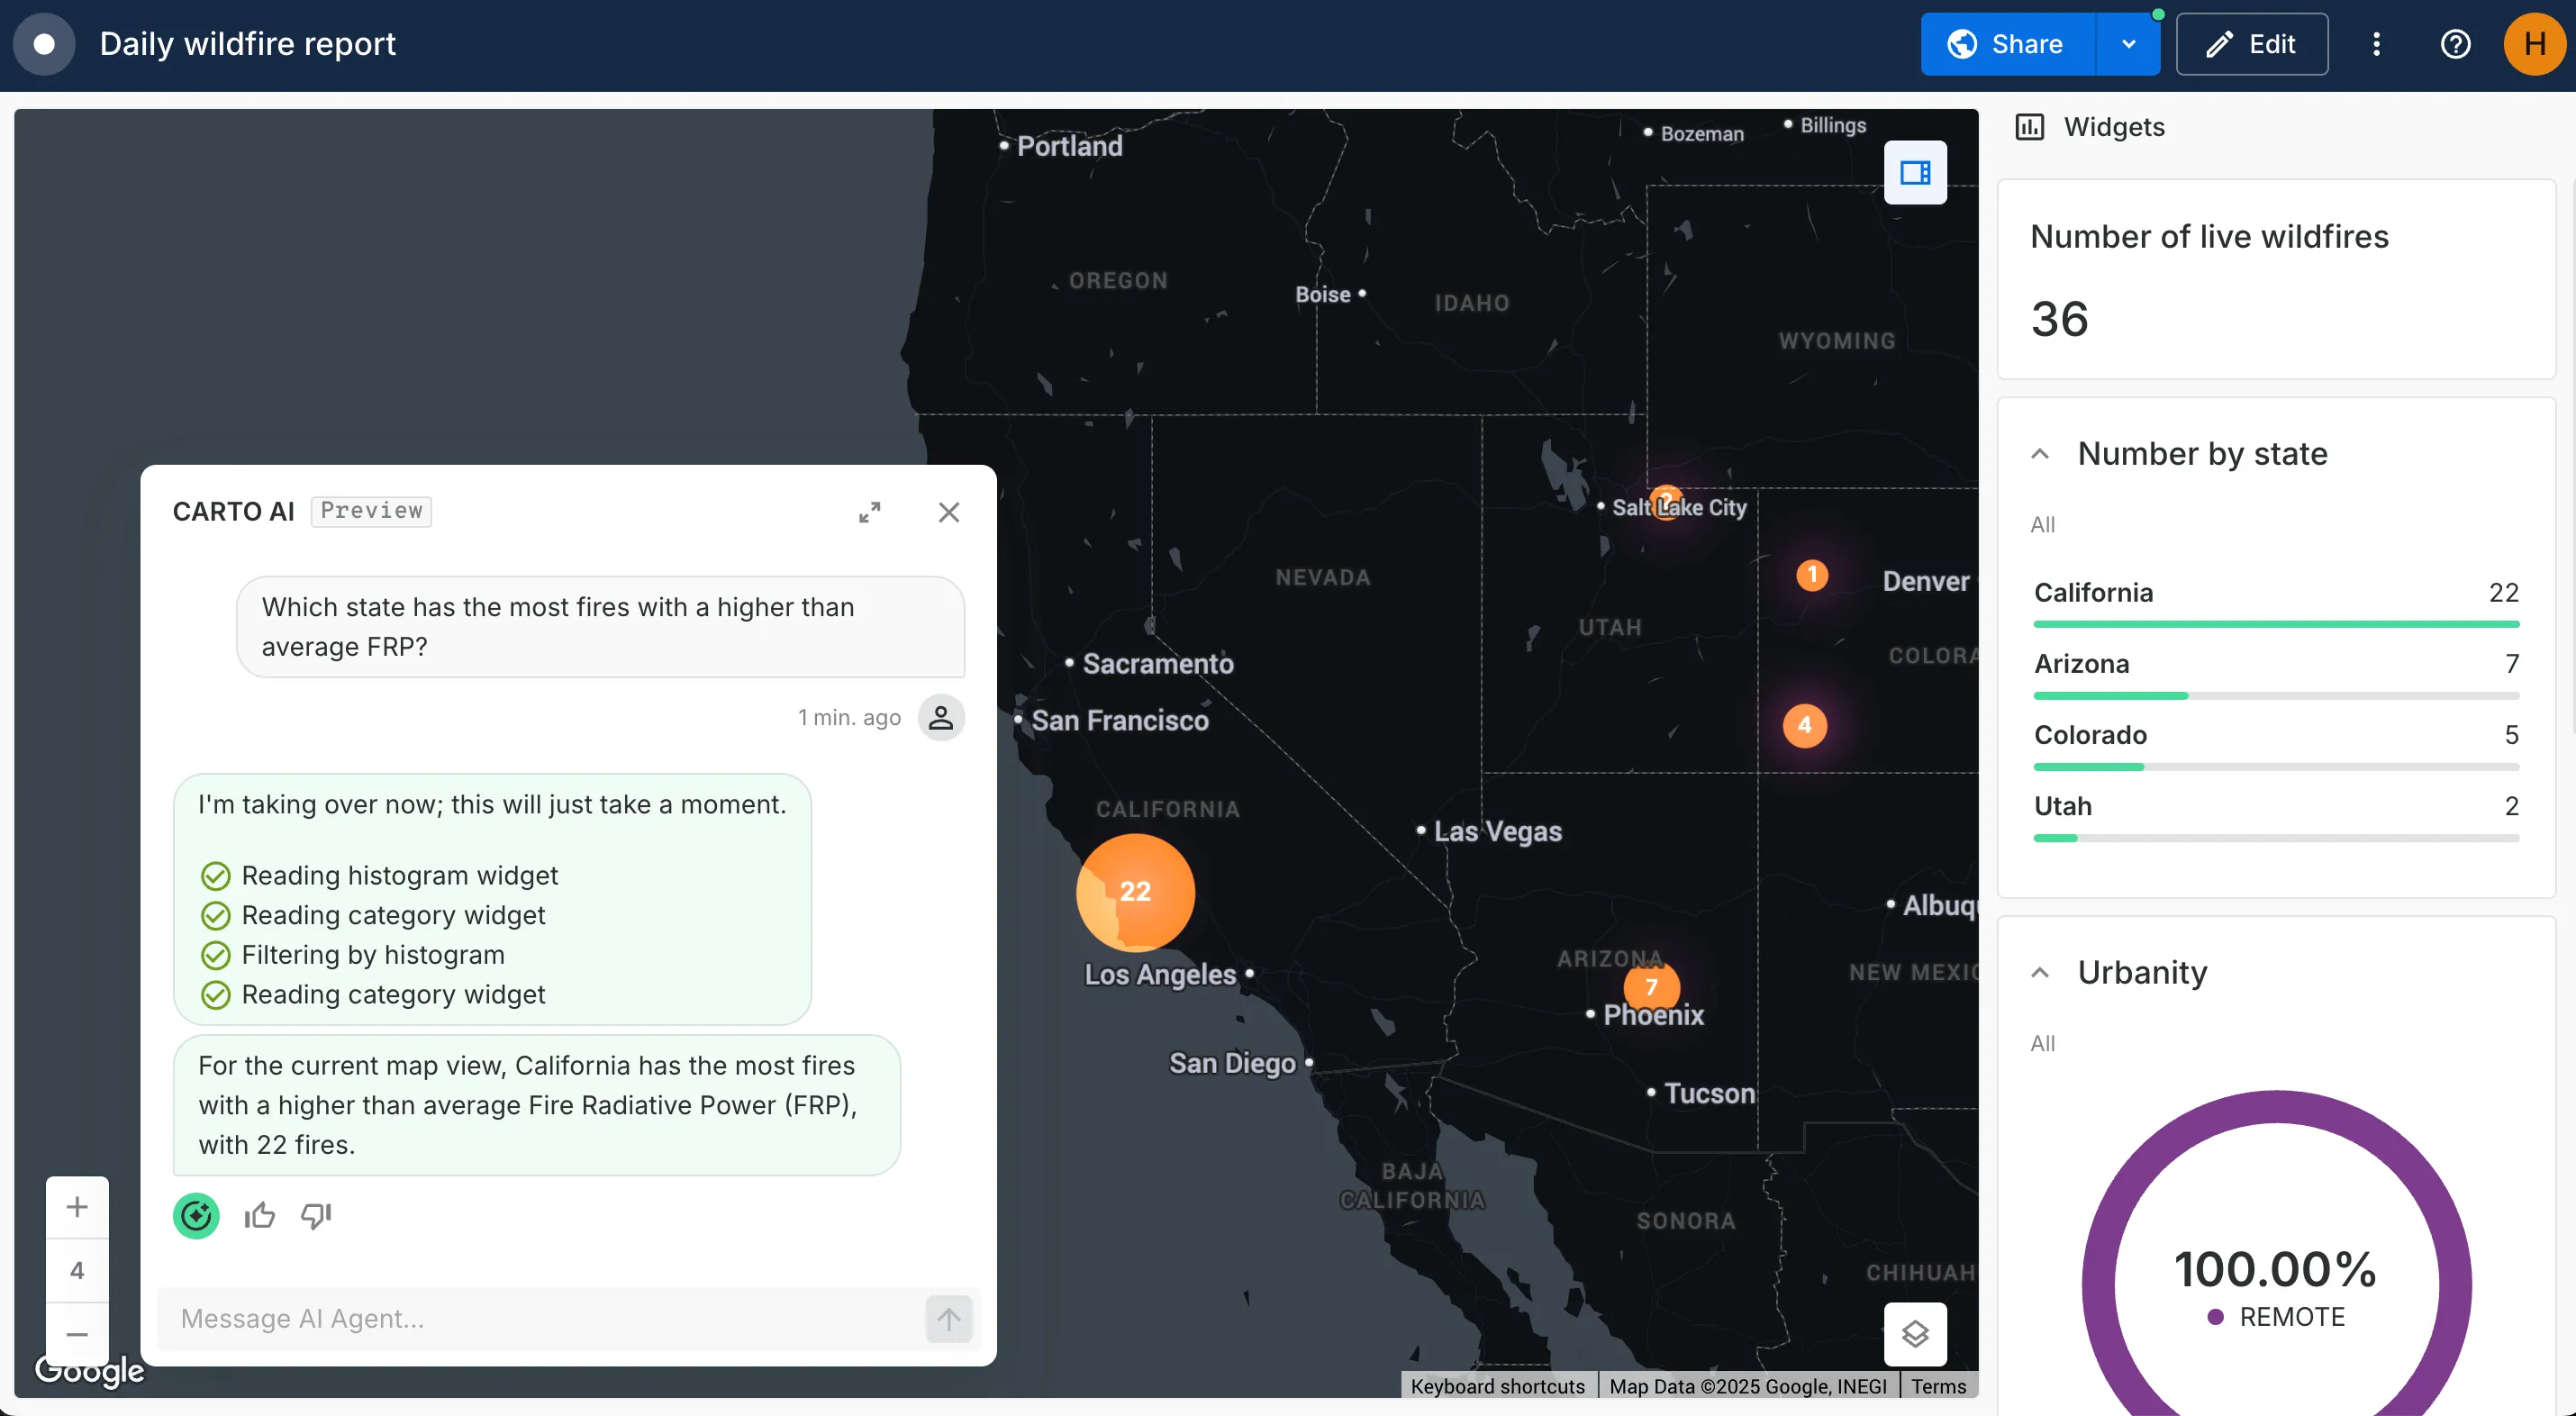
💡 In action: real-time wildfire alerts
Here’s an example of how your team can work with real-time data - without a single line of code!
The screenshot below shows analysis of wildfire data built in CARTO Workflows - our low-code tool for automating & operationalizing spatial analysis. This workflow pulls live wildfire occurrences from NASA’s Fire Information for Resource Management System (FIRMS) API and enriches them with demographic and administrative data, running automatically every day.
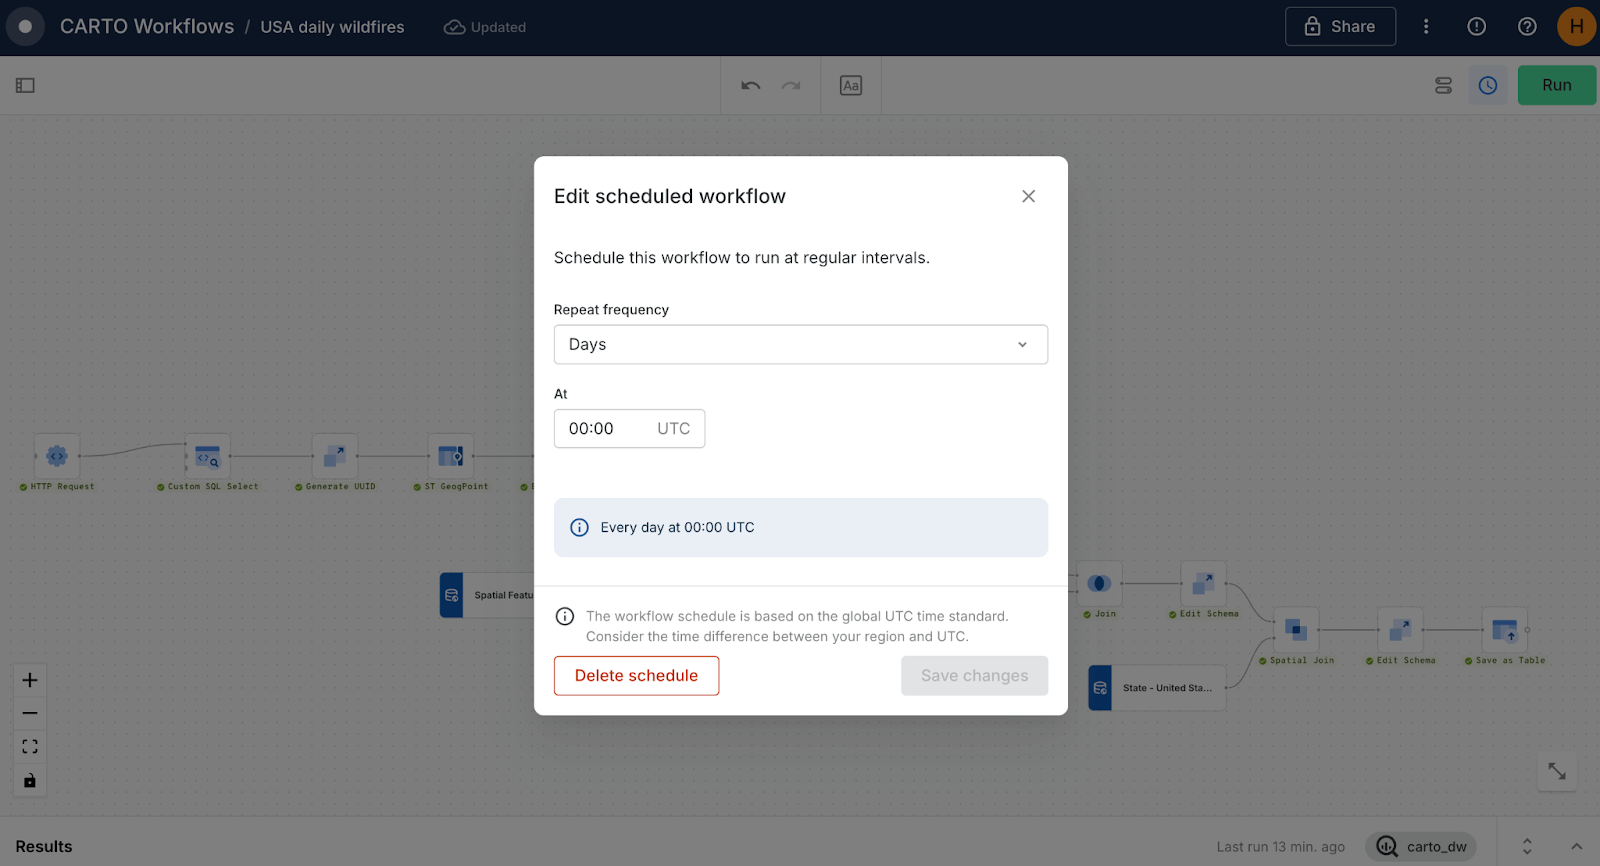
The result? Explore for yourself below, or in full-screen here! With automatic daily updates and built-in filters to help the user understand population and urban exposure, analysts can follow this approach to deliver operational, always-fresh intelligence - without waiting on manual ETL processes or complex scripting.
Check out our webinar It’s time to go real-time! for more examples on leveraging real-time analytics for your organization!
4. Drive time savings with automation
Many public sector teams can spend hours - or even days - every week working manually on straightforward, repeatable tasks - such as updating zoning compliance reports or filling out recurring environmental forms. These processes are essential but often slow and prone to human error.
Platforms like CARTO can save agencies this time by enabling them to automate workflows and run assessments - all without manual intervention. Teams spend less time on repetitive work - for example, we’ve seen CARTO users report over 60% time saved when creating visualizations. They can instead focus on the higher-value task of decision-making, while processes become faster, more consistent, and fully traceable.
💡 In action: development approvals around wetlands
This analysis (open in full-screen here) auto-assesses development applications based on their proximity to designated wetlands across Miami-Dade and Broward Counties, Florida. Applications are assigned an automatic pass, fail or “further mitigation needed” depending on whether they fall inside, outside or within a buffer region of these sensitive ecological areas.
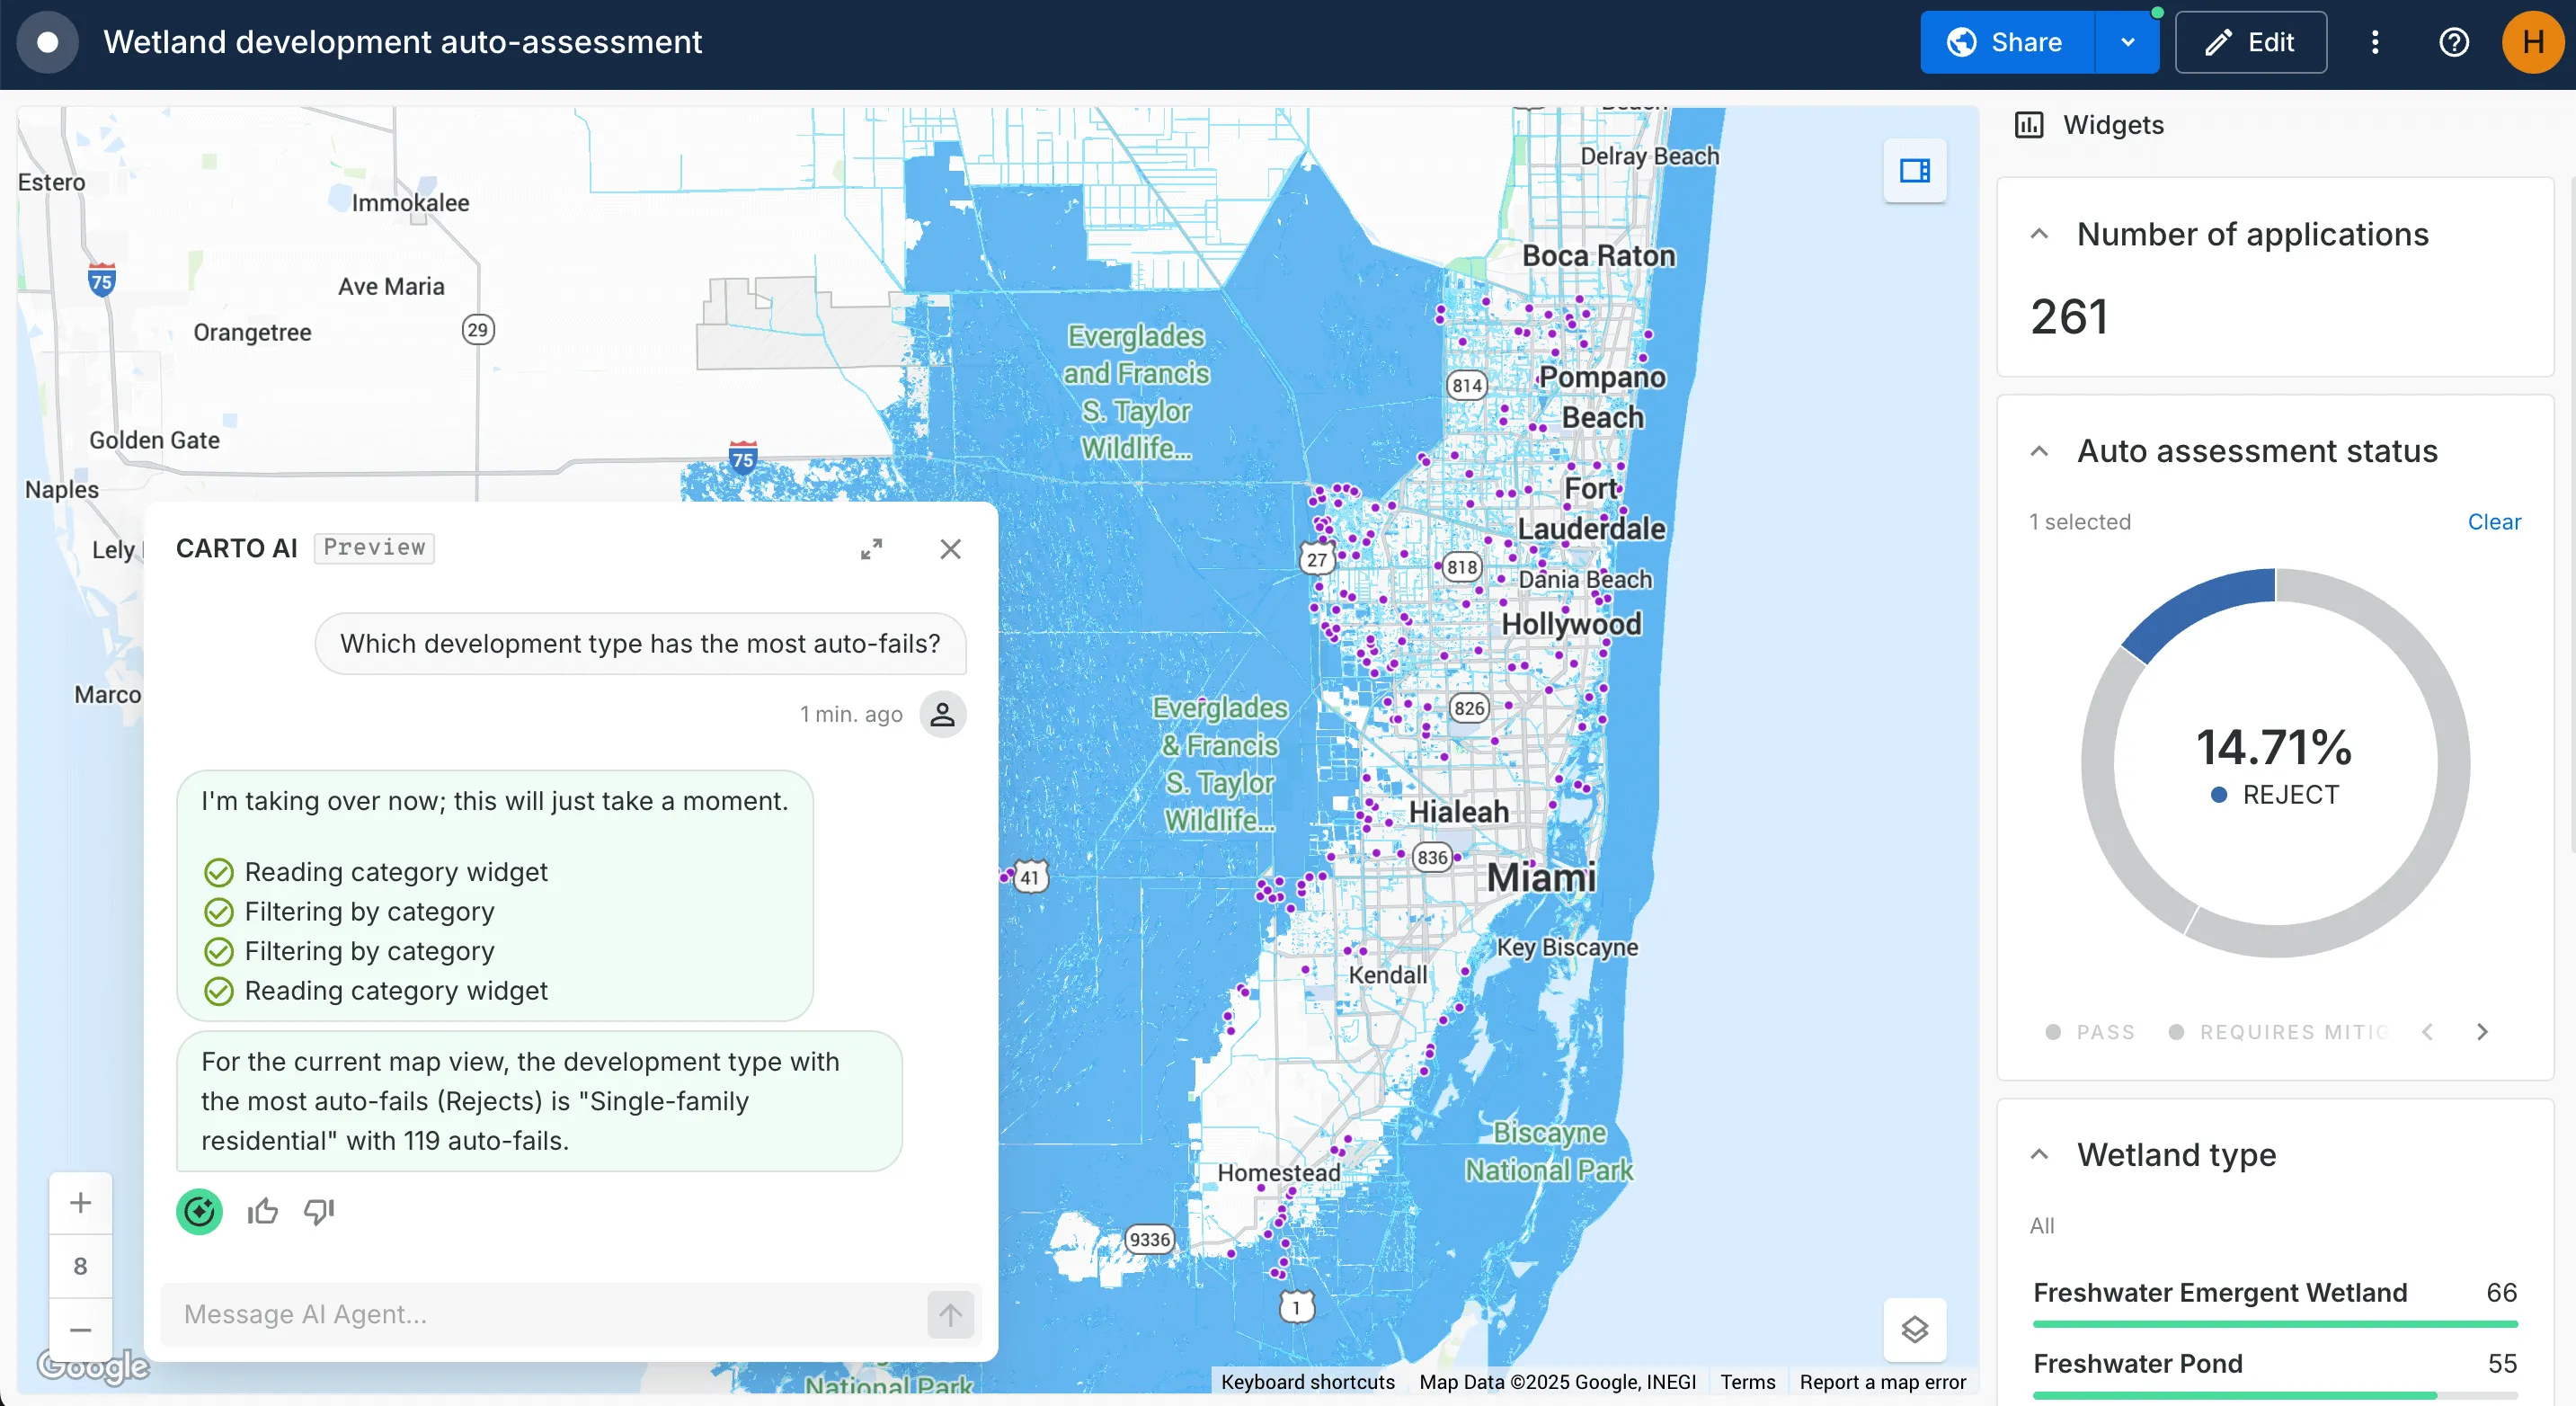
The best part? This whole process has been automated so that absolutely anyone can have a development location assessed - all without the support of a GIS Analyst. All they need to do is fill in this Google Form (try it yourself!) with a development location and type. Every time this form is completed, the Workflow is automatically triggered to run the analysis and add the location to the map. Make sure to refresh the map in 5-10 minutes to see the result of your auto-assessment!
This process could equally be configured to automatically email the applicant with their results, or notify a planning officer every time an application is auto-passed. This approach cuts out potentially hours of manual analysis and adds an additional layer of transparency to the planning process.
Learn more about building more automation into your spatial workflows here.
5. Drive accountability & transparency
For public sector agencies tackling environmental adaptation, maps and visualizations are more than nice-looking outputs; they’re tools for accountability. They help explain the “why” behind policy, bring communities into the conversation, and make complex trade-offs visible.
Too often, these public-facing stories are created separately from the analysis that informs them, requiring exports, duplicated software costs - and sometimes wholly different expertise. This adds risk, delays, and inconsistencies - undermining public trust.
An end-to-end platform like CARTO removes that gap. Public-facing dashboards, maps, and reports are generated directly in Google BigQuery from the same secure, governed datasets used internally - no ETL pain, no version drift. Everyone - analysts, decision-makers and the public - are all informed by the same single source of truth.
The result: faster workflows, fewer errors, and stronger trust. When the same data powers both operations and storytelling, transparency isn’t an afterthought - it’s built in.
💡 In action: sharing hazard mitigation impacts
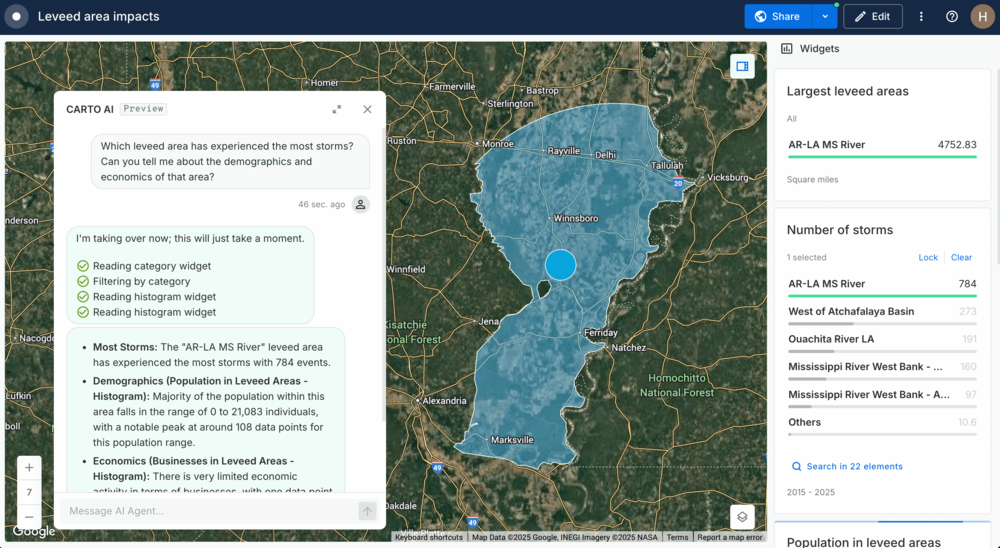
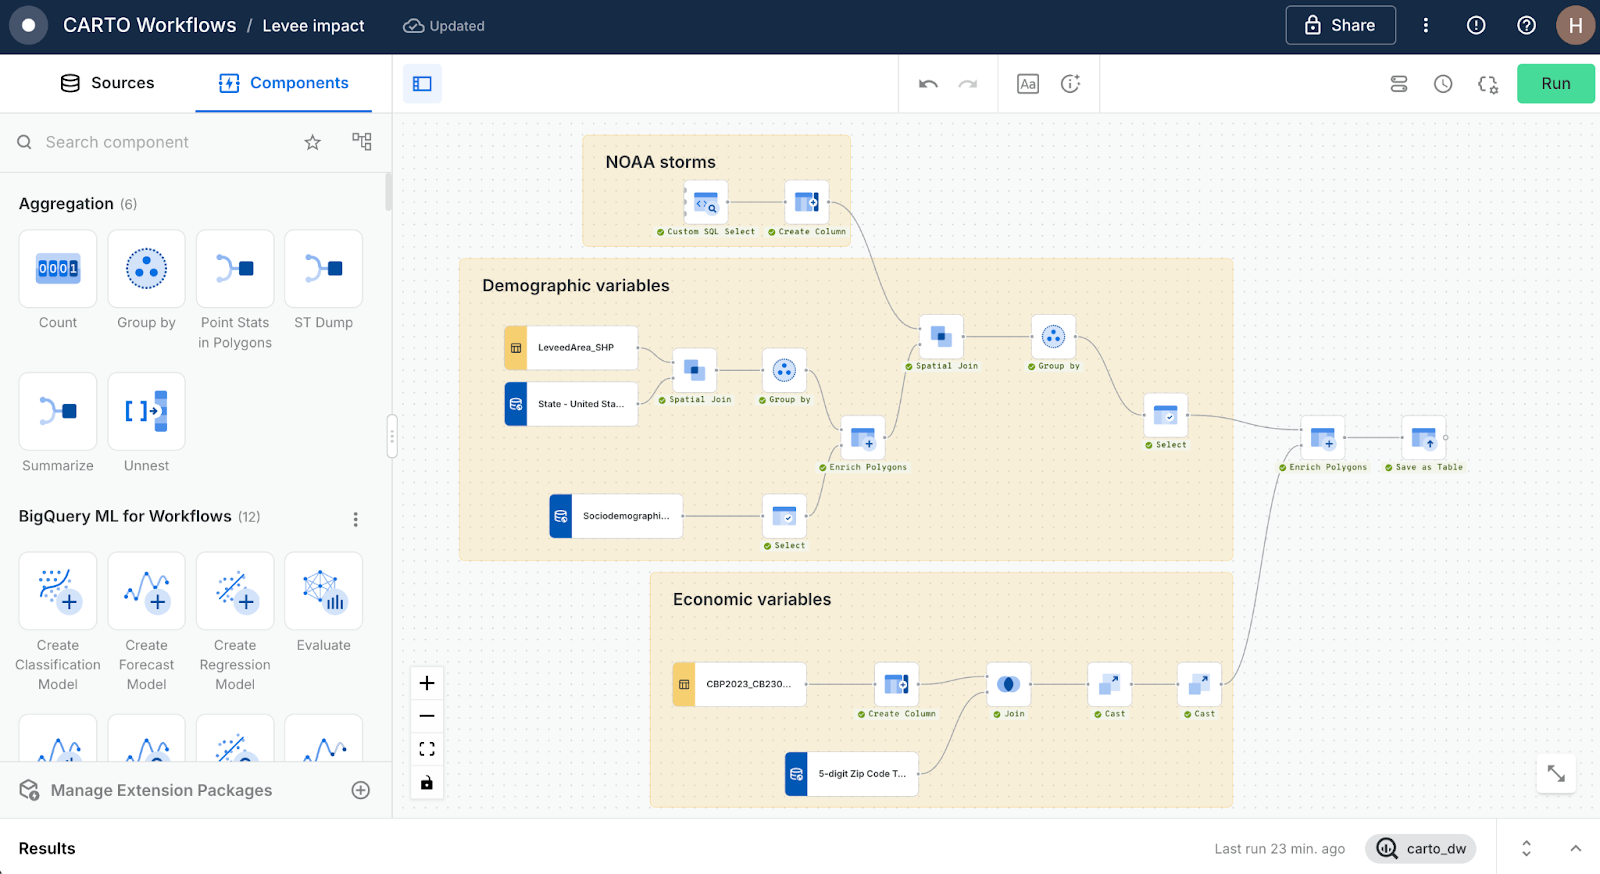
The map above (open in full-screen here) - created in CARTO Builder - allows users to explore leveed areas of the United States. Any area can be clicked on to bring up a sidebar with further information - including the number of storms it has withstood in the last 10 years, and the people and businesses it is protecting. This map is directly updated using the below Workflow, which works by enriching each leveed area with a series of demographic, economic and climate variables - all running natively in BigQuery!
By connecting analysis and storytelling in one workflow, this project ensures that the same trusted data driving operational decisions is what the public sees - building transparency, trust, and shared understanding at every level.
The future of environmental resilience
Building stronger environmental resilience requires connecting analysis, decision-making, and public engagement in a seamless, transparent way. With the right tools, resilience and sustainability stop being reactive - they become embedded in planning, operations, and public trust.
CARTO, running natively on Google Cloud’s BigQuery, enables exactly that, bringing together diverse datasets, powerful analytics, and intuitive storytelling in one secure, scalable environment. Ready to see how? Request a demo and explore what’s possible.
Nienhuis JH, Cox JR, O'Dell J, Edmonds DA, Scussolini P. 2022 A global open-source database of flood-protection levees on river deltas (openDELvE). Nat. Hazards Earth Syst. Sci. 22. 4087-4101. doi: 10.5194/nhess-22-4087-2022


