5 best spatial analytics and visualizations of 2025


As we reflect on the past year and look ahead to 2026, we see how leading organizations are the ones who master the full spectrum of time— learning from the past, acting in the present, and strategically planning for the future.
In this annual round-up, we celebrate 5 key analytics and visualizations on the CARTO platform that empower you to do just that. From automated workflows that eliminate manual work to AI-driven conversations that answer complex questions in seconds, these approaches unlocked new insights and value in 2025.
To say the least, it’s clear 2025 has been a transformational year for CARTO, and for the geospatial industry as a whole. Our community agrees. Over 250+ geospatial professionals weighed in on these trends in our upcoming 4th edition of The State of Spatial Analytics Report.
Sign up for early access here.
Let’s dive in!
Note: We’ve added links to tutorials throughout so you can follow along and recreate these analytics. You can also sign up for a free 14-day trial here.
Historical patterns: The one that helps us look back
The world is not static. The ability to detect shifts in the environment, infrastructure, and human behavior as they happen is what separates reactive strategies from proactive, resilient ones.
01 Risk management
Move past simple alerts to find the real risk signals in your data, beyond where but why, and when.
Space-time anomaly detection analyzes historical trends to find significant event clusters across both geography and time. It creates a statistical fingerprint of emerging hot spots, enabling proactive risk management for everything from crime waves to insurance liabilities.
Dive deeper into this use case for insurance in this blog post and learn how over $16 billion in annual losses is due to property crimes alone.
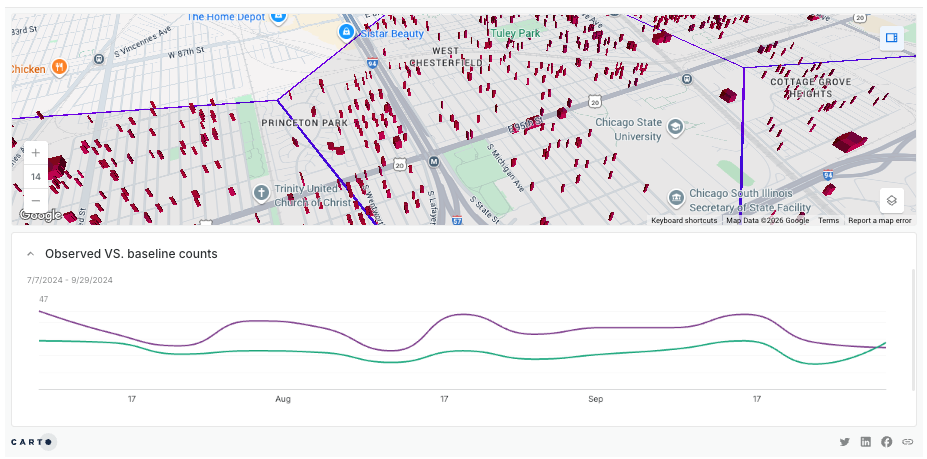
If you want to reproduce this analysis, this workflow template for this example can be found in the CARTO Academy.
Real-time insights: The one that helps us stay present
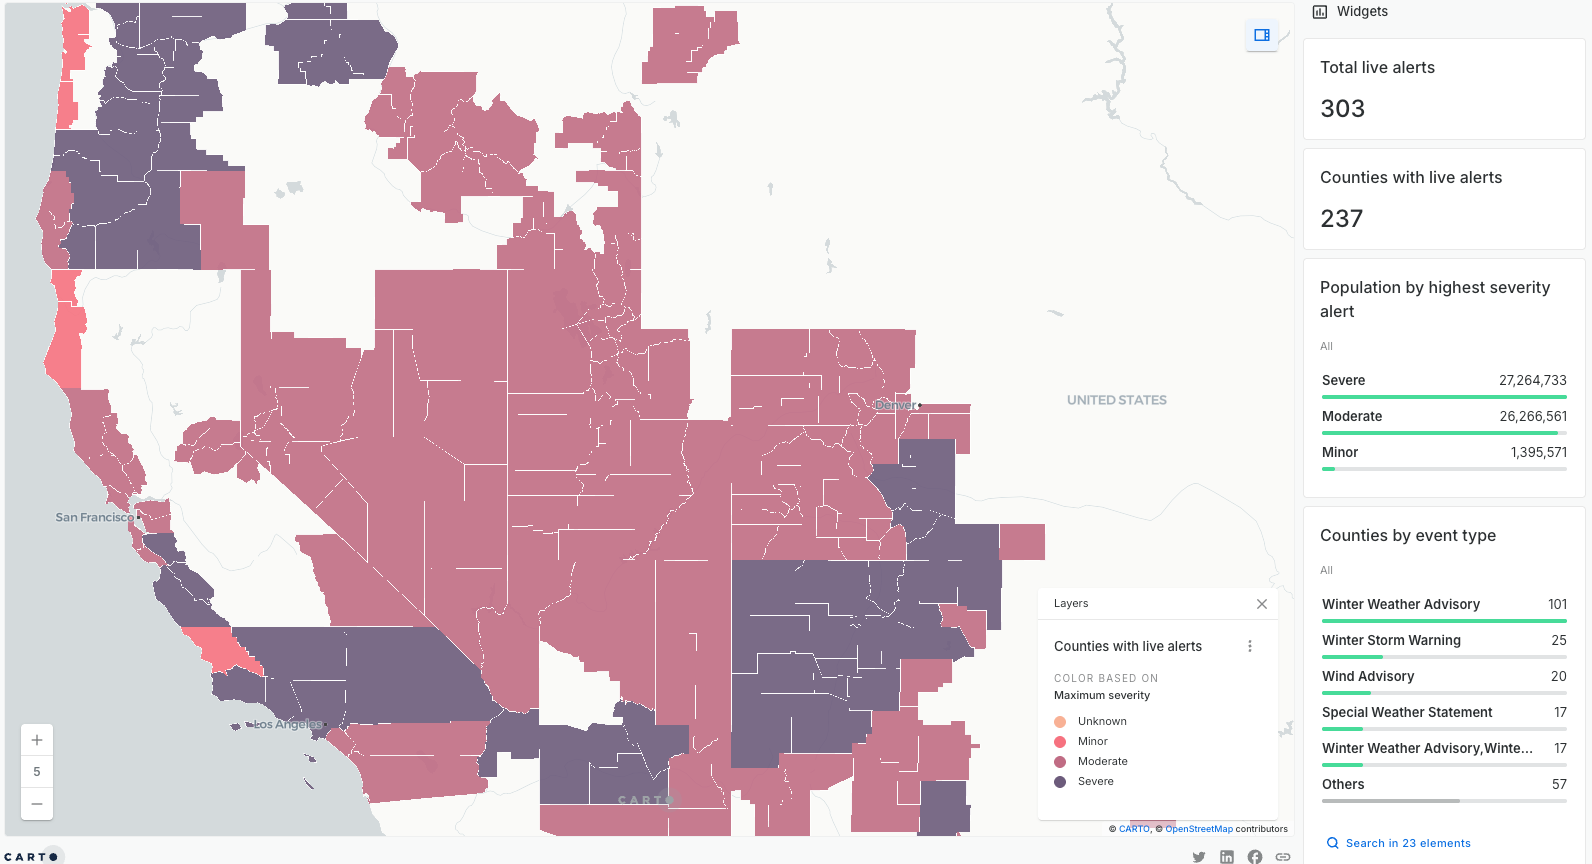
02 Operations management
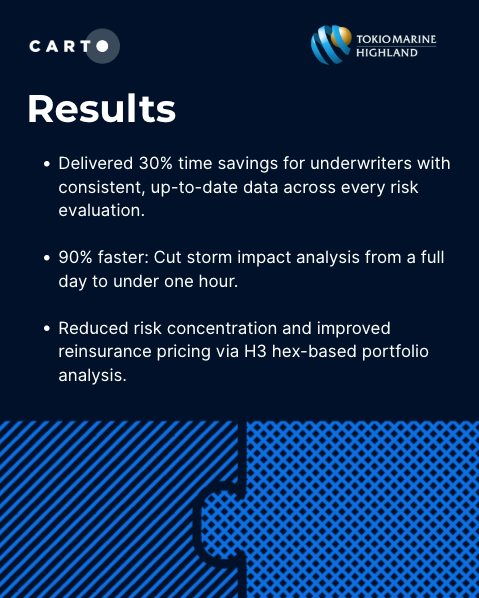
In a world of constant change, relying on static reports is no longer enough. For teams monitoring evolving conditions, like service disruptions, supply chain risks, or incoming storms, automation is essential. Live, always-updated maps ensure that stakeholders have immediate access to the latest insights without manual intervention.
By connecting automated data processing in CARTO Workflows directly to visualization in Builder, you can create a seamless pipeline. A scheduled workflow can refresh your data, run an analysis, and automatically update a map to reflect the new output.
For example, a live weather alert operations or fleet management dashboard can be fully productionized, giving teams a powerful way to monitor risk in real time, prioritize HR or response efforts, and safeguard network continuity without anyone needing to manually push an update.
To learn more how to create a self-service dashboard with live updates check out this blog here!
If you want to reproduce this analysis for live IoT fleet data, this workflow template can be found in our Academy.
Strategic planning: The one that helps us look ahead
Making the right location decisions, whether it’s expanding networks, acquiring new branches, balancing sales territories, or optimizing logistics — it’s fundamental to growth.
With so many variables at play, from customer demand and evolving economic conditions to service capacity and cost, organizations need tools that can model planning scenarios with ease.
03 Site and network optimization
For any organization with a physical footprint, every location decision, opening, closing, or consolidating, carries millions of dollars in potential risk or reward. Yet many still rely on fragmented data or instinct. Smart expansion planning requires a holistic view, treating each location not as an isolated point but as part of a larger network or ecosystem.
For telecommunications and utilities, optimal network planning dashboards allow teams to bring in their own models to include business logic and parameters to identify where new locations might cannibalize existing ones.
For retail and financial services, this may look like enriching drive-times around branches or retail sites with customer sentiment, point-of-sales, and competitor locations. In both cases, flexible data-driven tools enable a strategy of continuous optimization of the entire network, ensuring every location contributes to the overall strategy as dynamics on-the-ground change.
Whether you're a telecommunications organization performing network optimization, a retailer finding the next store location, or a bank identifying branches for consolidation, a data-driven approach is key to unlocking market potential and avoiding costly missteps.
To learn more about the 6 ways to optimize site planning, see this blog post here!
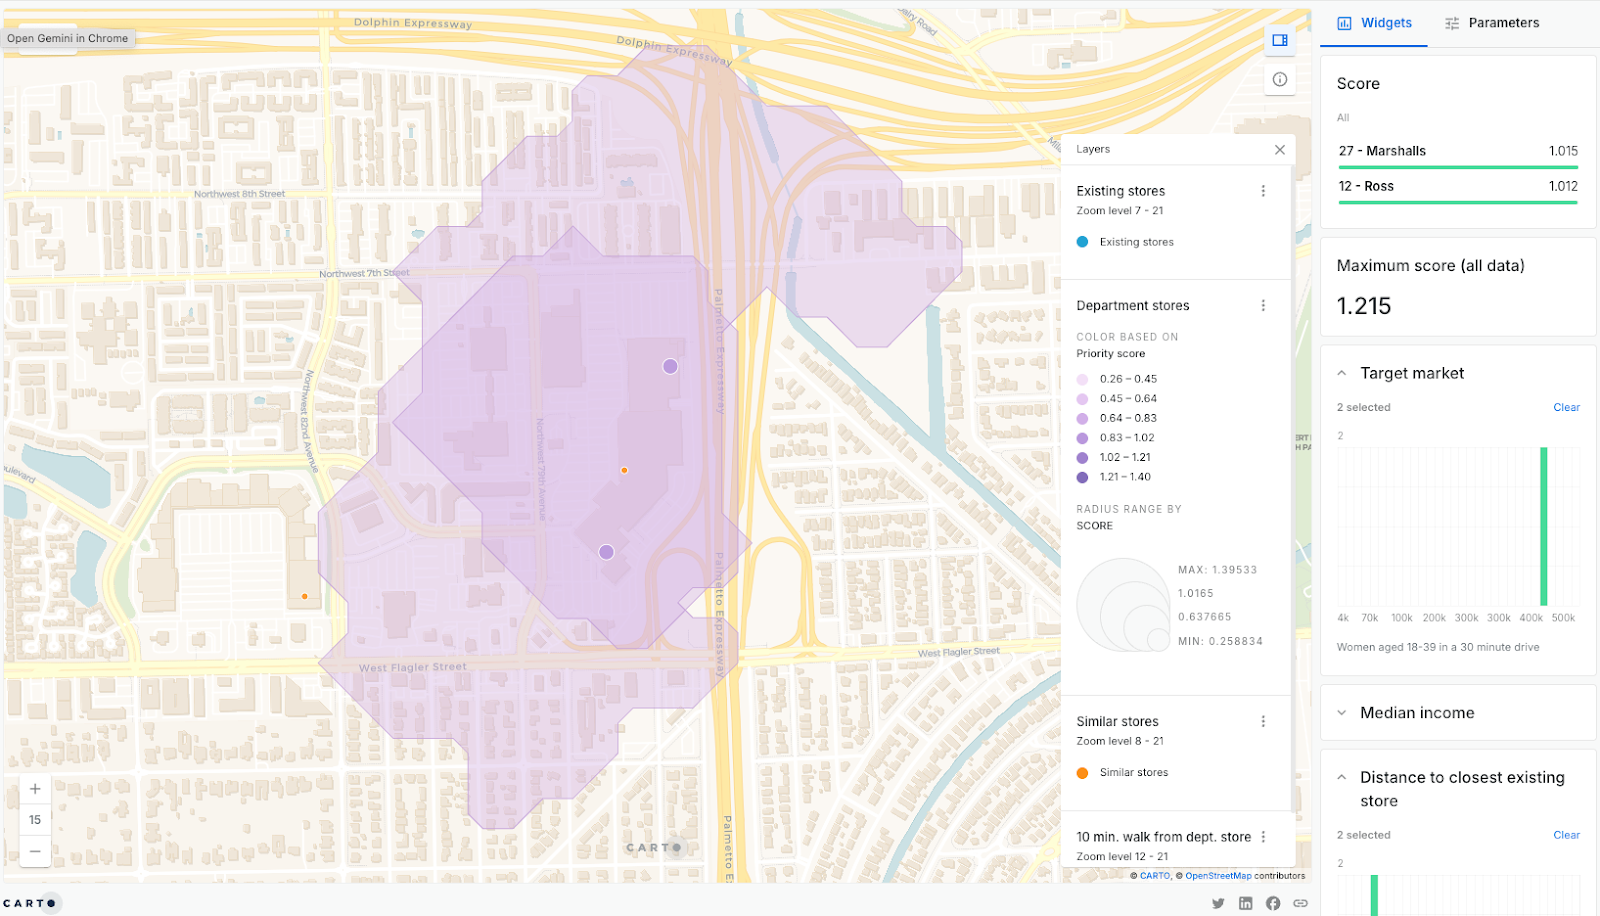
If you want to reproduce this analysis, this workflow template can be found in our Academy.
04 Territory planning
At its core, effective territory planning is about making smarter location decisions. It's about balancing sales territories, expanding networks, and improving logistics. Manually assigning territories often leads to imbalance, with some teams overloaded while others are underutilized, resulting in missed opportunities.
With CARTO's Territory Planning tools, you can automate this process. By using Territory Balancing, you can divide an area into continuous, optimized territories based on metrics like customer demand or business KPIs. This ensures each team has a manageable and strategically valuable workload.
For example, a beverage company can group restaurants into fair sales territories, ensuring reps can operate efficiently. Similarly, Location Allocation can help a telecom operator strategically place maintenance hubs to minimize costs and maximize network coverage, balancing day-to-day efficiency with emergency preparedness.
To learn more about territory planning, see this blog post and documentation!
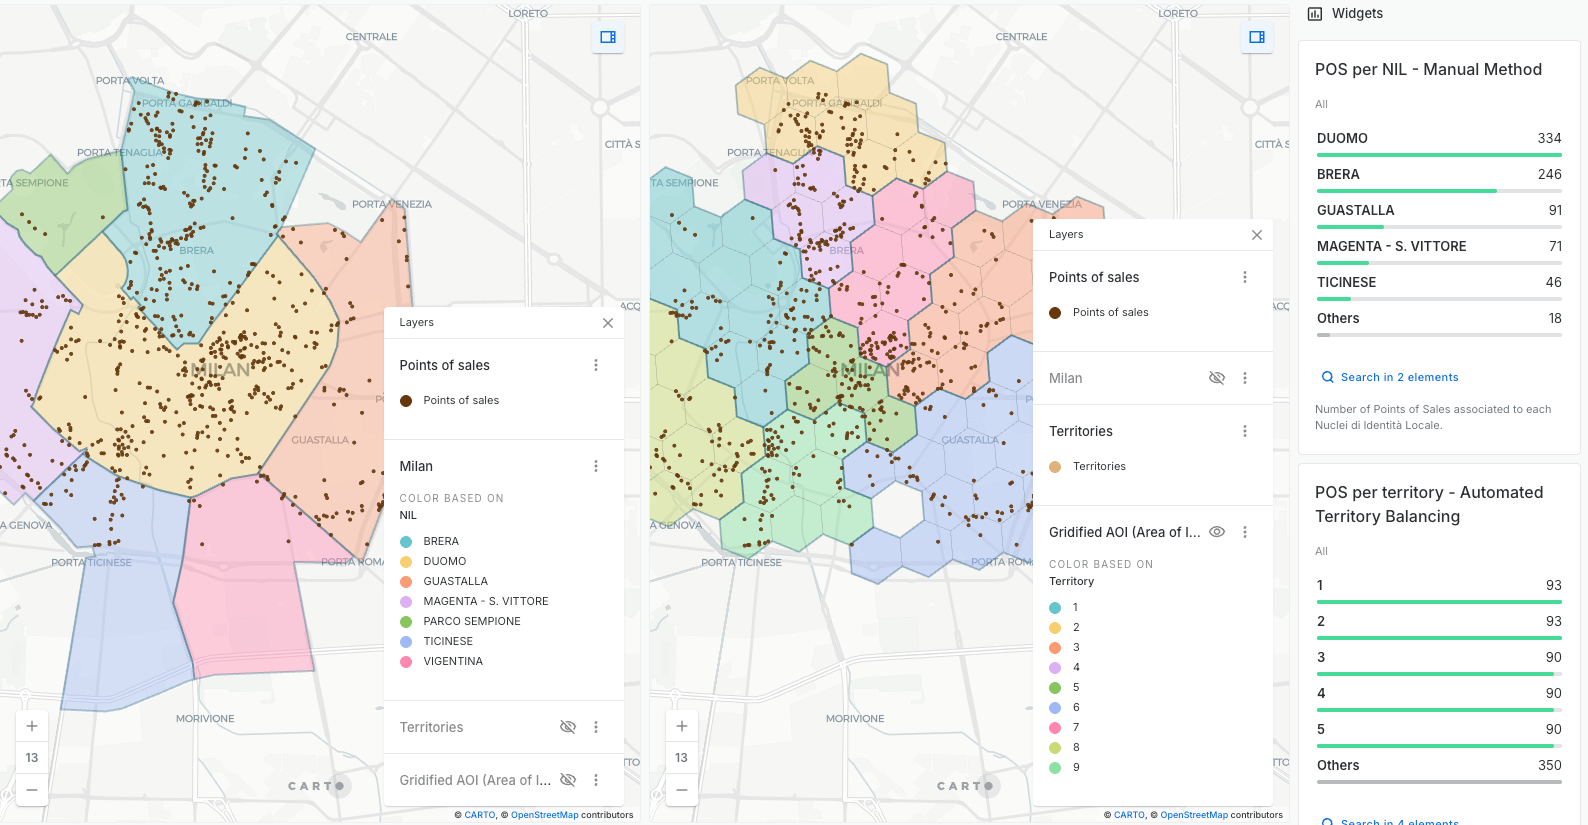
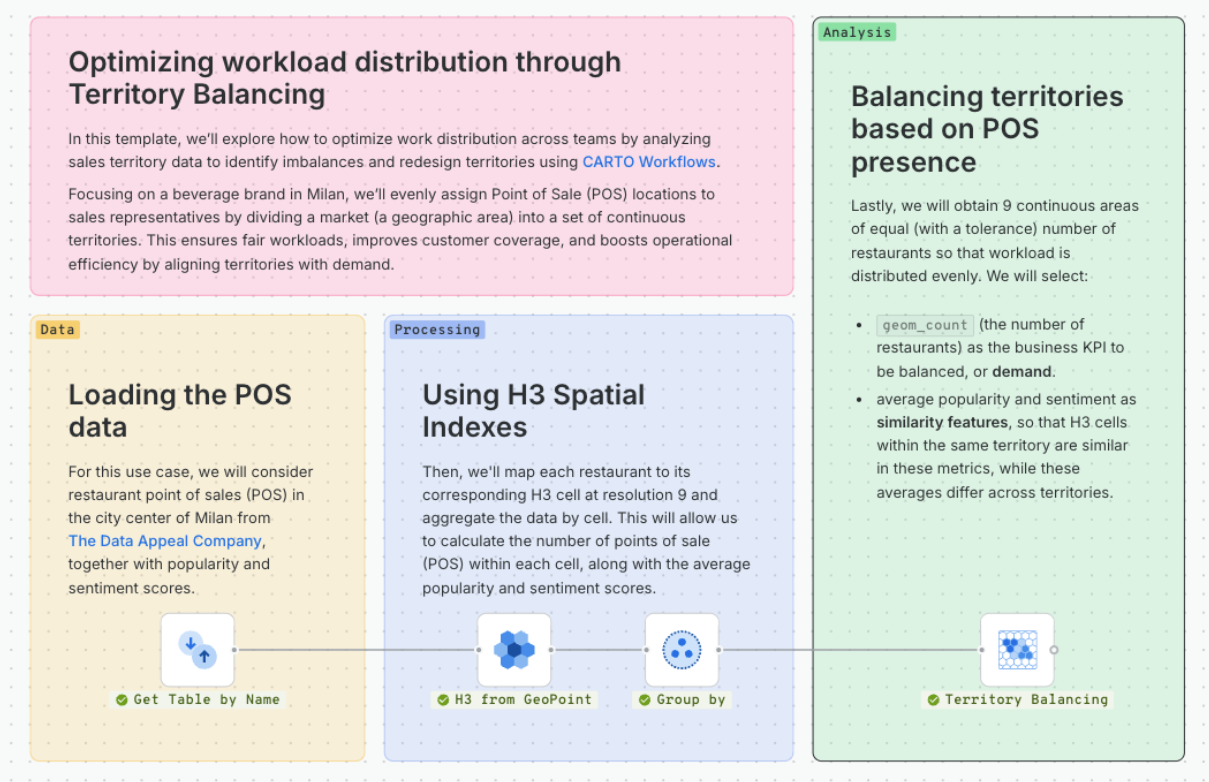
If you want to reproduce this analysis, this workflow workflow template and tutorial can be found in our Academy.
Geospatial Reasoning: The one that brings it all together
The true revolution in spatial analysis lies in making it accessible to everyone, breaking it out of data silos and embedding it into repeatable, scalable daily workflows and a user-friendly interface that drives value.
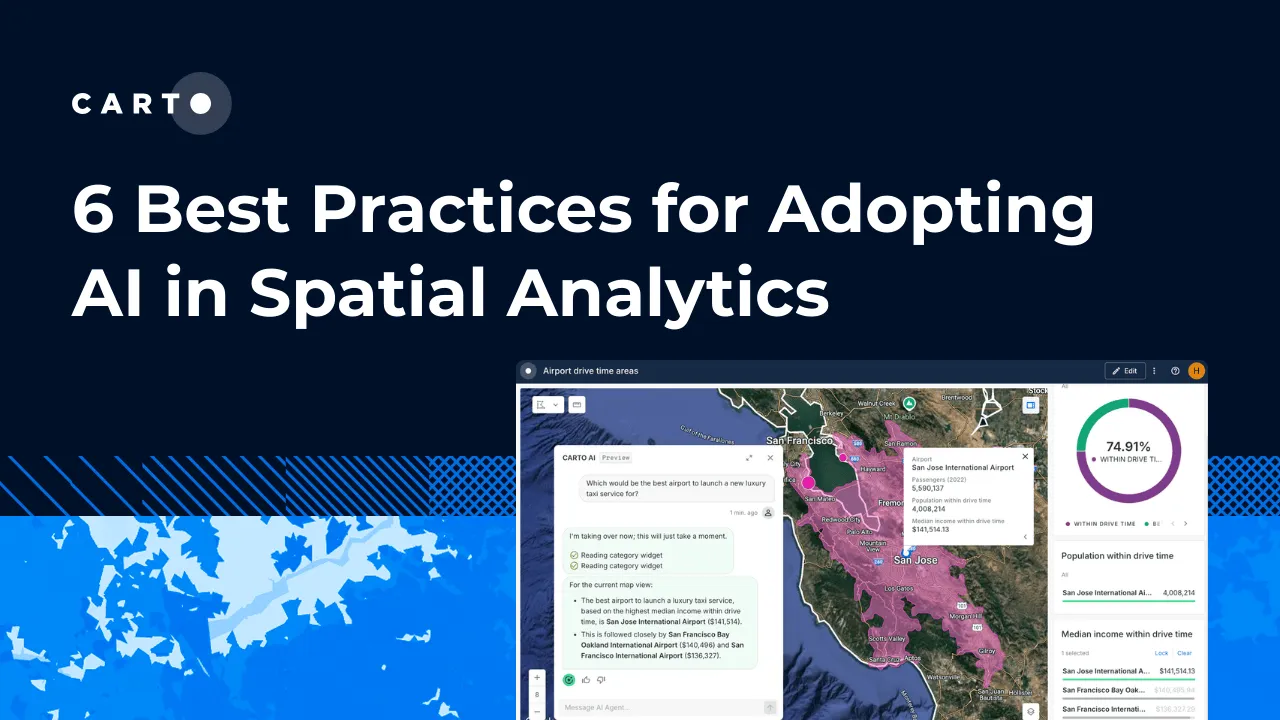
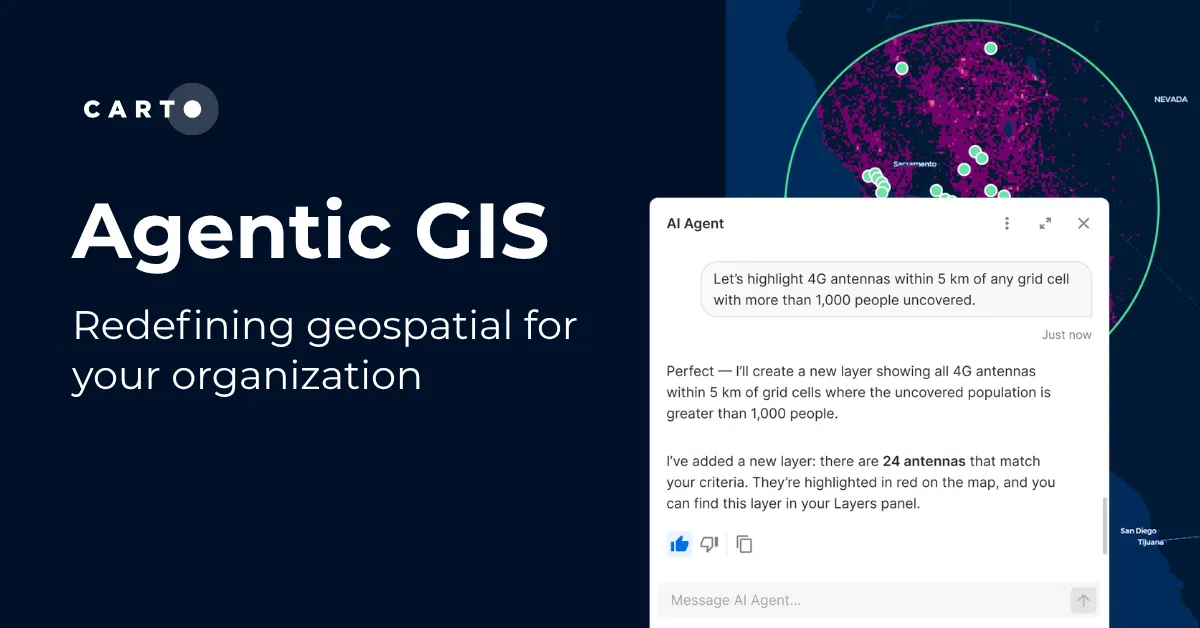
05 AI Conversationalist: the rise of Agentic GIS
Global spending and adoption of AI are predicted to skyrocket, yet in GIS, its potential has been constrained by data and expertise locked in silos.
Agentic GIS changes that. By having AI Agents as conversational agents in map dashboards, we are transforming spatial analysis from into a company-wide self-service tool.
With CARTO AI Agents, anyone in an organization can interact with spatial data through natural language. A business user can simply ask, "Which neighborhoods in Dallas will see the most growth in the next 12 months?" and get a seamless data-backed answer.
These agents are custom-built by GIS experts to reflect their deep spatial knowledge and the specific requirements of the business. By operating within a governed cloud environment, they maintain full security over their data and workflows.
This is already empowering organizations like Cotality, TELUS, and BT Group to put insights directly into the hands of decision-makers, turning site planning & growth, real-time operations dashboards, and network optimization use cases into simple, conversational experiences.
Likewise, the future of GIS is not just about making maps; it's about building geospatial AI Agents to answer questions.
CARTO now supports Model Context Protocol (MCP), allowing teams to design workflows as MCP Tools exposed through the CARTO MCP Server.
These tools are powered by CARTO Workflows which define how spatial problems are solved. The results are then passed to an AI Agent of choice for geospatial reasoning in your CARTO maps.
This multiplies the power of GIS teams by enabling scale, automation, and dissemination of insights, making spatial analysis accessible to everyone.
To learn more about Agentic GIS, see this blog post. Build your own AI Agent with this tutorial from our Academy.
Impact: Driving Value
Industry leaders are already putting these top 5 approaches into action - and now is the time to harness spatial and temporal insights and see how others are leveraging modern tools to achieve their goals.
Check out these customer stories and the cost, time, and resource savings achieved.
Conclusion: Put these insights into action
In 2025, spatial analysis became truly agentic and automated. The focus has shifted from simply seeing data to actively conversing with it — enabling teams to analyze historical risk, manage real-time operations, and plan future growth in one end-to-end platform securely in your governed cloud environment.
These trends are reshaping the industry.
See what over 250+ of your peers are saying by signing up for early access to the 4th edition of The State of Spatial Analytics Report.
Sign-up here!
Feeling inspired? Schedule a demo with one of our experts. Who knows, maybe one of your maps will be featured next year…