Space-time anomaly detection for smarter property risk assessment


Property insurance is experiencing one of its most significant transformations in decades. Severe weather events are pushing insurers to revise coverage terms and introduce new policy riders, especially in states like Florida and California. Parametric solutions, which pay out based on predefined triggers rather than actual loss assessments, are on the rise. At the same time, technological measures that reduce risk are being adopted more widely and rewarded with lower premiums.
However, crime data remains an often overlooked factor in property risk assessments, rarely integrated into underwriting guidelines or real estate portfolio management strategies. This is despite the FBI's latest estimates which reveal over $16 billion in annual losses due to property crimes alone.
How to scale your risk analysis
Today, organizations are taking a more sophisticated and data-driven approach to risk management. CARTO plays a pivotal role by offering its users the ability to undertake advanced spatial analytics that improve property risk assessments, enabling insurers and real estate managers to make more informed, proactive decisions. All of this is done natively inside your cloud data warehouse, offering unparalleled speed, scalability and security.
To illustrate how your organization can benefit from this, in this blog post we will show how to use CARTO to identify vacant buildings in areas experiencing anomalously high rates of violent crime. This analysis will be implemented with CARTO Workflows, our low-code design tool accessible to users of all technical levels, and in particular will take advantage of an analytical component called Detect Space-time Anomalies, which can be used to detect anomalous space-time regions (i.e. anomalies that affect time series from multiple locations at once).
To follow along with this example, you will need two things. First, a CARTO account; you can sign up for a free 14-day trial here if you don’t have one already. Secondly, you’ll need access to your own project on Google BigQuery project. If you don’t have this, you can use the CARTO Data Warehouse connection which is provided for all users.
Getting the data
Let’s begin by reviewing the data we’ll be using in this example. We’ll be working with weekly counts of violent crimes which have occurred in Chicago from 2001 to the present (i.e. as of 2024-09-30, when this analysis was created). You can explore this in the CARTO Builder map below, or open in full screen here. This data was originally extracted from the Chicago Police Department's CLEAR (Citizen Law Enforcement Analysis and Reporting) system and is available in Google BigQuery public marketplace.

Try adjusting the SQL parameter in this map - a feature which allows end users to dynamically alter the SQL query which is driving the map. You can use this to visualize both the observed counts and the estimated counts for the top 10 H3 cells with the highest number of counts. The estimated counts were obtained by fitting a statistical model on the historical time series data and will be used in the next section as baselines to detect anomalous regions, i.e. we will assume that the observed values should be equal to the baseline values under the hypothesis of no anomalies.
We’ll also include in this analysis the 311 calls for open and vacant buildings reported to the City of Chicago. This reports all the buildings that have been reported being vacant or occupied, occupied by non-residents, dangerous, etc.
Getting started with space-time anomaly detection
To detect anomalies that affect multiple time series simultaneously, we can either combine the outputs of multiple univariate time series, or treat the multiple time series as a single multivariate quantity to be monitored. However, for time series that are also localized in space, we expect that if a given location is affected by an anomalous event, then nearby locations are more likely to be affected than locations that are spatially distant.
A typical approach to the monitoring of spatial time series data uses fixed partitions, which requires defining an a priori spatial neighbourhood and temporal window to search for anomalous data. However, in general, we do not have a priori knowledge of how many locations will be affected by an event, and we wish to maintain high detection power whether the event affects a single location (and time), all locations (and times), or anything in between.
One way to address this problem is with a multi-resolution approach, where we search through a wide range of overlapping space-time regions, each containing a subset of the data, to identify the most significant clusters of unusual activity compared to a baseline. This baseline can be defined either relatively (as the population at risk) or absolutely (as the expected value inferred from modelling the historical data).
Step 1: Find the emerging most anomalous regions
So, how can we get started to detect emerging anomalies? First, we need to make sure that our data is structured correctly to run this analysis, for which we require:
- A Spatial Index ID variable: the technique we’ll be using requires to create - at scale - all possible overlapping spatial regions.. Therefore, it’s ideal to have our data in a Spatial Index format - a super lightweight, hierarchical spatial grid designed for analysis at scale. You can learn more about Spatial Indexes in this FREE ebook. Here we will use the h3 variable, which indicates the H3 string of the cell to which the crime counts refer to.
- A timestamp variable: a variable that can be cast to type DATETIME. This variable will be used to create all possible overlapping temporal windows backward. Here we will use the week of the year variable, which indicates the week of the year to which the crime counts refer to.
- A variable to be used to identify the anomalous regions: here we will use the counts variable that refers to the observed number of crimes per cell and week. This could be replaced by any numeric variable which you want to calculate anomalies for.
- A baseline to be used to identify the anomalous regions: here we will use the counts_baseline variable that refers to the expected number of crimes per cell and week and was derived by modelling the historical data. This could be replaced by any other baseline value (e.g. the population at risk).
For more information, check out the full documentation for this component here. Here is the final workflow that we will run for this analysis:
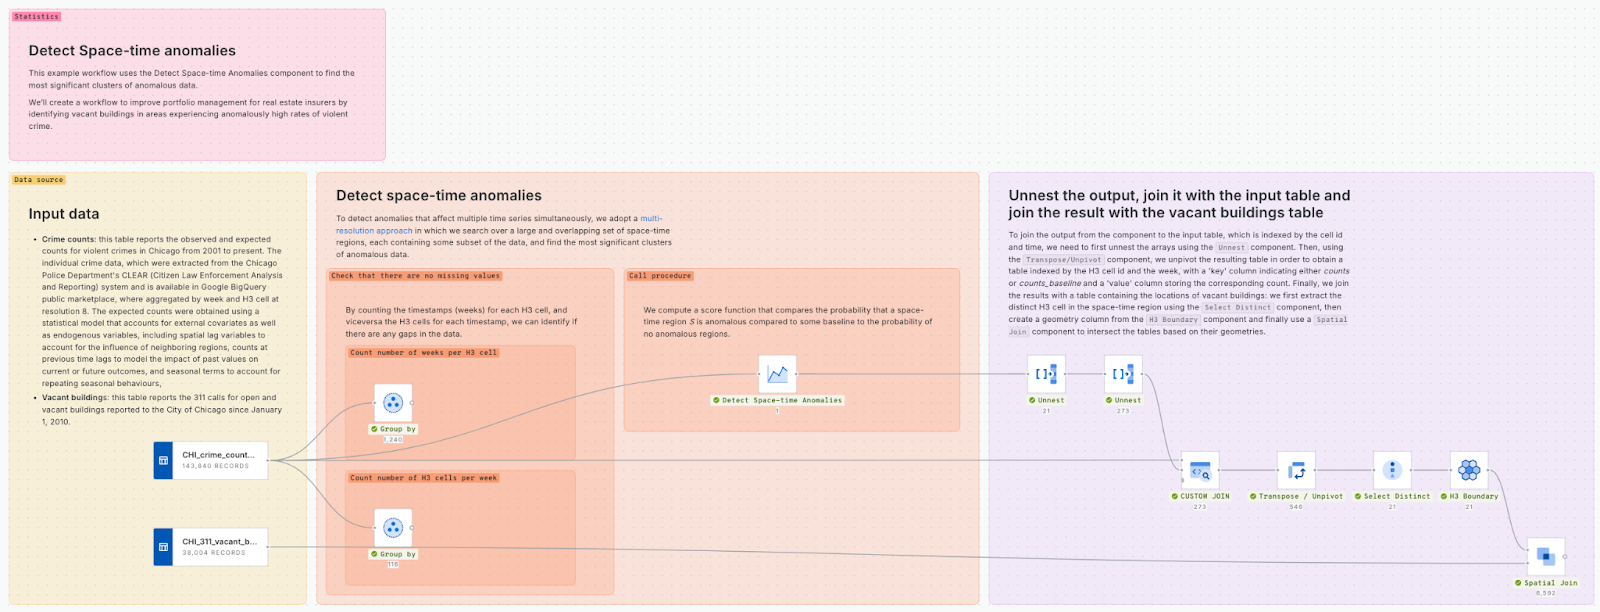
This workflow takes as input a table reporting the observed and expected number of crimes per H3 cell in the Chicago area per week and a table with a listing of vacant properties from 311 calls. The workflow takes the counts data, uses the Detect Space-time Anomalies to identify the most anomalous region and processes the output to visualize the H3 cells and weeks within this region, along with the observed and expected weekly counts, and the geometries of the vacant properties.
To reproduce the workflow follow the steps highlighted in this step-by-step tutorial in our CARTO Academy.
Step 2: Find the emerging most anomalous regions
The output of the analysis consists of two tables. The first table is the output of the CUSTOM JOIN component, and lists for each H3 cell and week belonging to the anomalous region the observed and expected counts. The second table is the result of the Spatial Join component, and includes all the polygons and the IDs of all vacant buildings that have been identified within the detected anomalous H3 cells.
Using this output, we can generate a map like the following:

Using a low-code approach we were able to detect vacant buildings in areas experiencing a surge in crime (anomalous regions). This can be highly beneficial for a real estate insurance company as vacant properties are more vulnerable to vandalism, theft, and arson, which can lead to costly claims. This insight enables better risk management and helps insurers mitigate potential losses, ultimately improving the accuracy of underwriting decisions and enhancing profitability.
If you want to reproduce this analysis, a template with this example workflow can be found in our Academy.
Space-time anomaly detection for data-driven decision making
Space-time anomaly detection is a game-changer for businesses seeking to extract actionable insights from their data. By jointly taking into account both spatial and temporal dimensions, it enables the identification of hidden patterns, trends, and outliers that might be missed when analyzing these dimensions separately, ultimately supporting more informed decision-making and proactive responses.
Sign up for a free 14-day trial with CARTO today and start your Location Intelligence journey today!