From selection to consolidation: 6 ways to optimize site planning


If your organization deals with physical locations, every location decision - whether it’s opening, closing or consolidating - can result in millions of dollars of revenue at risk - or gained.
Despite this,many organizations still make these decisions on fragmented datasets, legacy processes, or instinct alone. The result? Missed market potential, inefficient resource allocation, and costly missteps that could’ve been avoided.
Whether you’re working in retail, telecoms, renewable energy, OOH advertising - or any industry where physical presence matters - this guide is for you. Below, we explore 6 ways to supercharge your site planning strategy using spatial analytics, automation, and real-time insights to make smarter, faster decisions across the full site lifecycle - from selection and optimization to consolidation and closure.
6 ways to optimize your site planning decisions
1. Eliminate the analytics skills barrier
Site planning often involves a tug-of-war between those who understand the business context and those who understand the data. When the process depends on analysts to run spatial queries or build dashboards, decisions get delayed - and agility is lost. This becomes a serious liability when planning needs to be iterative, exploratory, and responsive to shifting conditions. With 67% of business leaders citing data skill shortages as a major barrier to digital transformation (Nash Squared, 2023), the challenge isn’t just technical - it’s organizational.
So what’s the solution? Organizations need to reduce the back-and-forth between teams and make spatial analysis more accessible to decision-makers with more flexible and intuitive self-service solutions.
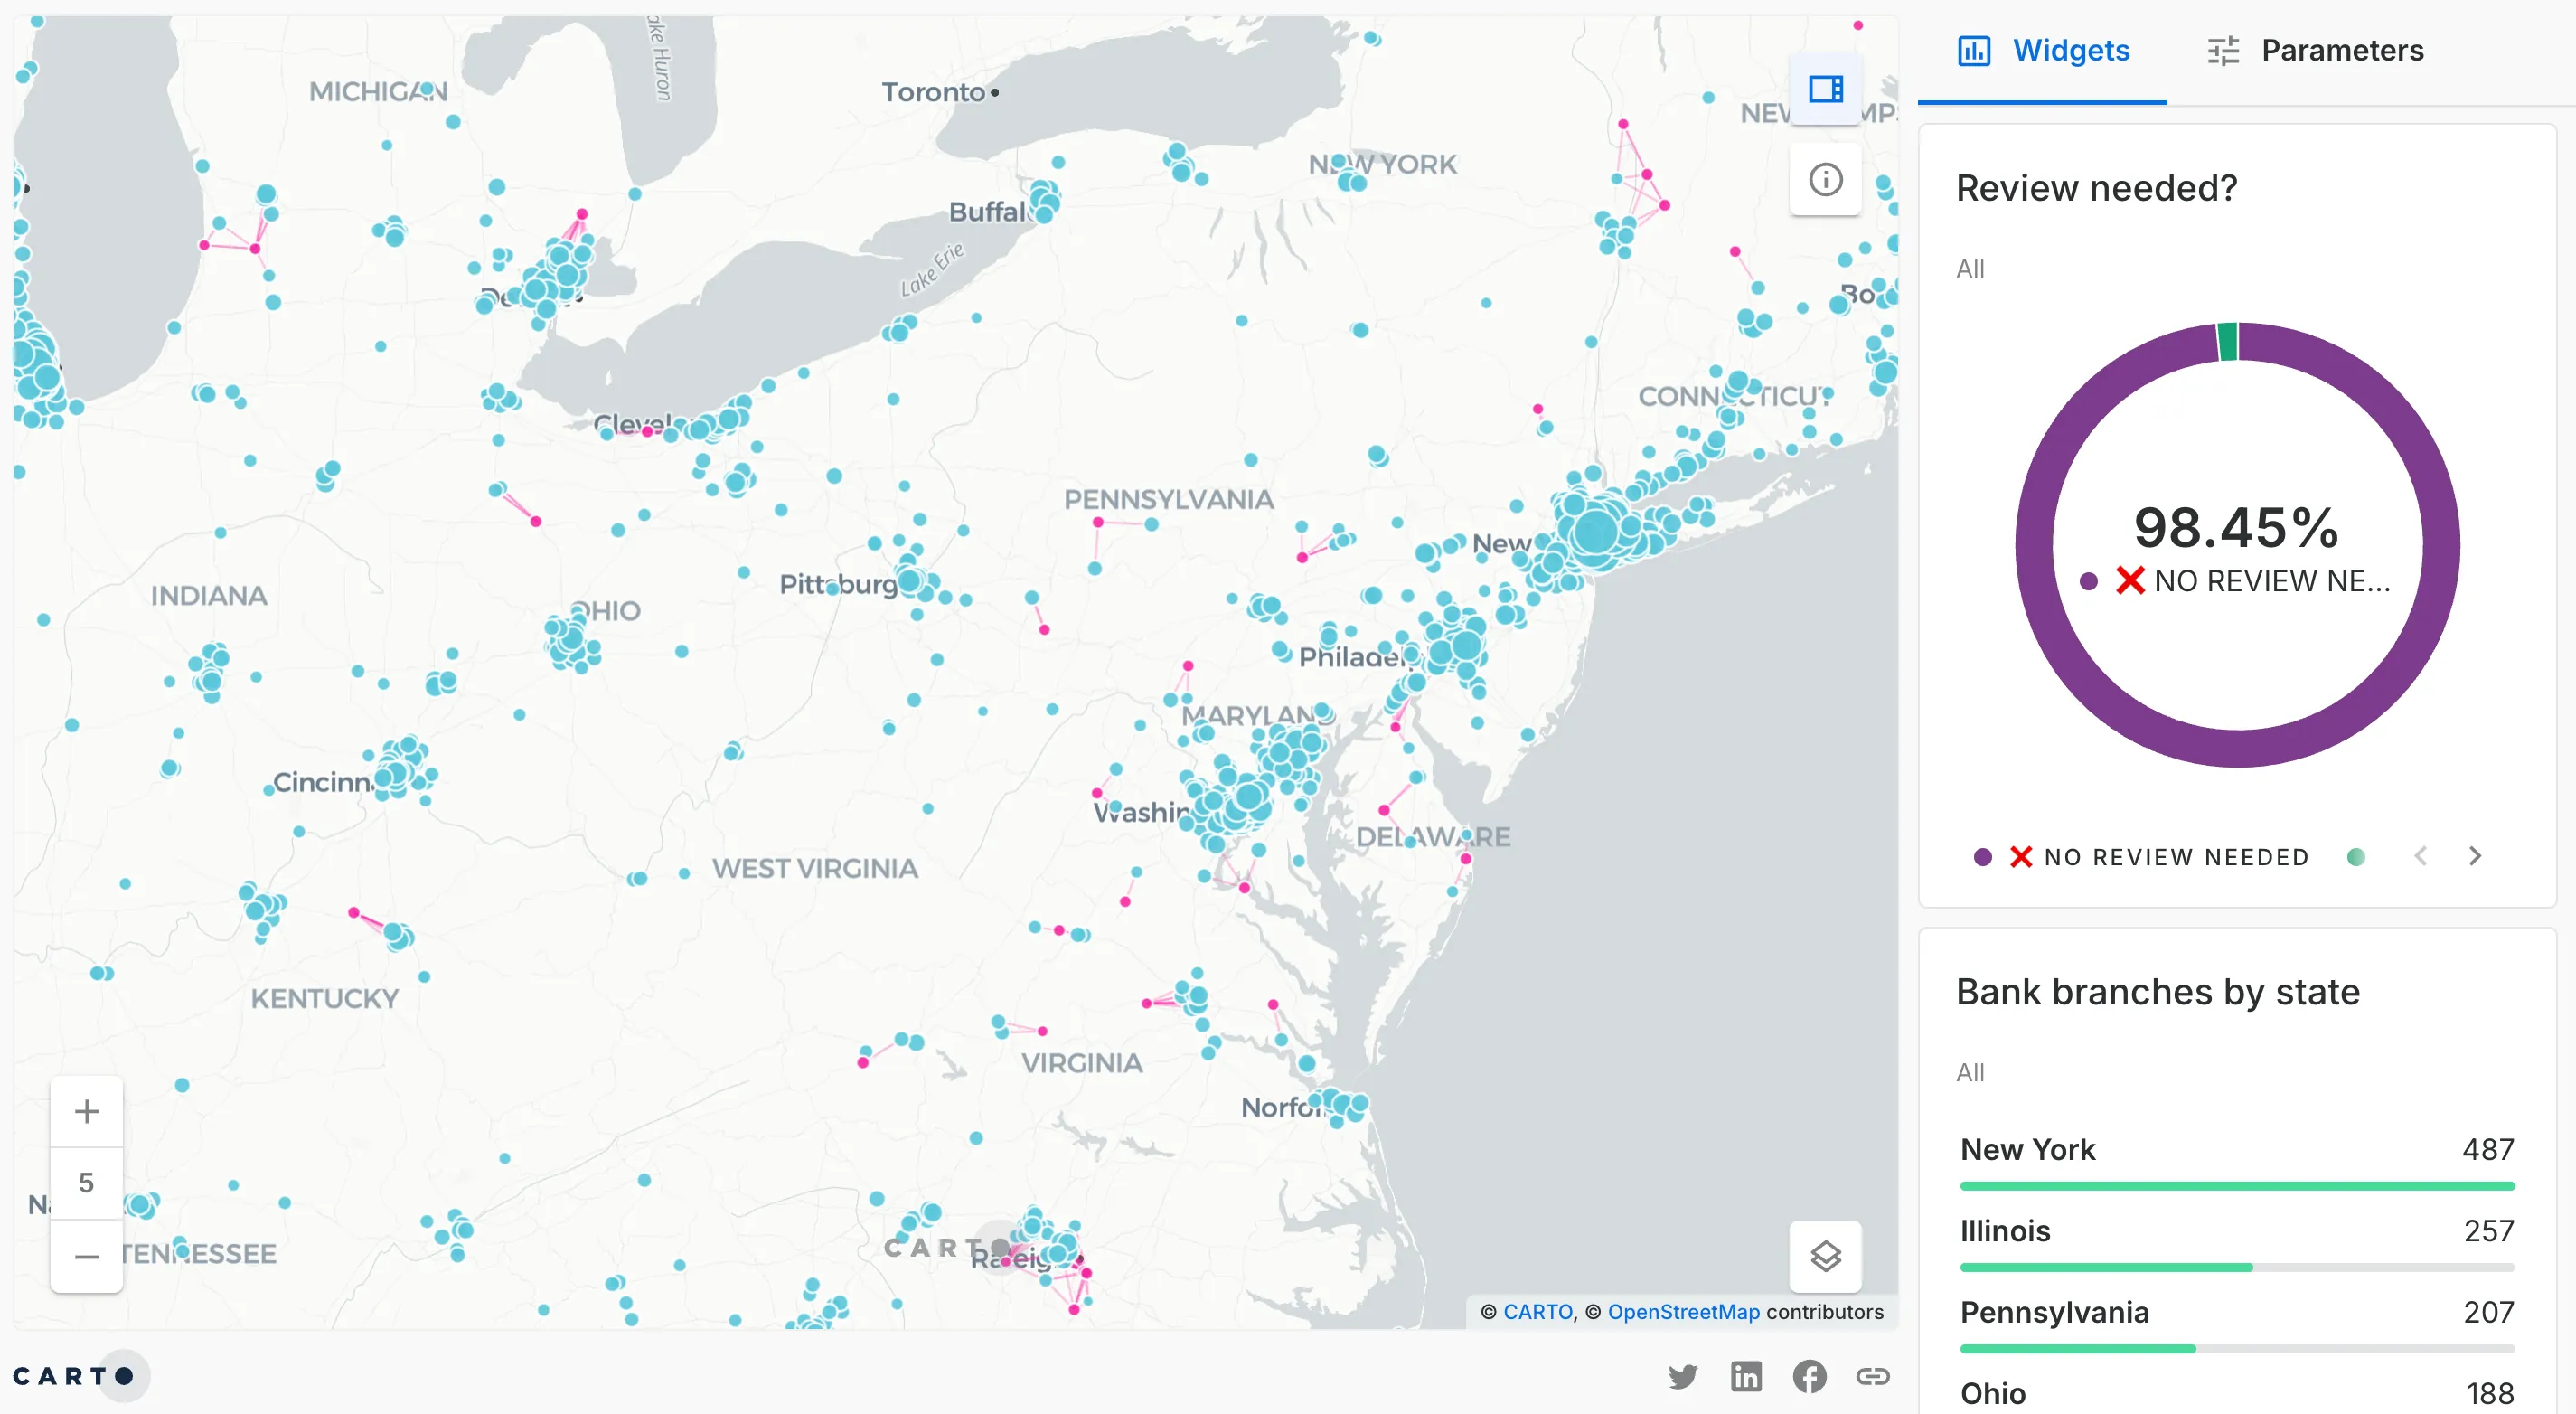
This is what that looks like in action; the dashboard above (open in full-screen here) has been set up to help a bank identify branches - in pink - which may be suitable for closure based on a low population, younger median age and close proximity to other branches. Rather than the analyst defining thresholds for these variables, the Parameters tab allows the end-user to adapt these themselves, exploring different scenarios based on their own strategic priorities. This significantly speeds up the planning cycle and increases adoption of analytical tools.
Learn more 👉 Mapping Financial Services: 5 Ways to Use Spatial Analytics
2. Embrace AI-driven decision-making
Speaking of making spatial analysis more accessible… we have to talk about AI.
AI is completely revolutionizing the way that spatial analysis is being used by organizations, and one of the most seismic ways this is happening is with AI Agents. Agents allow anyone to explore spatial data by simply asking questions in natural language. No more bottlenecks, guesswork, or static dashboards; just real-time, accessible insights that bring decision-makers closer to the data.
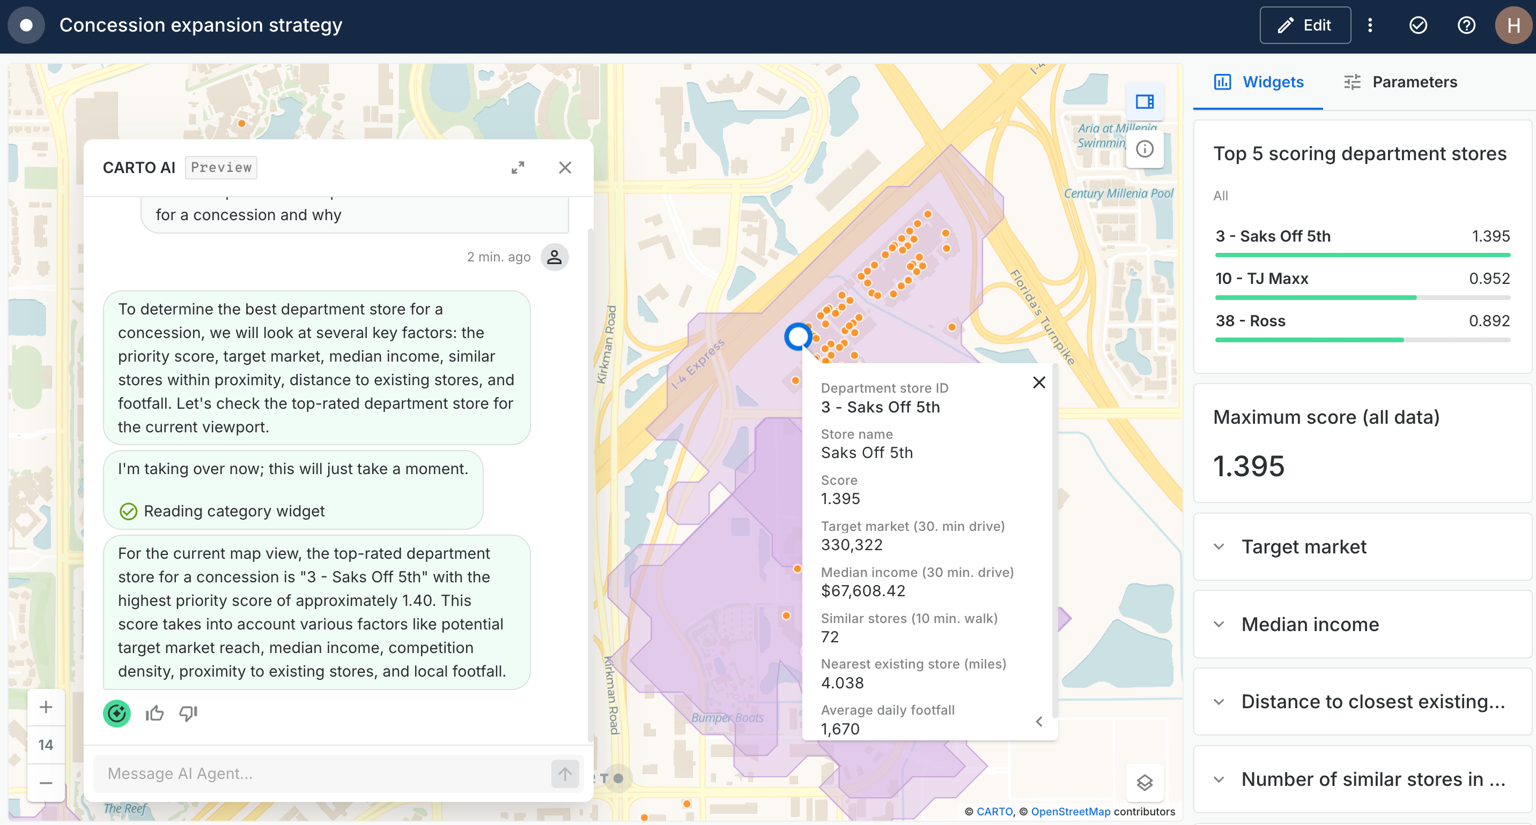
Take the demo above: a womenswear brand is using a CARTO Builder dashboard to decide which department store concessions would be optimal expansion sites. With AI Agents, they can simply ask questions about the analysis to help them come to a decision. They can ask how scores were calculated, explore different scenarios, or clarify the impact of each factor - all without requiring the input of a data expert.
This not only speeds up decision-making but builds trust in the results. By making spatial analysis more transparent and intuitive, AI Agents empower broader teams to make smarter, faster location decisions.
Learn more 👉 CARTO AI Agents: now in public preview!
3. Scale your decision-making
Site planning at scale often comes with trade-offs: the more ground you cover, the harder it becomes to maintain precision and therefore confidence in your findings. But for organizations making high-stakes decisions across thousands - or even millions - of locations, compromising between scale and detail isn’t an option. It’s crucial to be able to handle both volume and complexity in a way that is both fast and flexible.
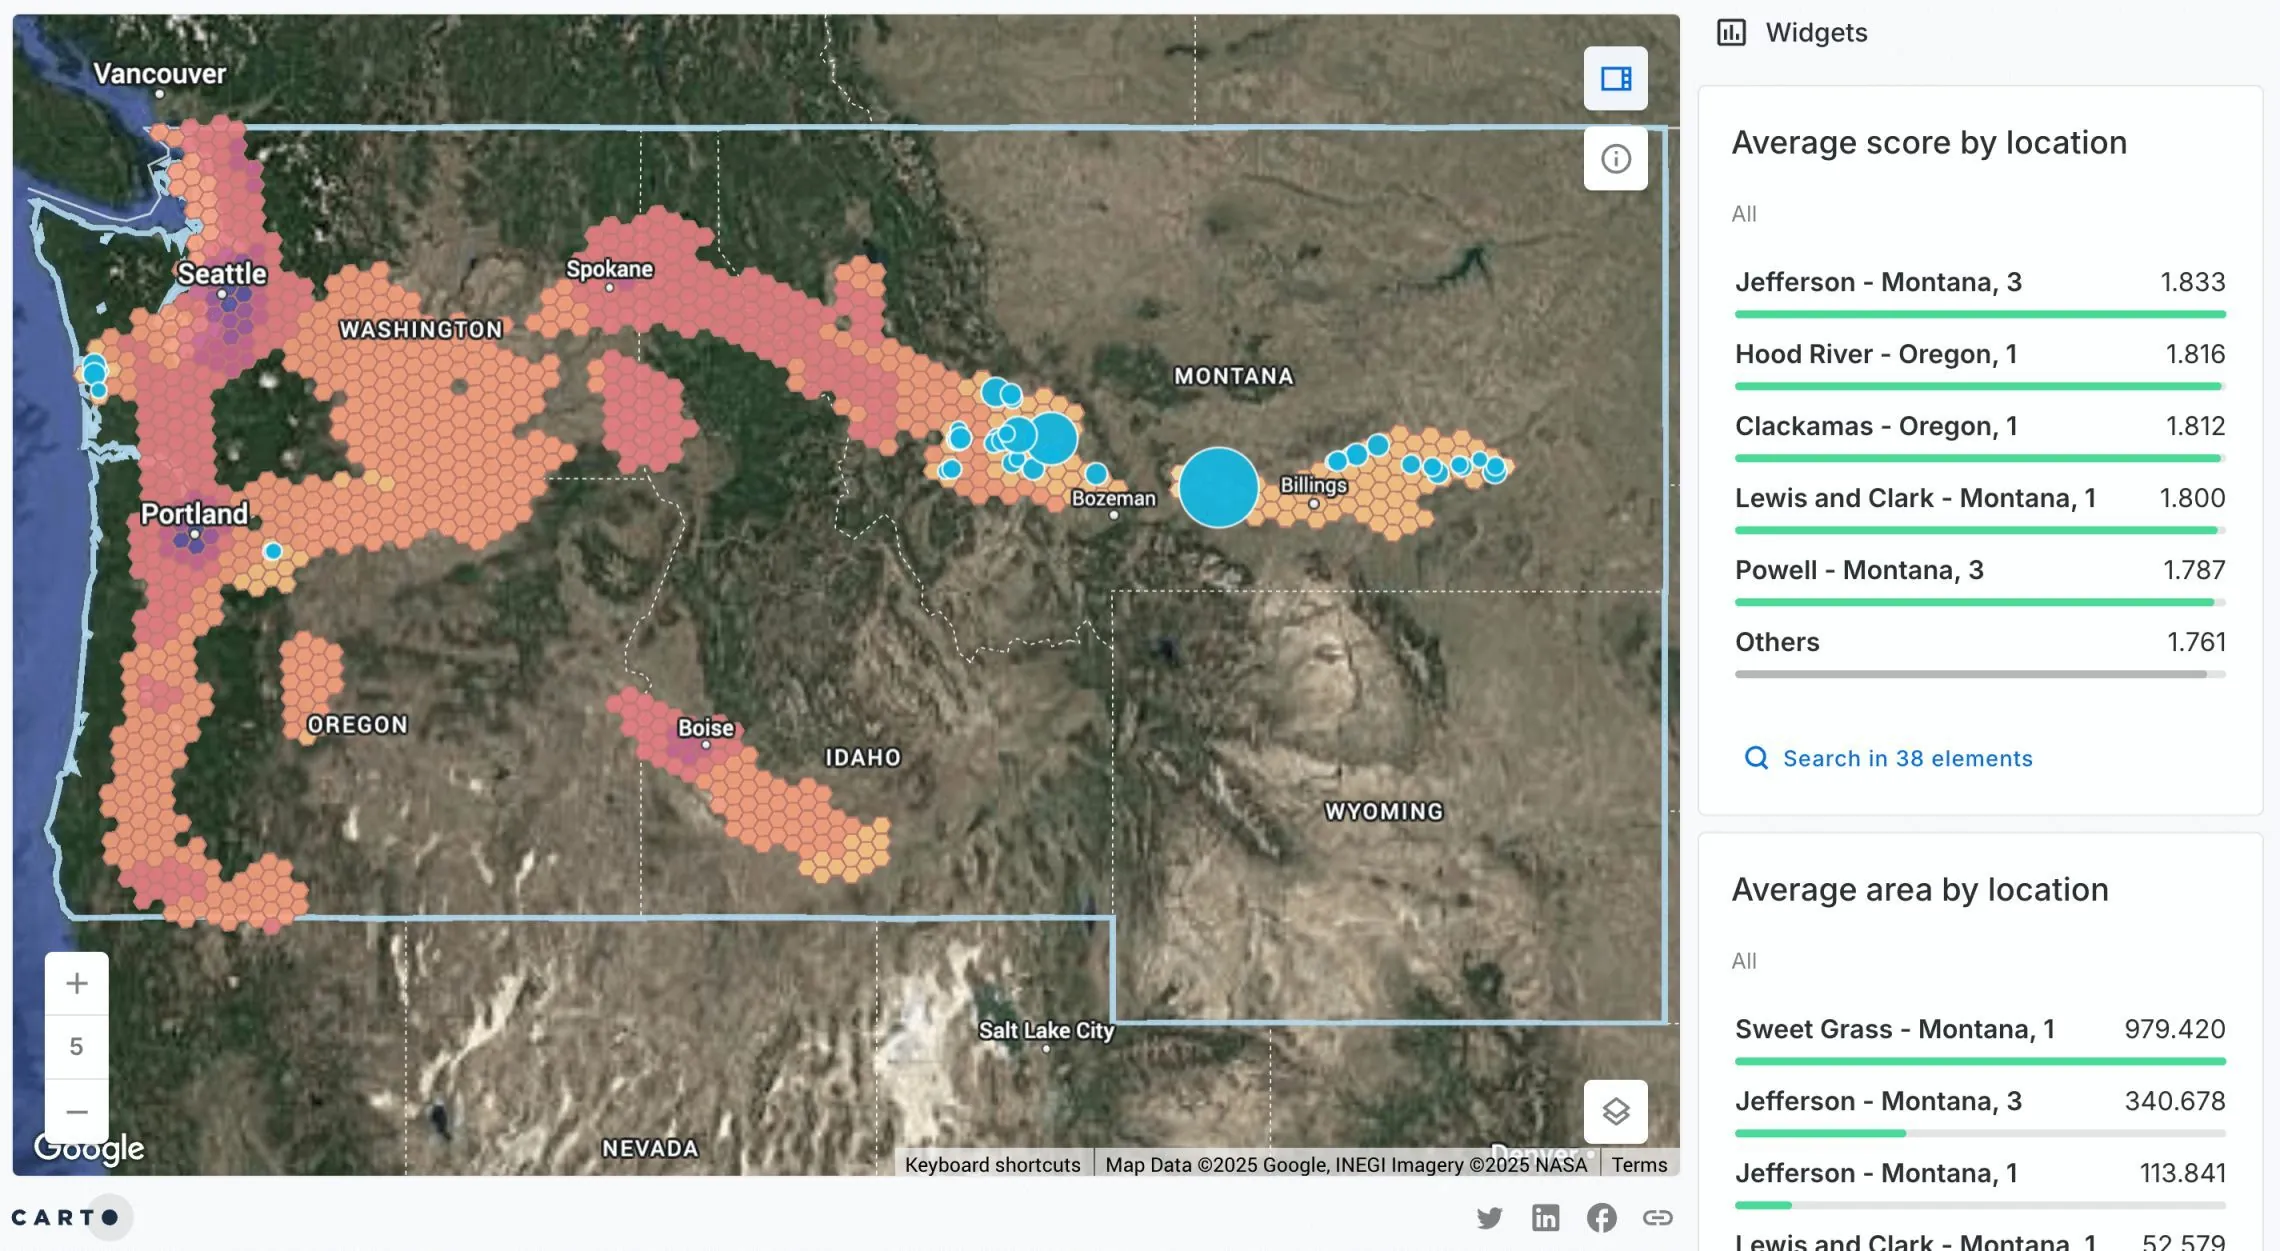
That’s exactly what the wind turbine feasibility demo showcases (open in full-screen here), which is aiming to uncover the optimal wind turbine locations in the northwestern USA. This analysis is absolutely enormous in scale, both because it considers everything from proximity to power lines and road access, to environmental restrictions and population density, but also because of the sheer volume of data being assessed.
The foundation of this analysis is a H3 Spatial Index grid consisting of over 1.7 million individual cells, all of which are roughly just 0.7km2 in area. That means this analysis is covering an absolutely enormous area, but with enough detail to allow organizations to confidently make precise location planning decisions.
Learn more 👉 Spatial Indexes 101
4. Think in real time
Real-time data is no longer a nice-to-have in site planning - it’s a necessity.
In industries where physical networks are constantly affected by external conditions, relying on static reports or periodic reviews can mean missing critical signals. Whether it’s falling foot traffic, shifting demand, or incoming storms, the ability to detect and respond to issues as they happen is what turns reactive strategies into resilient, proactive ones.
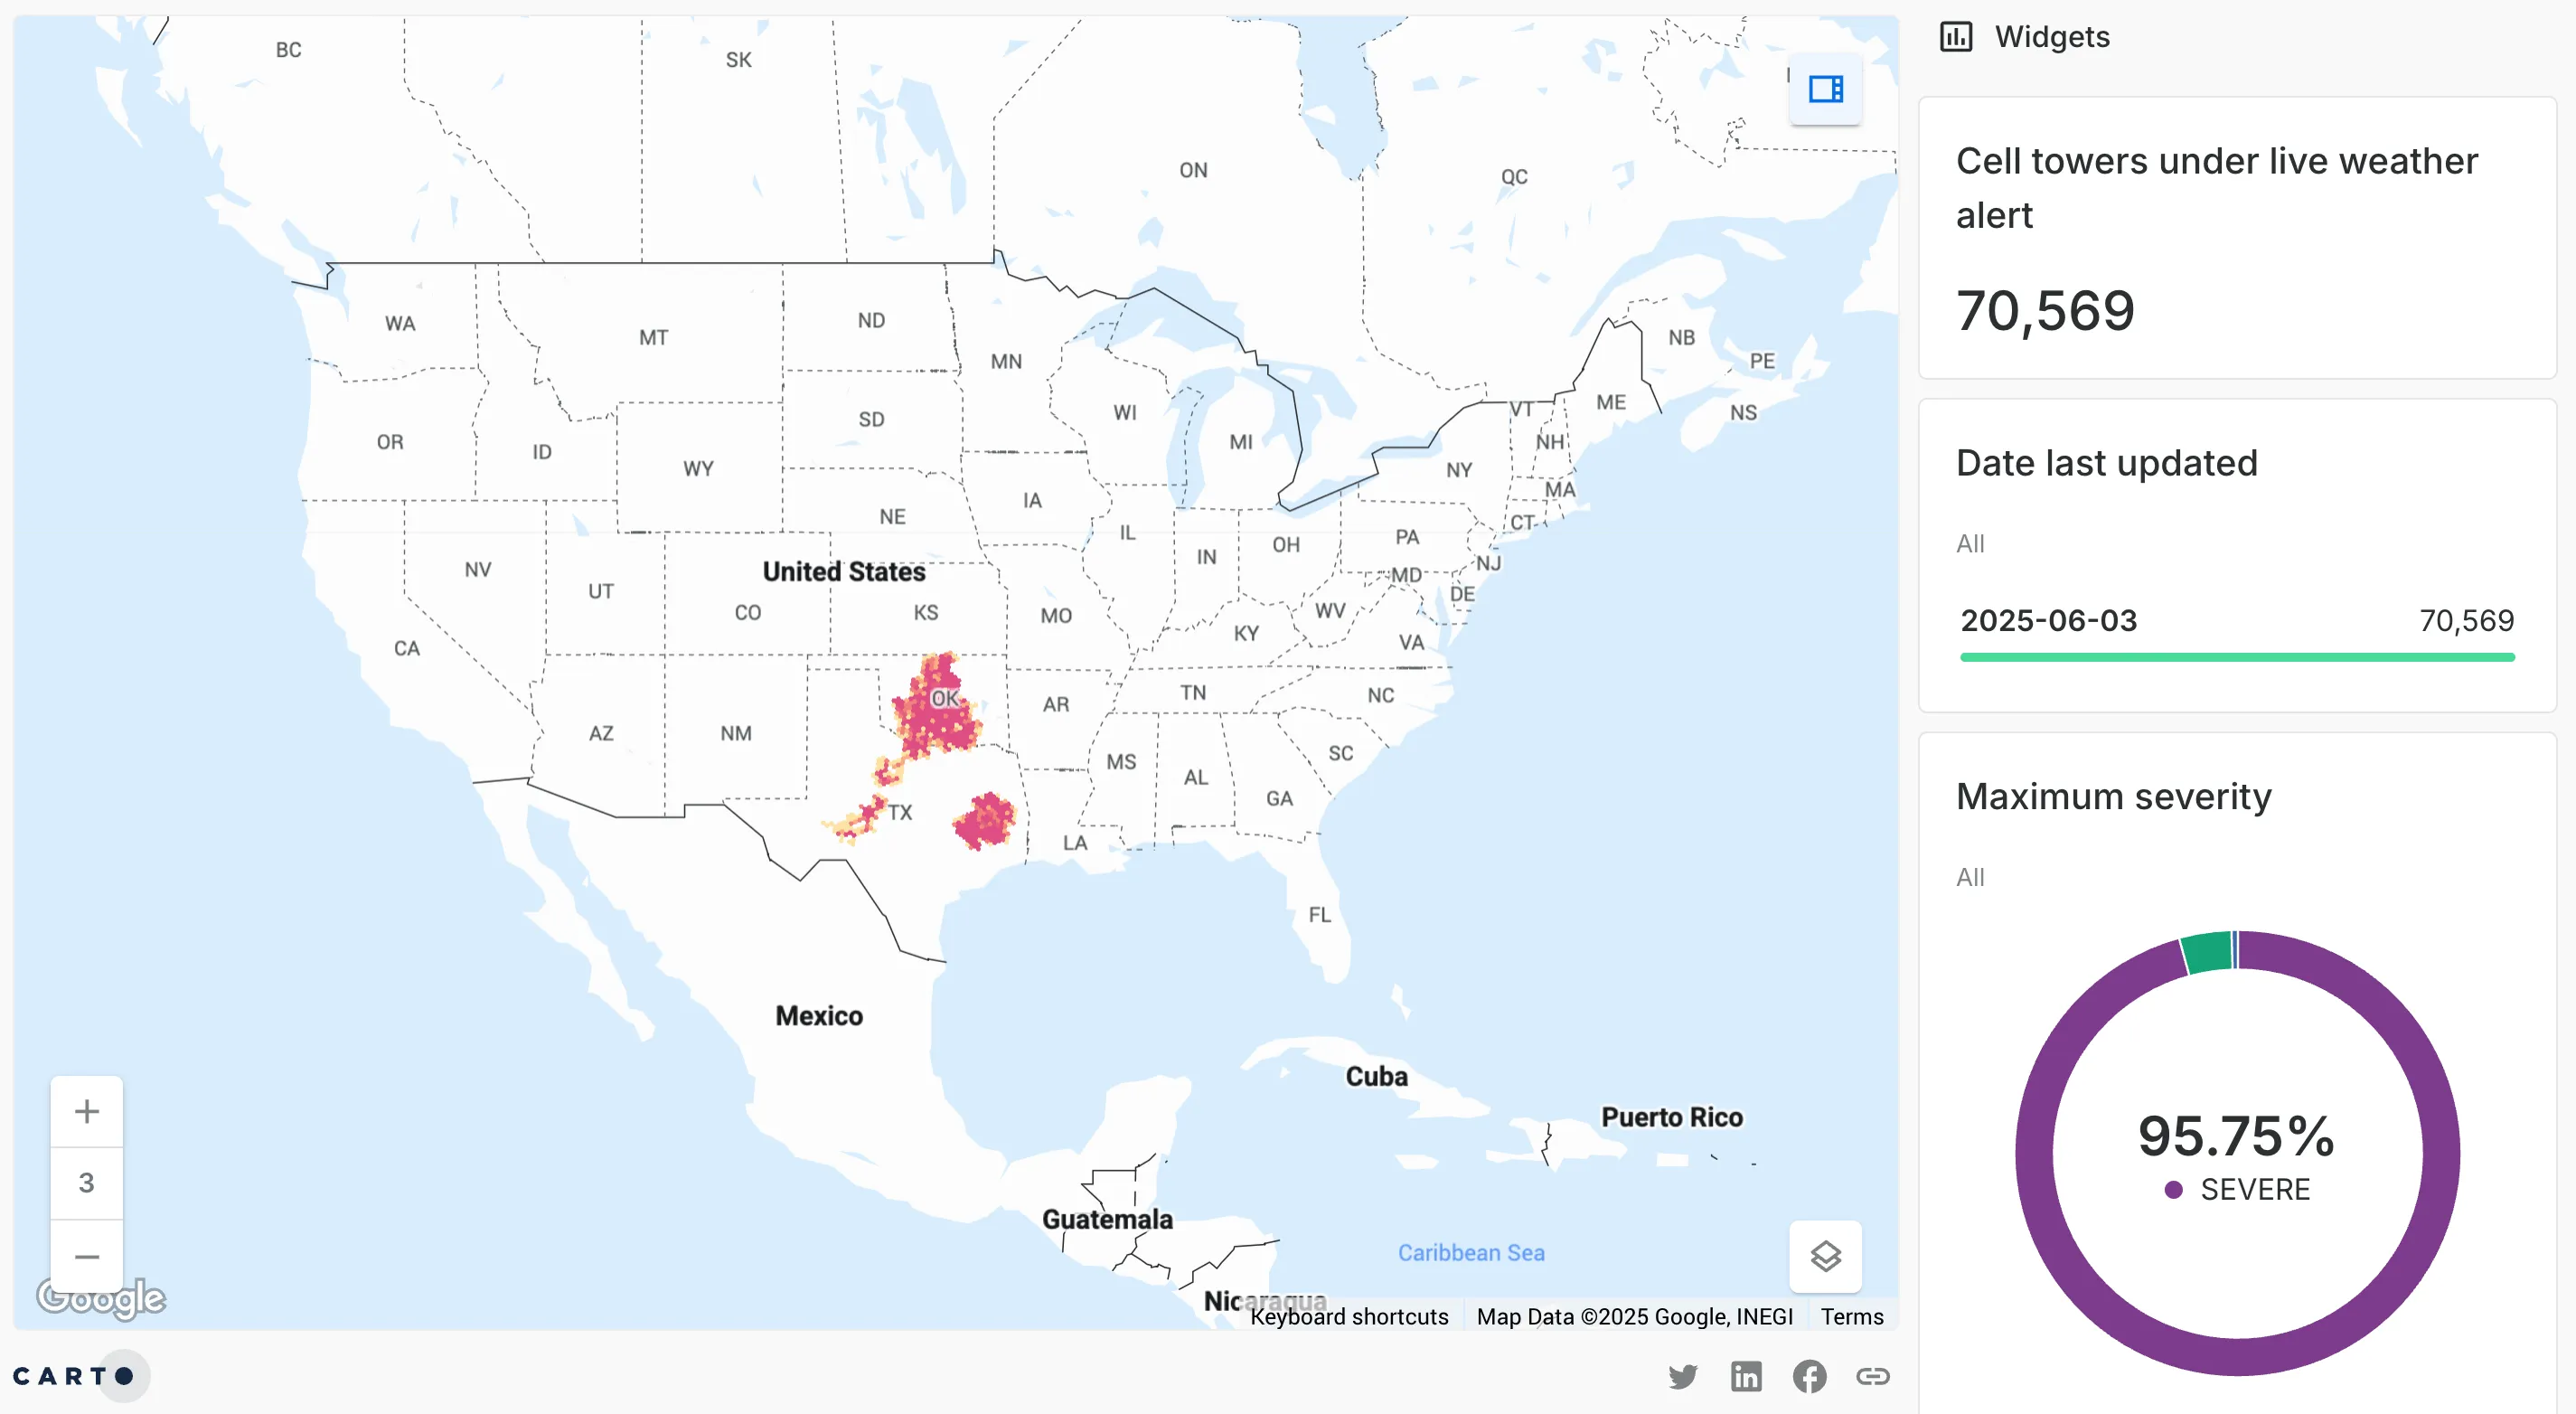
In the dashboard above (open in full-screen here), users can explore cell towers which are at risk from real-time weather alerts across the whole of the USA. You can explore this map further by switching between grid and point view, and interacting with the Widgets to pinpoint towers based on risk severity and type. This gives operations and network planning teams a powerful way to monitor risk in real time, prioritize response efforts, and safeguard continuity across the network.
Learn more 👉 It’s time to go real-time: live spatial analytics with CARTO
5. Optimize network performance, not just individual sites
Smart location strategy isn’t just about picking where to open next - it’s about continuously optimizing the performance of your entire network. That might mean identifying underperforming sites for closure, monitoring overlap and cannibalization risks, or reallocating resources to maximize overall impact. Instead of looking at each site in isolation, organizations need tools that consider how every location fits into - and impacts - the whole ecosystem.
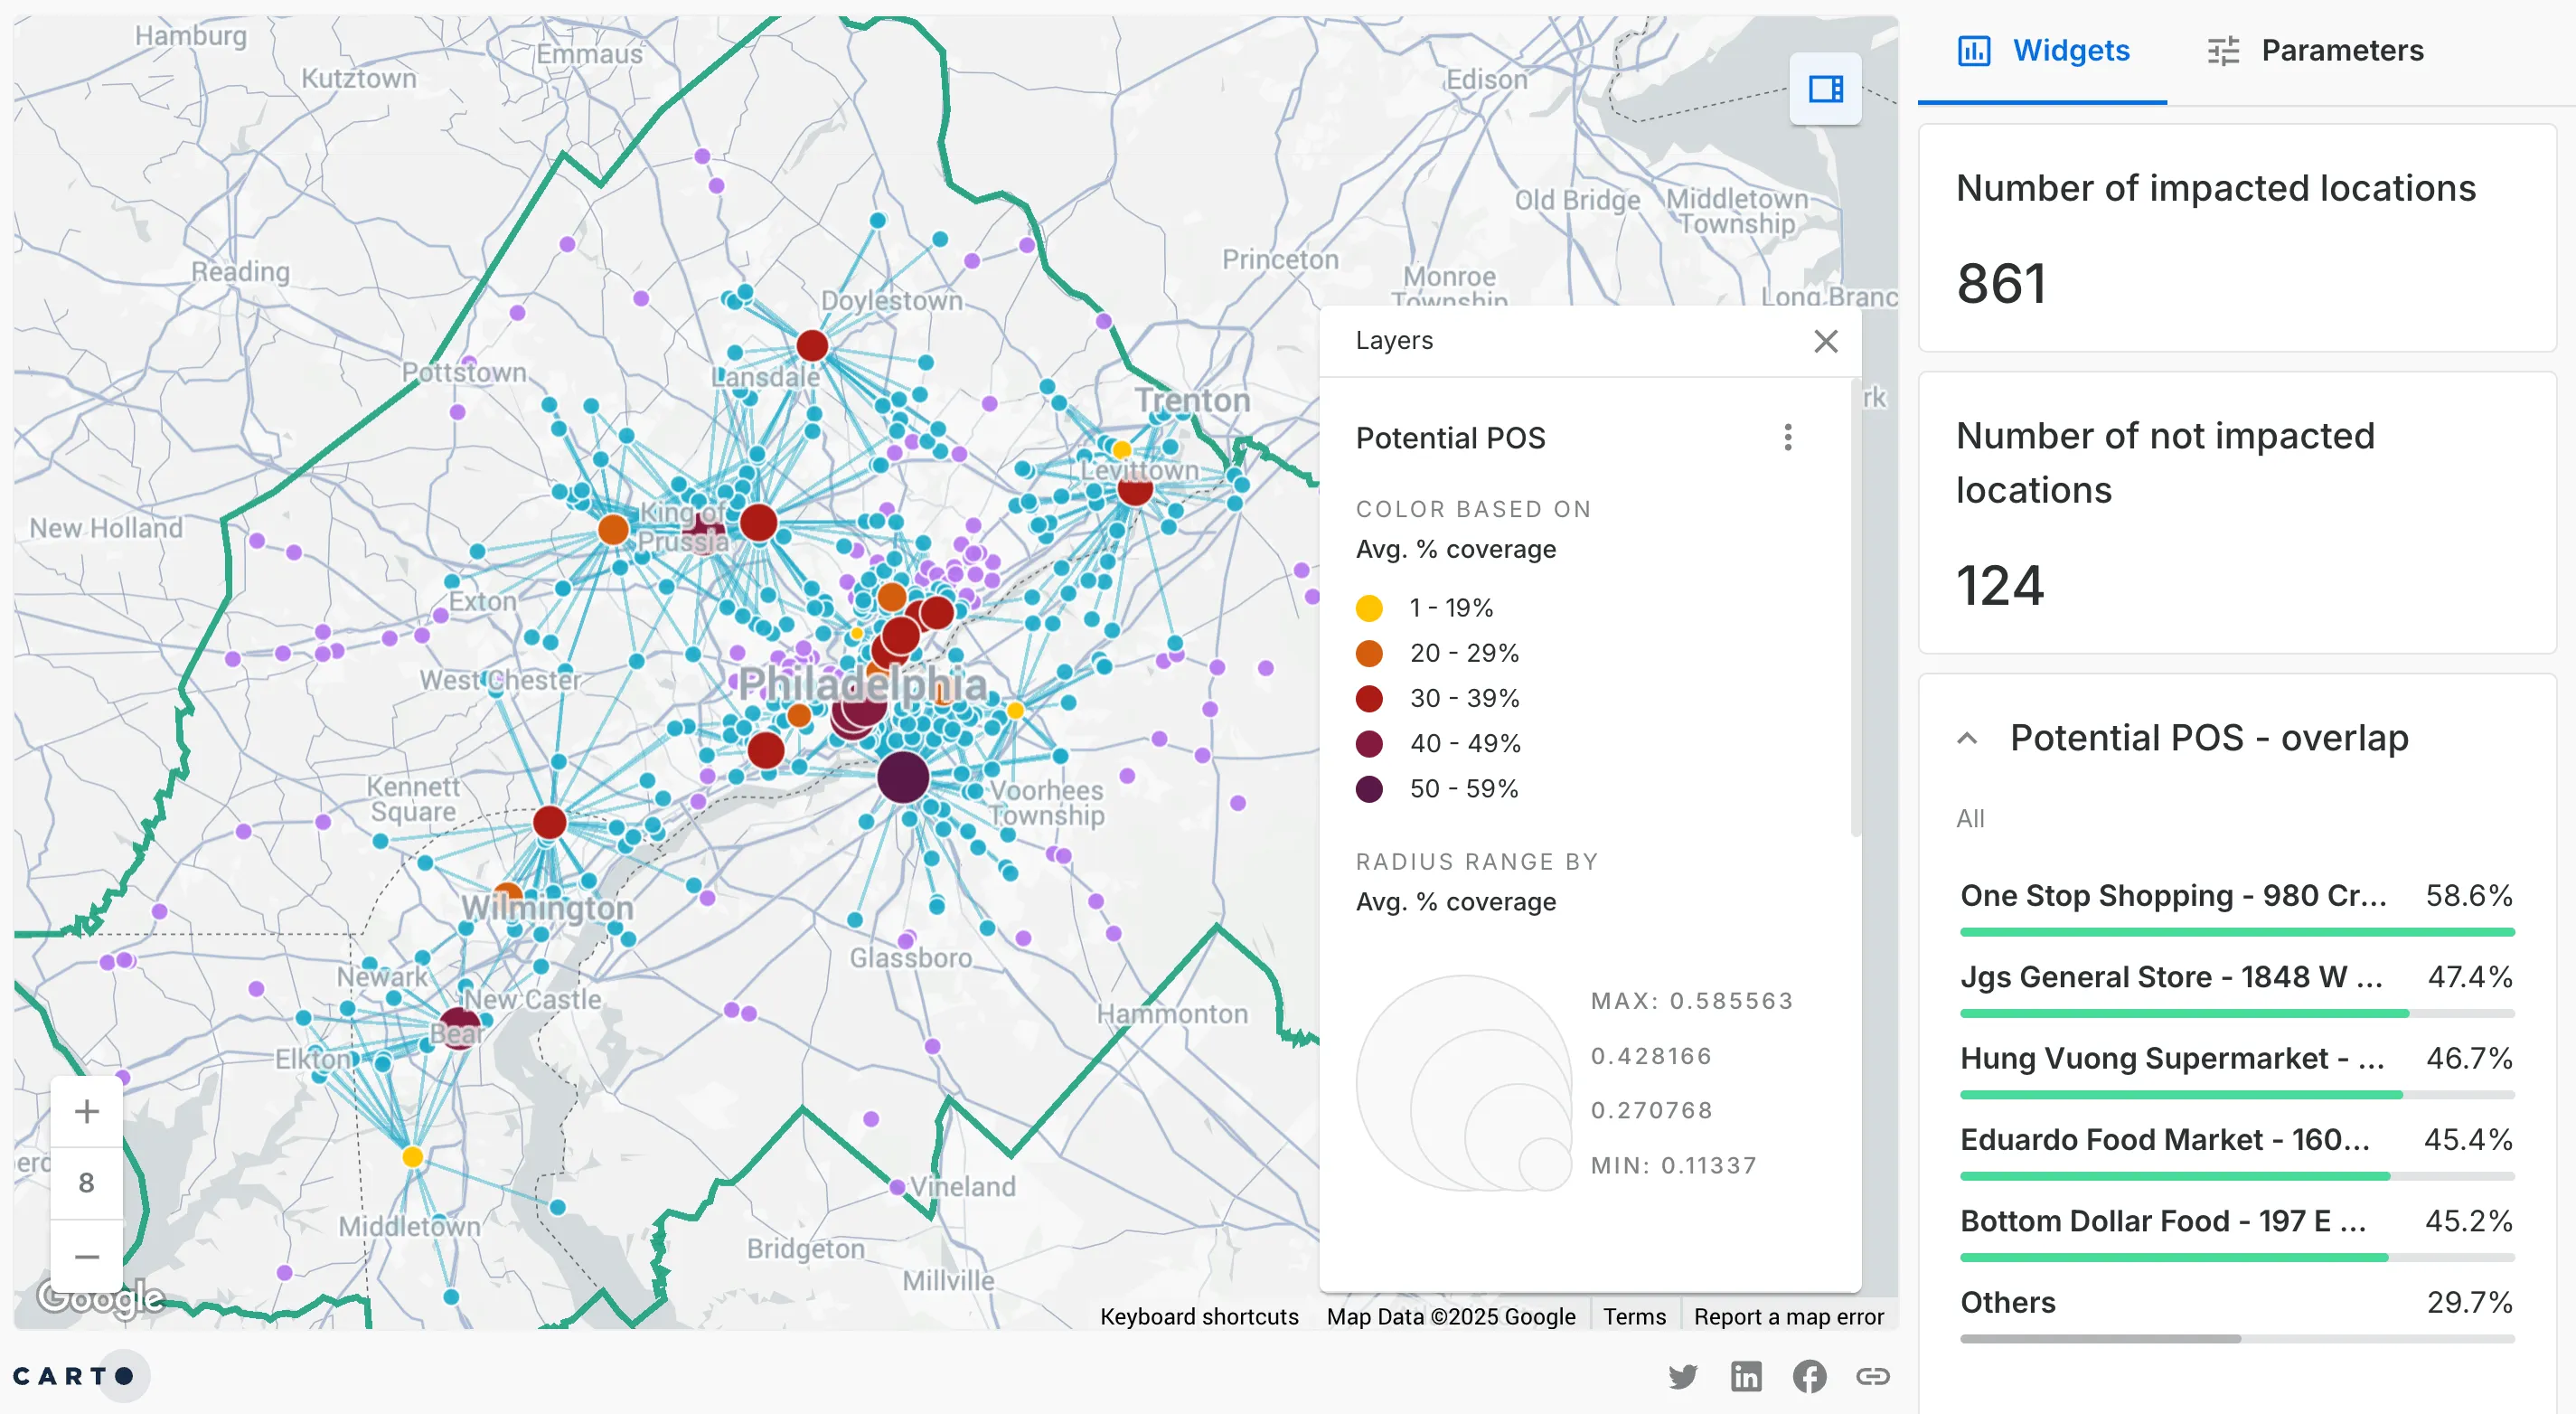
This concept is illustrated in the example above, where CARTO is being used to understand how adding new point of sale to a CPG network might impact existing ones around Philadelphia. By modeling catchment areas and overlaying population data, it’s possible to identify where new merchants risk drawing customers away from current locations.
Learn more 👉 Cannibalization Analysis: what is it & how can I use it?
6. Automate & operationalize your analytics
Planning shouldn’t take months. From scoring sites to merging dozens of datasets, repetitive manual processes kill momentum. Automating your site planning workflows (with tools like CARTO Workflows) saves time and reduces human error - especially when evaluating thousands of potential locations. You can also operationalize, tying them into wider operational processes e.g. scheduling analytics for daily updates and triggering analytics by api.
Here’s what that could look like in action! In the above video, a fully automated process has been set up which allows any user to request an assessment of the impact of a potential new ATM location. They do this by simply inputting the zip code and email address into a Google Form, which triggers a webhook in Zapier which in turn leverages CARTO’s Workflows API to trigger a workflow. This workflow runs the ATM impact assessment and sends the results - in map form - to the original person who made the request.
Learn more 👉 Integrate analysis workflows in your cloud native apps with CARTO
Supercharge your site planning!
Ready to transform the way your organization undertakes site planning? Book a free demo with one of our geo experts today and see how data-driven insights, AI-powered tools, and real-time analytics can elevate your location strategy. Whether you’re selecting new sites, optimizing networks, or planning consolidation, CARTO empowers you and your team to make smarter, faster, and more confident decisions.