Cannibalization Analysis: what is it & how can I use it?


Are you struggling to balance the competing demands between your businesses’ multiple locations? You should be using Cannibalization Analysis!
Whether you’re a CPG company trying to maximize sales across multiple points of sale (POS), or a telecommunication organization seeking to get the greatest ROI from a new 5G tower, understanding the spatial dynamics between different locations is crucial for making informed decisions. These businesses need to carefully assess the impact of new locations on their existing ones.
This guide will equip you with everything you need to get started with Cannibalization Analysis with a 4-step guide, taking you from data collection to decision making - let’s get started!
What is Cannibalization Analysis and How Can Businesses Leverage It?
Cannibalization analysis evaluates the impact of a new location or business on existing nearby locations.
It aims to determine whether the new establishment will draw customers away - or “cannibalize” them - from existing ones, potentially causing a negative impact on a business’ revenue. This is crucial for businesses operating from multiple locations, helping them to make informed decisions about where to expand, relocate, or close. In addition, businesses can use these insights to allocate resources as well as stay one step ahead of competitors.
So what kind of organizations can take advantage of cannibalization analysis? It can be used to solve really wide ranging spatial problems, such as:
- To what extent will placing a new 5G tower in this location reduce churn in this area?
- Where will a new EV charging station have the biggest impact?
- If I start selling a chocolate bar from store X, how will it affect the sales in store Y?
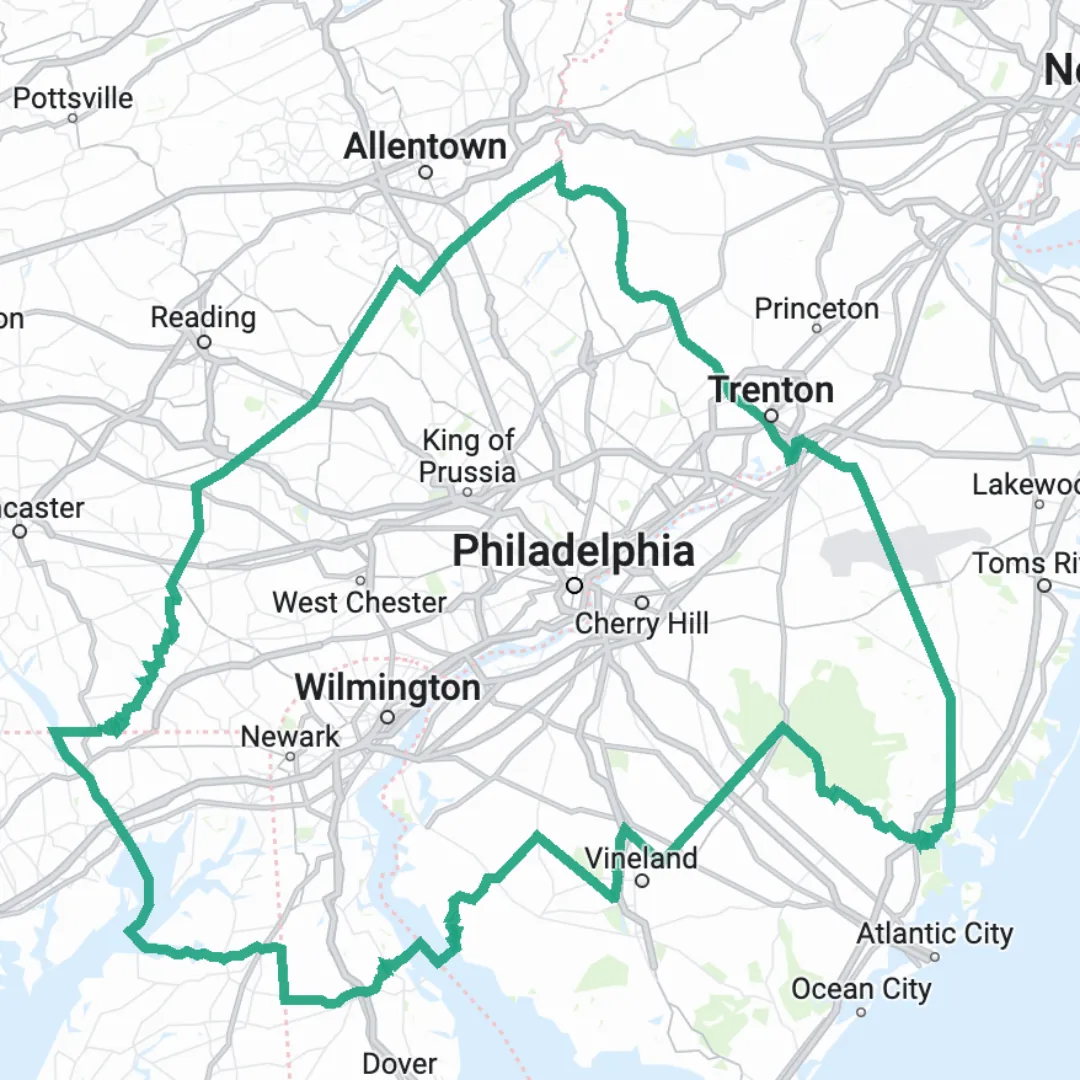
The third of these use cases is exactly what we’ll be using to show the power of cannibalization analysis. We’re going to be looking at this for grocery merchants across the core-based statistical area of Philadelphia-Camden-Wilmington (see below).
A Step-by-Step Guide to Cannibalization Analysis for Data-Driven Decisions
Cannibalization analysis typically consists of 4 main steps.
- Step 1: Data Collection
- Step 2: Data Preprocessing
- Step 3: Running Cannibalization Analysis
- Step 4: The Decision!
Follow along with this guide with a free 14-day trial CARTO account!
Step 1: Data Collection
The data that you will need for cannibalization analysis will depend on your specific use case. As a minimum, you will need:
- Existing locations i.e. the locations which you want to test for cannibalization on, in this case, our existing points of sale. In this example, we’re using a random selection of 40% of all grocery store locations in our study area. We’ve sourced this from our data partner Safegraph - these are the blue points on the map below.
- Potential locations i.e. the locations which may cause cannibalization, in this case potential new points of sale. If you aren’t sure which those potential locations are for you, check out the range of Point of Interest (POI) data available via our Spatial Data Catalog! For our example, we’ve selected 25 random grocery stores across our study area; these are the pink points on the map below.
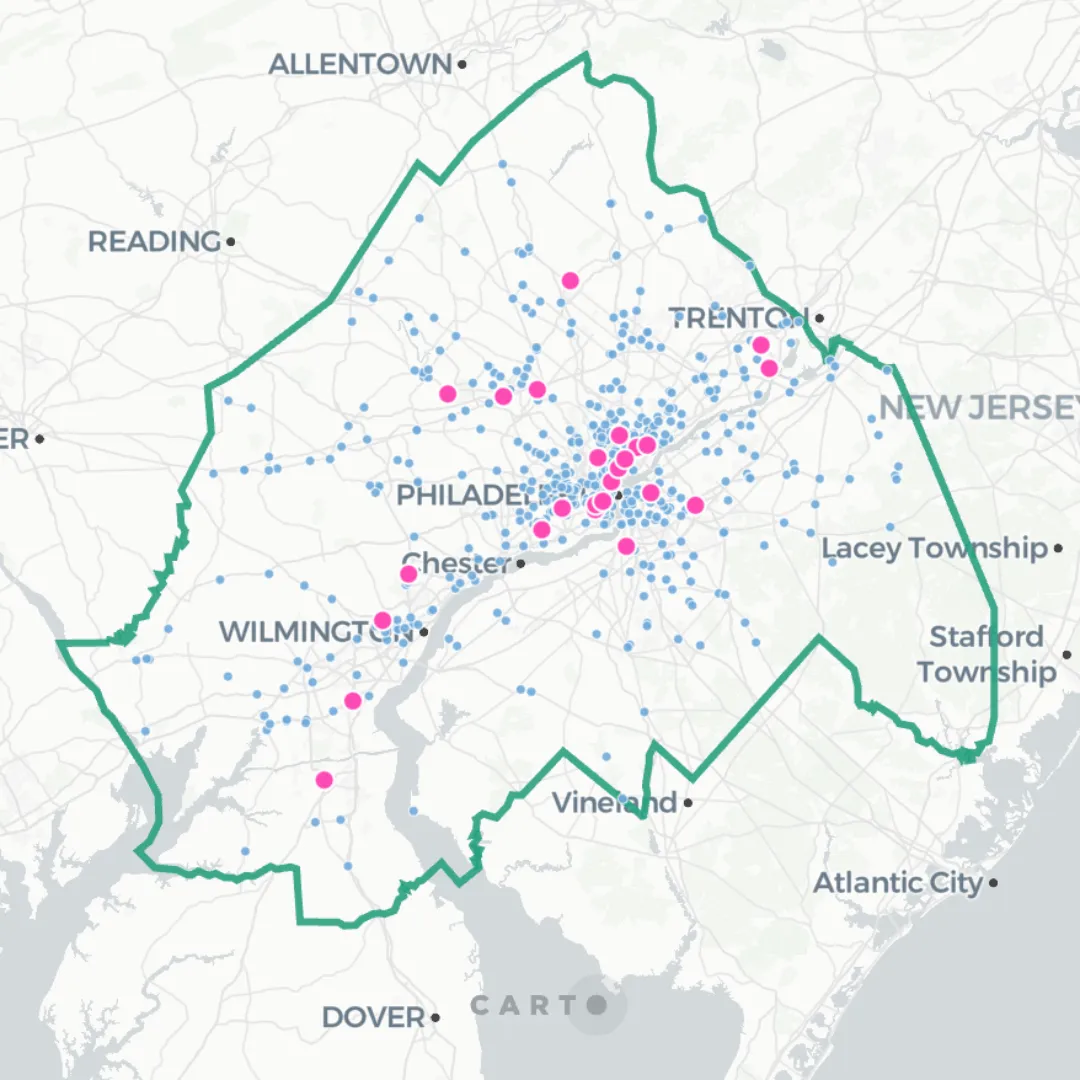
Open the map in full screen here.
Secondly, you will also need data on what could be driving cannibalization; this could be population, footfall, or simply the overlapping area covered by the catchment area of two stores.
For our example, we’re going to be using population data. The source for this is our Spatial Features dataset which is available - via our Spatial Data Catalog - for every country in the world and contains variables on the environment, economy and demographics.
Cannibalization analysis is dependent on establishing a catchment area or geographic footprint for each input feature - in our case, merchants (more on how to do this later!). The idea behind this is that residents living within that catchment area are likely to use that merchant.
A city center merchant may have a smaller catchment area than a rural merchant, as residents in the former areas are often more likely to walk than drive. Therefore, the final piece of the data puzzle we need to collect is urbanity levels. Luckily Spatial Features has a variable which defines urbanity - which you can explore below!
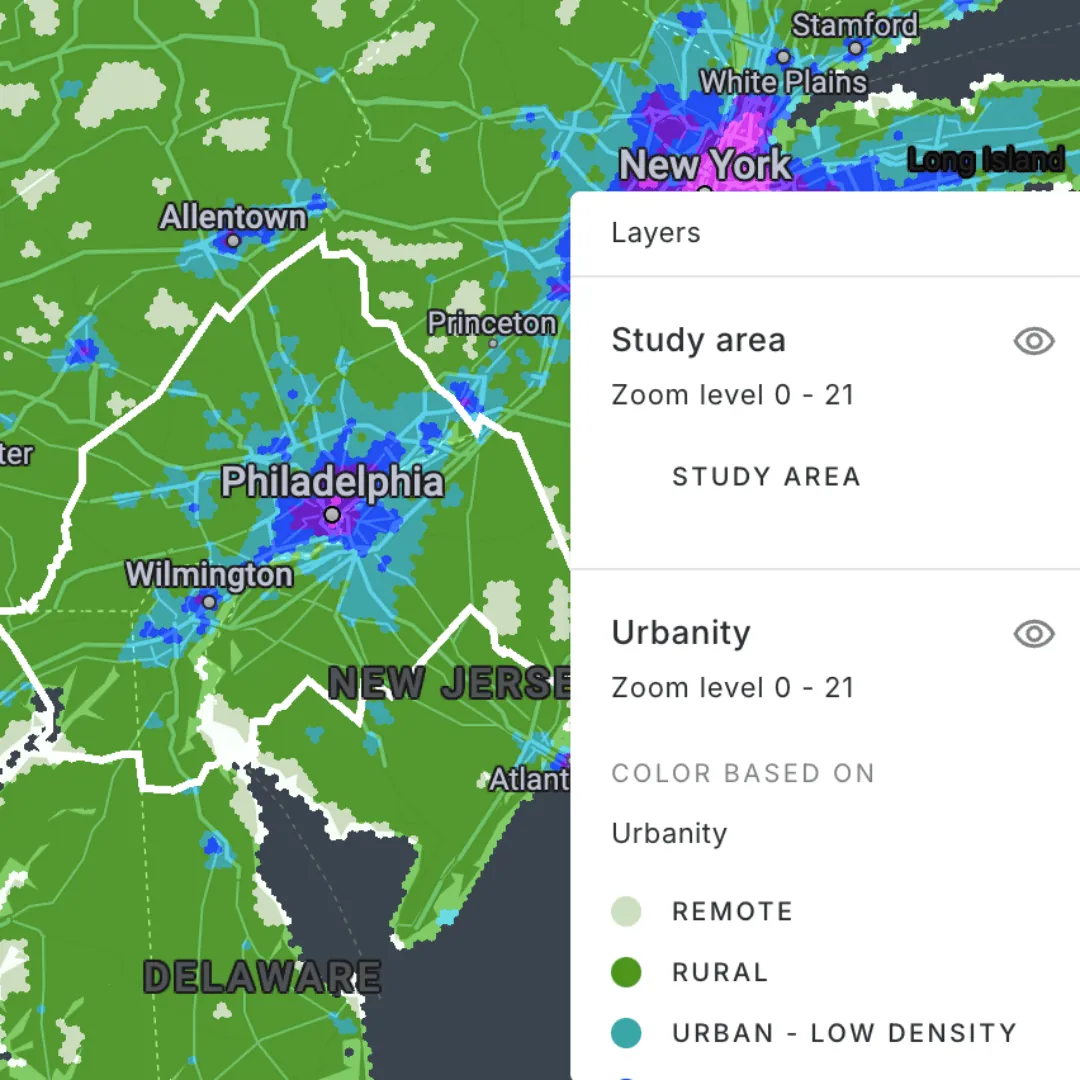
Open this map in full screen here.
Step 2: Data Preprocessing
For this example, we’re going to be using a series of functions that we have developed to make cannibalization analysis as straightforward as possible. These functions can be found in the Retail module of our Analytics Toolbox.
First up is the Build Cannibalization Data function, which we can use to prepare our input datasets from step 1. In our example, this process creates a catchment of geographic footprint for each store, and then calculates the population within that catchment.
The SQL for running this function is below, which you can copy to, adapt and run from your BigQuery console.
Read the full explanation for this in our documentation.
CALL `carto-un`.carto.BUILD_CANNIBALIZATION_DATA(
--grid_type
'h3',
--existing stores: must include unique identifier and geometry
R'''
select * from `yourproject.yourdataset.cannibalization_existing_stores`
''',
--resolution
9,
--method
'buffer',
–Variable slugs - these can be found on the “data” tab of any Data Observatory table you are subscribed to
[('population_f5b8d177','sum')],
–do_urbanity_index: urbanity variable slug from the Spatial Features dataset
'urbanity_e1a58891',
–data observatory connection: replace “xxx…” with your own DO connection, which can be found on any Data Observatory table you are subscribed to, by selecting “Access in…” to view the sample code.
'carto-data.ac_XXXXXXXX',
--output_destination
'yourproject.yourdataset',
--output_prefix
'cannibalization',
–catchment options: distances(buffer radii by type of urbanity in kilometers)
'{"distances":[4.8,1.6,0.8]}'
);
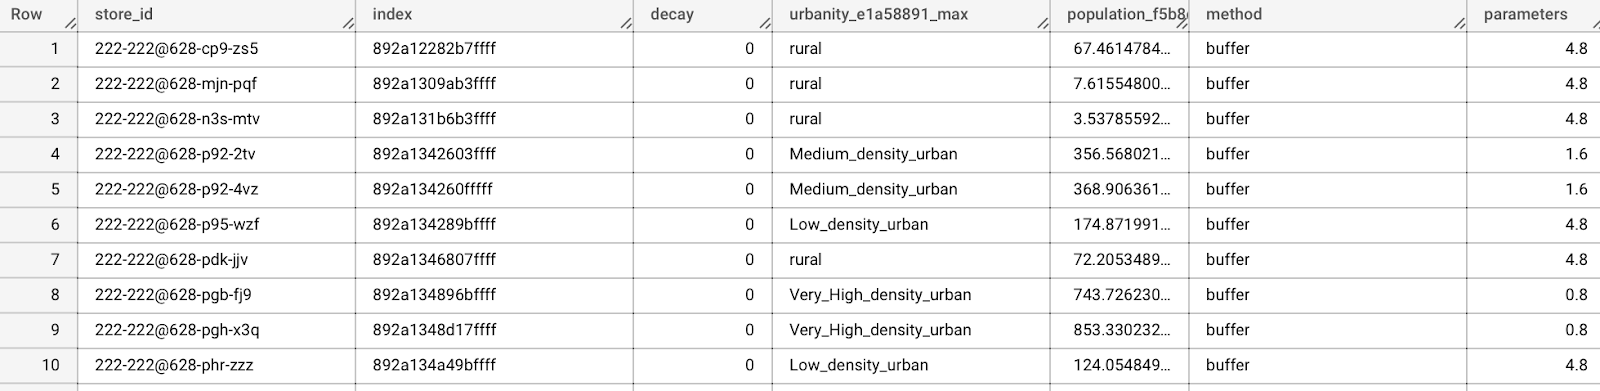
This generates an output table (suffixed “_output”) containing the population within each store’s catchment, its urbanity level, and the parameters used to calculate these. With this information in hand, we can go on to run our cannibalization analysis!
Step 3: Running Cannibalization Analysis
The next step of this pipeline is to run the Cannibalization Overlap function. This will create catchments for a series of input stores (“Potential POS” in the code below) and calculate two output variables:
- Perc_cov_cells is the % of the new catchment area which overlaps with the catchment area of an existing POS.
- Perc_cov is the % of the input variables which are overlapped. So, in this instance, a Perc_cov value of 0.5 would mean that 50% of the population which are in an existing POS’ catchment are also in our potential POS’ catchment.
Example SQL code for this step is below - please refer to our documentation for a full guide.
CALL `carto-un`.carto.CANNIBALIZATION_OVERLAP(
   --Existing POS
   'yourproject.yourdataset.cannibalization_output',
   --Potential POS
    '''SELECT store_id, geom FROM `yourproject.yourdataset.cannibalization_potential_stores`''',
   --method,
   'buffer',
   --do_urbanity_index
   'urbanity_e1a58891',
   --do_source
   'carto-data.ac_7xhfwyml',
   --output_destination
   'cartodb-gcp-marketing-team.Social2022',
   --output_prefix
   'cannibalization',
   --options
   '{"distances":[4.8,1.6,0.8]}'
);
Step 4: The Decision!
You can see the results of this analysis in the map below - or open in full screen here. The more overlap a potential point of sale (POS) has with existing merchants, the larger and darker the point representing it is. You can also see the blue lines connecting each potential POS with the existing merchants it is “cannibalizing.”
%20with%20existing%20merchants.webp)
We've utilized category widgets on this map to help users swiftly identify points of sale with the most significant cannibalization potential. Additionally, we've included a user-defined SQL parameter that allows users to efficiently filter each layer on the map to display data exclusively related to a specific point of sale. This parameter is integrated into the SQL of all layers, and is even being used to dynamically adjust the symbology of existing merchants, indicating their impact status in relation to a new POS.
So what decisions can this help us make?
Well, we might want to avoid stocking our product in merchants which have a high cannibalization percentage, such as One Stop Shopping (58.6%). We would want to be particularly cautious where a new merchant has a 100% catchment overlap of an existing Point of Sale; for example, One Stop Shopping overlaps 100% of Wawa’s (280 White Horse Pike) catchment area.
However, it’s important not to make this decision in isolation. For instance, if your revenue at Wawa is very high - or if you have conducted market share analysis and think you could further penetrate the market in this area - then perhaps expanding to further merchants - like One Stop Shopping - is viable.
Another factor you may want to consider is online sales.
Next steps: Considering online sales
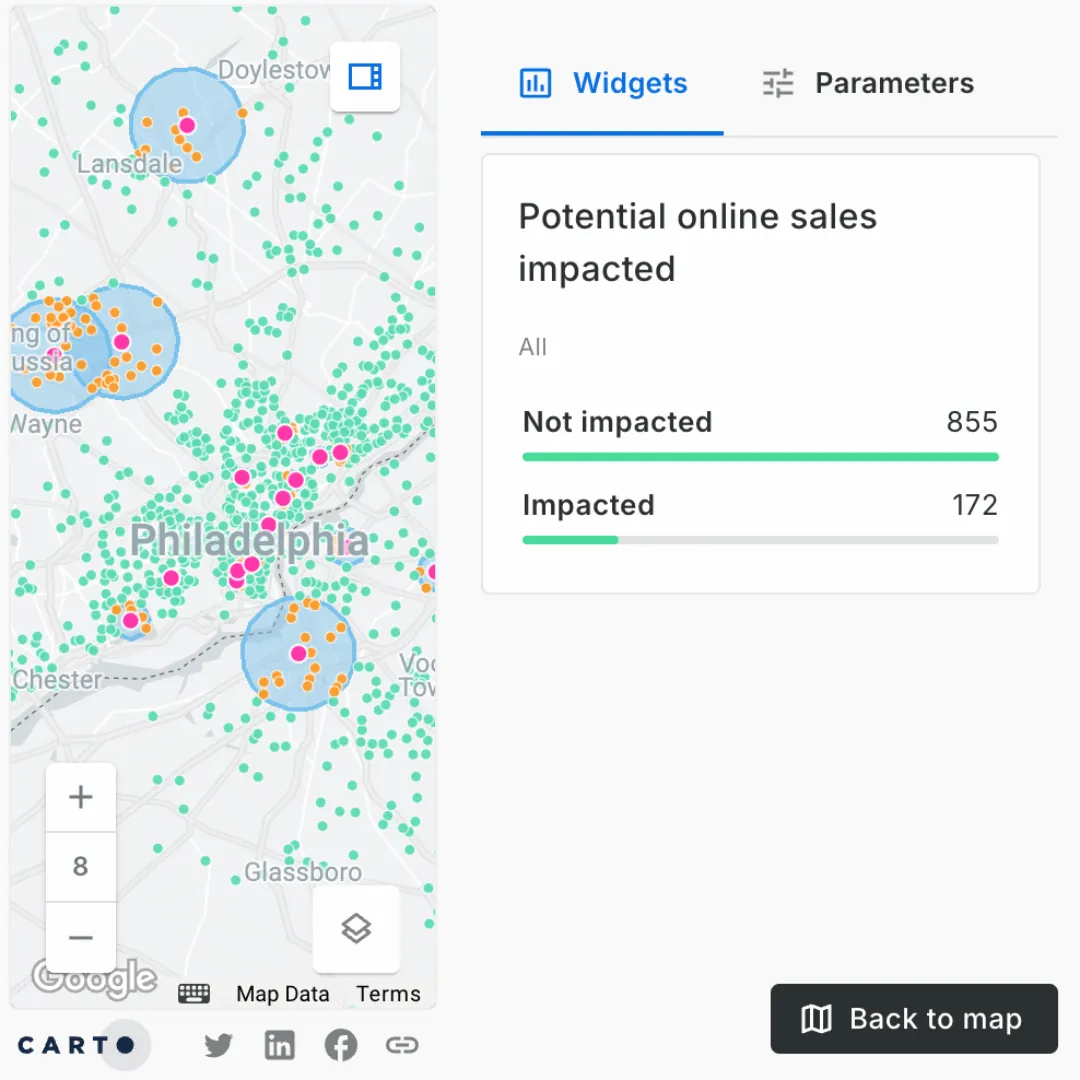
Does your business have a significant number of online sales as part of your omnichannel strategy? If it does - this should be an important step in your Cannibalization Analysis. Is your new point of sale reaching new customers and increasing your revenue, or simply attracting existing customers who already purchase your product online?
The map below (open in full screen here) shows all of the (fictional!) online sales for our CPG brand. We’ve used the merchant catchments created earlier in step 2 to identify which online sales are likely to be impacted by a new point of sale. As before, we’ve used user-defined SQL parameters to dynamically filter and style the map layers to allow the user to easily pinpoint the most relevant information.
Conclusion: Maximizing investment with Cannibalization Analysis
Now that you’ve seen how easy it is to get started with Cannibalization Analysis to manage the demands of competing locations - what are you waiting for? Sign up for a free 14-day trial to start making data-driven decisions today!