Remembering The Berlin Wall Interactive Story Map!


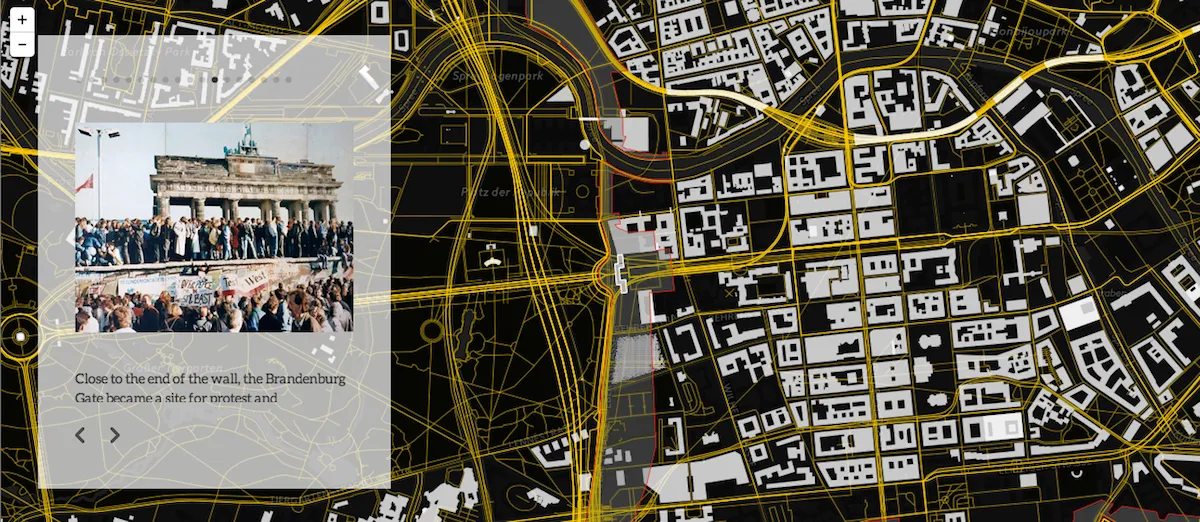
November 9th was the 25th anniversary of the Berlin Wall coming down and to commemorate the anniversary of this monumental event we have created a [beautiful interactive map story] using our easy to use story telling tool Odyssey.js and CartoDB!
Take a minute and look the map above. Then read below to hear some of the tricks we used to make it.
Telling Stories Through Maps
Odyssey.js is a tool we created for journalists and story tellers to easily build interactive map stories without the need for hard coding skills. If you haven't heard of Odyssey.js before take a moment to read about how this tool can be used.
Using CartoDB layers in Odyssey.js
One of the key elements in our Berlin Wall story above is the use of multiple layers and thematic styles. We did this by first designing our map in CartoDB. Learn how to quickly bring in your CartoDB maps and custom base maps to tell your story using the Odyssey sandbox.
Using conditional styling in Odyssey.js
It is easy to change the content of your story map by using conditional zoom visualizations in the CartoDB CSS interface. Here is a snippet from the Berlin Map we shared above:
{% highlight scss%} line-opacity: 1; [zoom = 17]{ polygon-fill: #F11810; polygon-opacity: 0.4; } [zoom = 15]{ polygon-fill: grey; polygon-opacity: 0.4; } [zoom = 10]{ polygon-fill: grey; line-color: #808080; } ##_END_REPLACE_ME_PRE_##
This code changes the visualization at zoom level 17 15 and 10 to represent the parameters identified below the [zoom = ] section.
When you bring your CartoDB map into Odyssey.js those conditions remain on your map and make it easy to change the appearance of your map by simply moving the zoom and assigning a story panel. You can play around with all sorts of conditional [CartoCSS parameters] and be sure to share your awesome creations with us on Twitter @cartoDB or add it to your favorite pinterest map board with the @CartoDB tag.
Oh! Speaking of pinterest be sure to check out the regularly updated Geo Data Stories Cartographic Design and CartoDB boards for cool maps tutorials and general CaroDB mapping goodness.
Mauerfall on Twitter
One last thing to leave you with check out this map of Geotagged tweets mentioning the fall of the Berlin Wall Celebration and key hashtags by Mauerfall published by Twitter:
Happy Mapping!