The Data Observatory is for Cities


Lately we've been talking a lot about data analysis of segmentation and demographics. Those are two things you are guaranteed to uncover when perusing city data. Cities are over burdened with a plethora of issues like crime housing and transportation and need to provide context and solutions for these issues based on information. What that takes is data and lots of it.
Find the data find the solution
U.S. Census and American Community Survey data are key resources to understanding municipal patterns. Accessibility to contextual data about constituents is a critical part of a successful city. Widely available location data is used to make faster and more informed choices like: where to distribute resources improve systems or identify imbalances or inequalities. New insights on a city's infrastructure can be gleamed from location data because new relationships and patterns emerge when seen spatially.
However keeping a city loaded up with the data it needs takes significant effort. Resource strapped GIS and IT departments spend time acquiring data updating it and managing the storage it demands. Additionally managing large datasets take a lot of effort and expensive tools.
It's all baked into the system
The Data Observatory is a way for cities to instantly access common support data at a seriously reduced effort. The Data Observatory houses hard to find and high value datasets on CARTO servers. You don't need to gather store or clean up the data. Instead you can just jump in request data when you need it and start analyzing in just a matter of moments.
For example to view census boundary data on the total population of Oakland CA requires you to simply get the bounding box around the area from bbox finder and put it into the following SQL statement:
INSERT INTO alameda_census_tracts(the_geom geom_refs) SELECT * FROM OBS_GetBoundariesByGeometry (ST_MakeEnvelope(-122.351303 37.656101 -121.958542 37.862928
4326) 'us.census.tiger.census_tract_clipped')
Once the bounding box is set you can request the Census Tracts from the Data Observatory clipped to shoreline.
Next you can pull in the total population for each tract and add a few specific details to the data to give you more control over the output.
UPDATE alameda_census_tracts SET measure = OBS_GetMeasure(ST_PointOnSurface(the_geom) 'us.census.acs.B01003001' 'area' 'us.census.tiger.census_tract' '2010 - 2014')
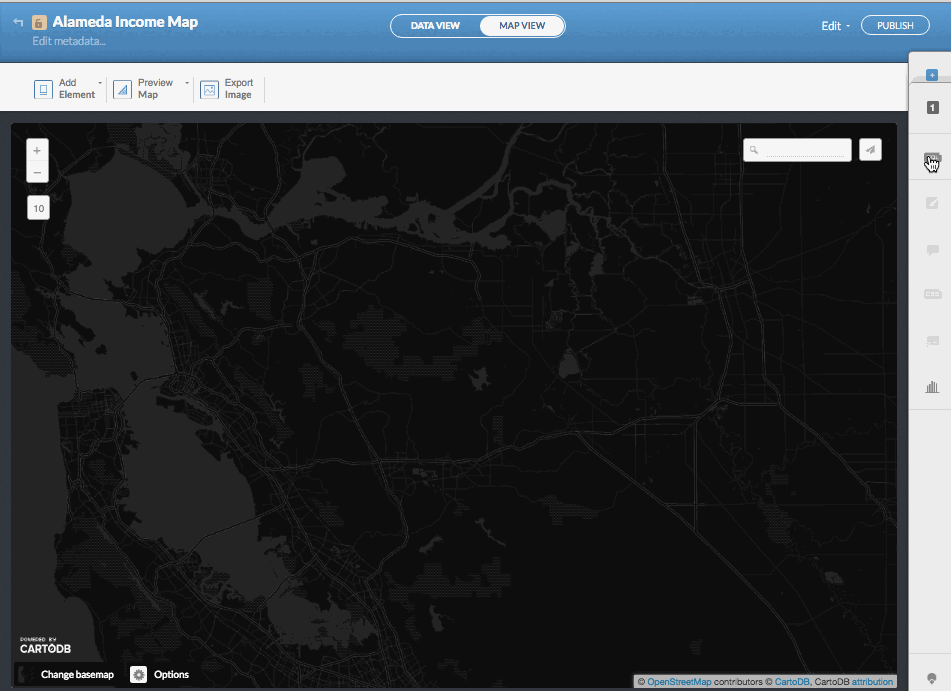
The result - a chloropleth visualization of the data displayed in one of our color ramps.
There aren't any directories to sort through or joins to navigate. Speedier access to data facilitates faster and smarter action by city officials and their staff with fewer worries over resources to get there. The Data Observatory helps you augment official data to build visualization and intelligence tools that matter.
Experiment and iterate
The Data Observatory makes it easier to iterate and experiment with your data and get a more informed end result. We've got some great plans for the Observatory over time the available datasets will expand and cities will have more access to the data they need.
Happy data mapping!