The L Train closure—what data can tell us


The news heard by millions of straphangers around New York City last week was Metropolitan Transit Authority's (MTA) proposed repair to the blighted Canarsie Tunnel, the vital connection used by the L train to connect Manhattan and Brooklyn under the East River. Due to extensive damage caused by flooding from 2012's Hurricane Sandy, the restoration will have large consequences for L train riders in the near future. How massive and where those consequences can show up, can be understood better using a bit of location intelligence.
As the MTA weighs its options — which apparently include a full closing of the L train during repairs, or a longer period with weekend-only closures — CARTO started digging into open data to shed some light on how disruptive the L train closure would be to the people living in Brooklyn.
As a side note, if you are publishing any stories about the L train, feel free to use any of the maps below (or above), no need to even ask. You can find [instructions for embedding each over here](https://gist.github.com/andrewxhill/5ee010594d5f9cb0e769).
Overview of the L Train
The L train is a major east-west subway artery of New York City, connecting Manhattan with many parts of Brooklyn. If you know people who live in Williamsburg and commute to Manhattan in the morning, you've probably heard stories of morning commutes where the only place to put your arms is on the heads of other people, packed like sardines all around you. In recent years, it has been one of the fastest growing subway lines in terms of ridership with the Bedford Avenue stop in Williamsburg seeing 27 224 average weekday customers back in 2014. Besides the crowds, the L is a pretty convenient train for New York because of its early adoption of advanced signaling which allows for a more efficient volume of trains to travel on its tracks.
What data is available to understand more about the L?
To start answering this question, we turned to data from the American Community Survey (ACS), which describes the demographics of people, and LODES, which describes the dynamics between home and work. Both are products of the United States Census.
To look at the relationship of these datasets to the L train, we used location data on L entrances. Gathering all of this data, we are able to assemble information about Brooklyn inhabitants who work in Manhattan and who are likely to use the L based on proximity. We calculate proximity to the L entryways from every block in Manhattan using walking directions calculated by Mapzen's Valhalla.
Using a series of common table joins and geospatial joins on a census block's closeness to an L entrance, we created a summary table of census block groups that are:
Let's take a look!
Why is the L so important?
The above map shows the most likely walking paths of 114 000 people walking to the L train for their commute to work. The width of individual segments corresponds to estimated number of walkers.
Some things you might notice right away is the span of coverage in the northwest and southeast of Brooklyn. In both cases, the L train serves many city blocks that aren't well serviced by other trains.
First, the further east people are located on the L, the more viable alternatives they have to reach Manhattan in the same or similar travel time by changing to another line before the tunnel (e.g. the A at Broadway Junction). Second, we limited our blocks to those that were within a 30 minute walk or less of the subway and inside of Brooklyn. The US Census only collects one mode of transportation to work, so while many people probably take a bus to the subway, the data doesn't capture those cases.
While you can see Manhattan-bound subway riders along the entire length of the L, we were curious what relationships there were between travel-time and proportion of people who work in Manhattan. What we found was that three different breakdowns of travel time all showed a negative correlation (p<2e-04) with travel time. The three breakdowns are the amount of time it takes to walk to the subway station, the amount of time riding the subway to Manhattan, and the total commute time.
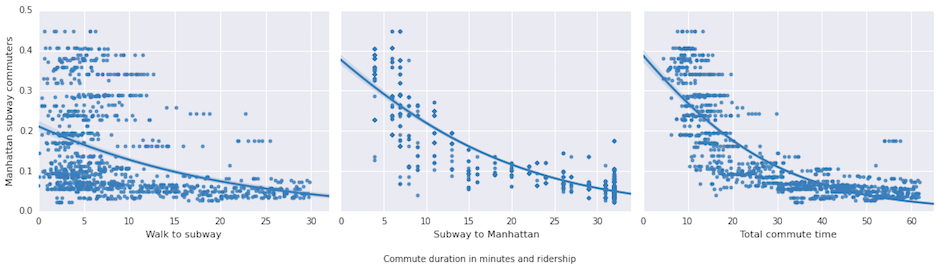
While the correlation is clear, the cause is more murking. Some possible explainations include the facts that many people choose the place they live by how convenient it is to get to their place of work. On the flip side, when people search for new places of employment, sometimes those searches may be related to travel-time from home (e.g. you search in the easiest to reach places first). But those are just two possibilites. The take home, is that a missing L train will completely disrupt this relationship.
If you are interested in the raw numbers, here are some important ones:
These people can't just move to new homes if the L is out of service for an extended period of time. So let's look a bit more at who some of the people are and then what a scenario of shuttle buses would look like.
Affected populations
There are many demographic variables that we can explore, but here we will narrow our focus to poverty status as defined by the ACS to look at the proximity of affected populations to the L.
Of our estimated population of L riders, we see approximately 18 889 Brooklyn households in poverty where the nearest subway stop is the L. We can visualize the distribution of data using a choropleth as follows:
We further analyzed the data with CARTO to identify areas in Brooklyn where significant groupings of like blockgroups (measured by poverty rates) appear. This is valuable for planning outreach and potentially targeted alternatives if the L were to close for a significant amount of time. We are looking for areas with high or low rates of poverty status as larger clusters, with the goal of identifying broader areas that would not have the financial resources and job flexibility to overcome a major transit disruption.
As you can see in the above map, smaller clusters in Bushwick and larger ones in Brownsville and East New York have significant areas of low poverty rates and are in very close proximity to the L. These clusters are likely not served entirely by the L train as they are also situated close to M, J, and A stations. Depending on capacity of those alternate options, these might be places to explore additional bus services to Manhattan.
Greenpoint, while situated very close to the L has low rates of poverty as compared to neighboring census block groups. It is also on the G, so has transfers to Manhattan-bound trains to the north and south, as well as close access to the Williamsburg and Queensboro Bridges and Queens Midtown Tunnel if the MTA were to start shuttle service. While these people could be served by busses shuttling them to Manhattan, one could also guess that a good number of this affuent population would be targets of commercial modes of transportation during a disruption of L service. Keep your eye out for new Uber and Lyft advertisements along those dense walking corridors.
Is there a realistic alternative?
When Gothamist covered the potential shutdown, they called it a disruption of epic proportions. We were curious just how much of a disruption a full closure of the L train would cause. The MTA suggested that one of the fastest ways to fix the L would be to close the Canarsie Tunnel completely potentially replaced by shuttle bus services. Would that be realistic?
To answer that question, we used CARTO to analyze the best option for riders given different bus coverage. Based on the location of the Williamsburg Bridge, we made the assumption that buses would originate at or close to the Lorimer stop in Williamsburg and end in the Lower East Side or Union Square in Manhattan. Using the Valhalla router again, we found that the fastest a person could get to Manhattan via this new bus line would be around 10 minutes without traffic. To get to any location on the L line in Manhattan would take closer to 20 minutes by bus.
If the shuttle bus takes 20 minutes, we are able to calculate the best choices for riders along the L needing to get to Manhattan. Should they go all the way to Lorimer and take the shuttle bus or should they transfer earlier at Myrtle-Wyckoff to the M train or at Broadway Junction to the A? The answer is shown in the map below.
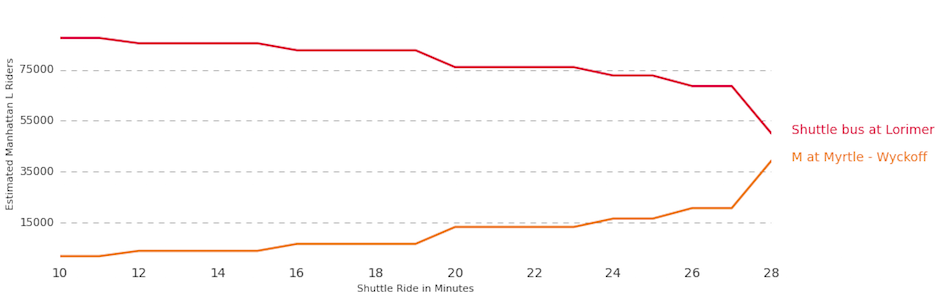
We found that for a 20 minute bus shuttle service, all but 5 stops on the L, riders would be better off transferring to another existing line. The challenge that we realized was that the shuttle is the best option for almost 75,000 riders per day. Given large buses with 65 passengers this would still take 1154 bus trips per day, or a bus every minute and a half or so. That's pretending there are only completely full buses or rush hours. To handle this capacity they'd have to build a new bridge.
Yet still at the various speeds of shuttle bus connections, how many subway passengers would still be better off taking the bus than back tracking to the M? What we found was that the numbers slowly decline up to 28 minutes. If the shuttle buses took 28 minutes they would still be the better option for 53 000 passengers over back tracking to the M. That is still 816 buses per day. If the shuttle buses took 29 minutes, everyone along the L is better off just taking the L to the M or the A transfers to get to Manhattan.
Interested in more?
We'll be watching this topic closely. If it gets interesting, we'll post some follow-up and deeper looks at what it would mean to close the L.
If you want to learn more about the methods we used above or about how to do advanced analyses of data with CARTO get in touch!