Mapentines: Love is Like a Stack of Static Maps


This week marks a winter slurry of holiday occasions including Lincoln's Birthday (Wednesday) World Radio Day/Friday the 13th (Friday) Valentines Day (Saturday!) and Halfprice-Chocolate Day (aka Sunday)! In the spirit of the latter (two) we celebrated this week with our community at Monday's Geo-NYC Meetup prefiguratively themed "Love Stinks." Our plan was simple/typical: make some cool maps to give people hope this holiday season. Read on to learn how we did it.
Not too long ago CartoDB launched the Static Maps API built by popular demand from our community members. We often field requests about exporting maps as images for print images that are compelling and dynamic as their originals in digital form. While this might seem like a simple utility it's something of great value to many of our community members and no-time like the present to make that part of our festive program of 20% projects in the office. For Valentines Day and to promote the API we sent out a survey to all attending meetup members of Geo-NYC requesting simply.
We thought it might be nice to turn these distance relationships into drawn trajectories on OSM basemaps and then provide postcard prints to the survey responders. What followed was a series of steps to auto-craft them the perfect map-nerd valentines and distribute them for mailing at this week's GeoNYC.
Process
Step 0: Get Data
After collecting and closing the survey we exported the Google form data and did some quick cleaning and standardization of the location data so that we could pull lat/longs from Google's geocoder API and build our map. Depending on the quality of your data you can also just load it into CartoDB and select the geom column to test our auto-georeferencer by place names or admin level.
Here's a JS-Bin where you can test this if you're interested.
Step 1: Set Geom
Once loaded into CartoDB we set the geom to accept multi-string coordinates (that is map the pair of lat/longs to eachother with a MakeLine) and then checked the display to confirm they plotted as we had hoped.
They hadn't. There was some jank in the way the lines plotted as they crossed tile blocks. How to fix? PostGIS.
Step 2: SQL/Image Magick
With a few lines of SQL in the editor we were able to smooth the lines across distances give them a slight arc and then apply a heart png to the centroid of the line plotted.
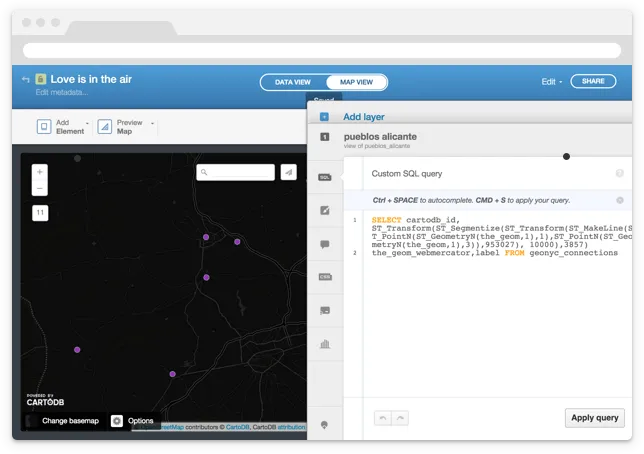
We then wrote that SQL and associated CartoCSS into an html template to test the image plotted selecting on the cartodb_id for each row in our table so that we could plot each pair of trajectories individually on personalized postcards.
##_INIT_REPLACE_ME_PRE_##
SELECT
  cartodb_id
  ST_Transform(
   ST_Segmentize(
    ST_Transform(
     ST_MakeLine(
      ST_PointN(ST_GeometryN(the_geom 1) 1)
      ST_PointN(ST_GeometryN(the_geom 1) 3)
     )
     953027)
   10000)
  3857) AS the_geom_webmercator
  label
FROM
  geonyc_connections
##_END_REPLACE_ME_PRE_##
Options:
You can customize your visual further with CartoCSS in this case we rounded the line endpoints and adjusted the color to hex-match our heart.
You can check an html template that illustrates all-of-the-above here.
Likewise you can set the extension for your image file my default was PNG but keep in mind that RGB/PNG is not an appropriate print format for most printers.
It's best to post-process your batch of photos with Image Magick or use Photoshop/another image processor to convert to CMYK proofs.
Like this:
Step 3: Polish + Package the Postcards
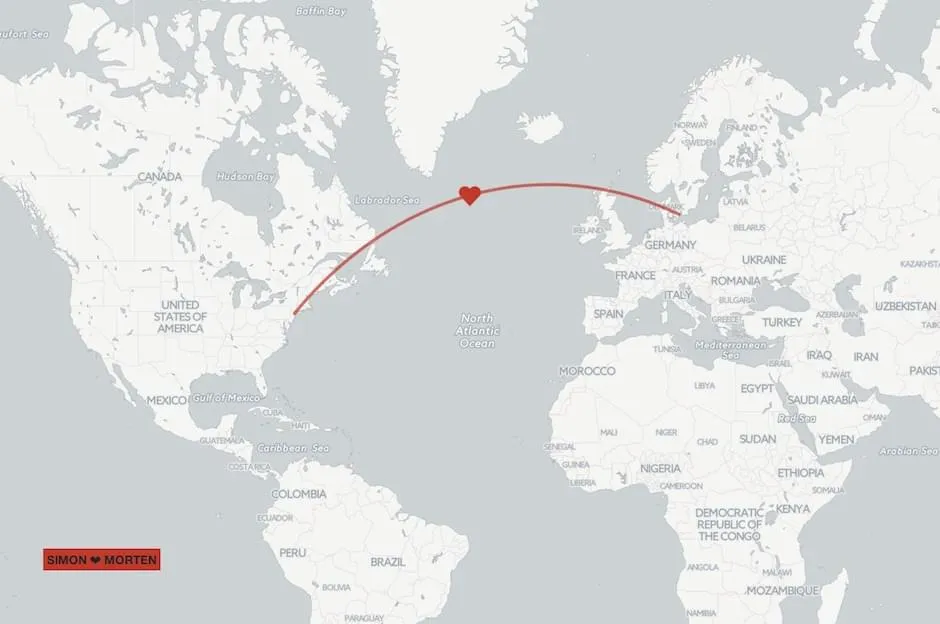
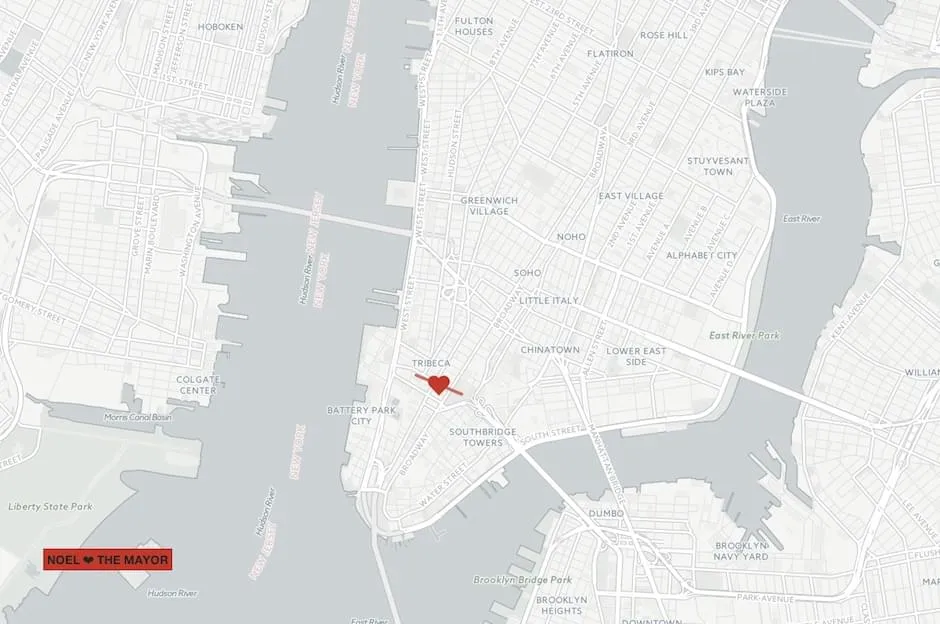
We then set the images in an InDesign template for printing selecting the light basemaps so that the color quality would be a bit more intelligible.
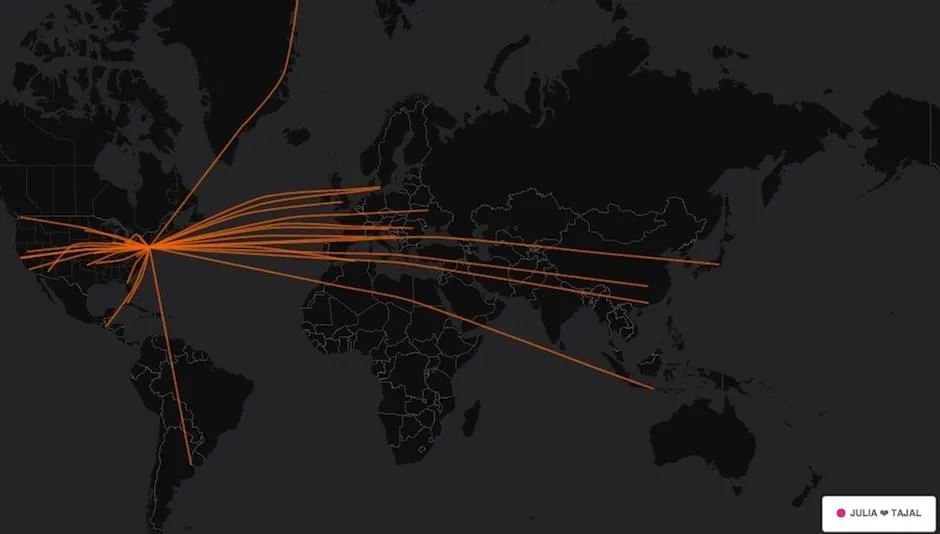
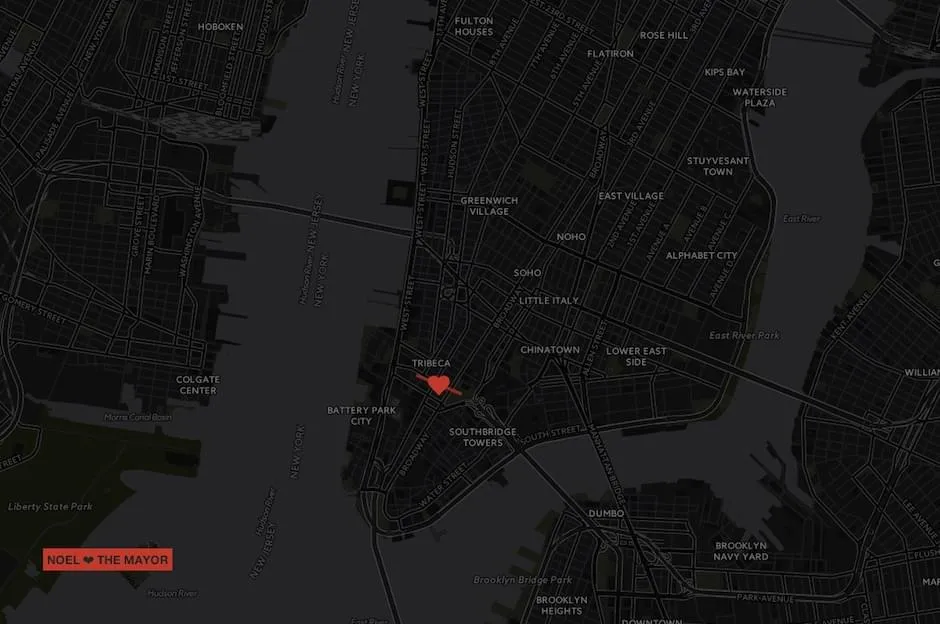
The dark basemaps were a bit too tonally subtle to render in print:
Other basemap options are available in the CartoDB docs which you can set in the basemap config of your html template (linked above).
By manipulating the "urlTemplate" custom basemaps can be used in generating static images. Supported map types for the Static Maps Api are:
'http://{s}.basemaps.cartocdn.com/dark_all/{z}/{x}/{y}.png'
'http://{s}.basemaps.cartocdn.com/dark_nolabels/{z}/{x}/{y}.png'
'http://{s}.basemaps.cartocdn.com/light_all/{z}/{x}/{y}.png'
'http://{s}.basemaps.cartocdn.com/light_nolabels/{z}/{x}/{y}.png'
##END_REPLACE_ME_PRE_##It's Mapenti[m]e
Once printed and cut the result was a series of twee valentines that GeoNYCers totally dug. Some of our favorite pairs include
- Noel ♥ The Mayor
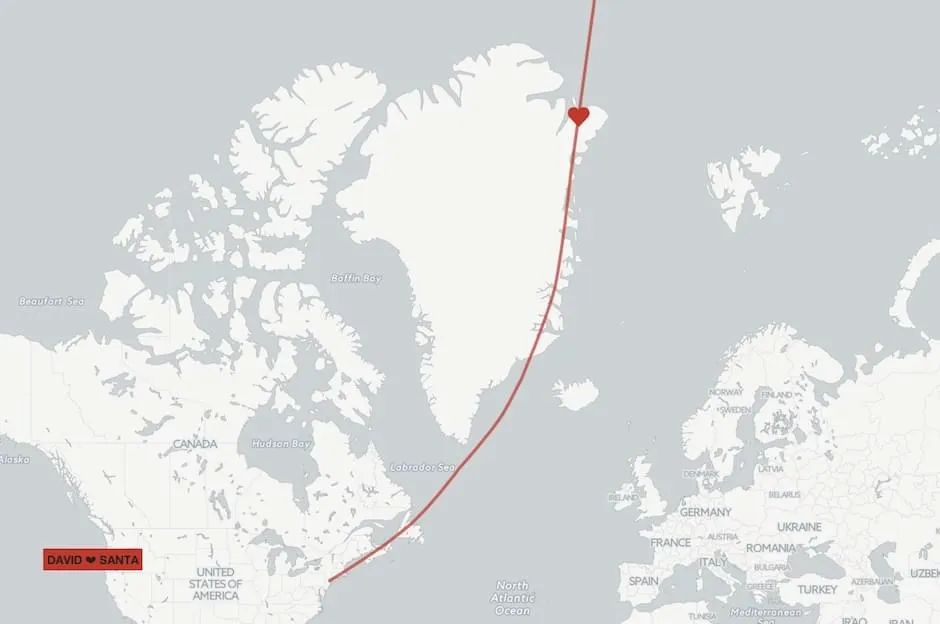
- David ♥ Santa
You can browse all of the mapentines in this pdf doc here.
I documented the process in a github repo complete with the image composite script for attaching html elements to your images and upping the quality to suit your print needs. Feel free to fork and build your own mapentines for the ones you love near and far.
Happy Mapping!