MaptimeNYC's favorite SQL statements for CartoDB


![]()
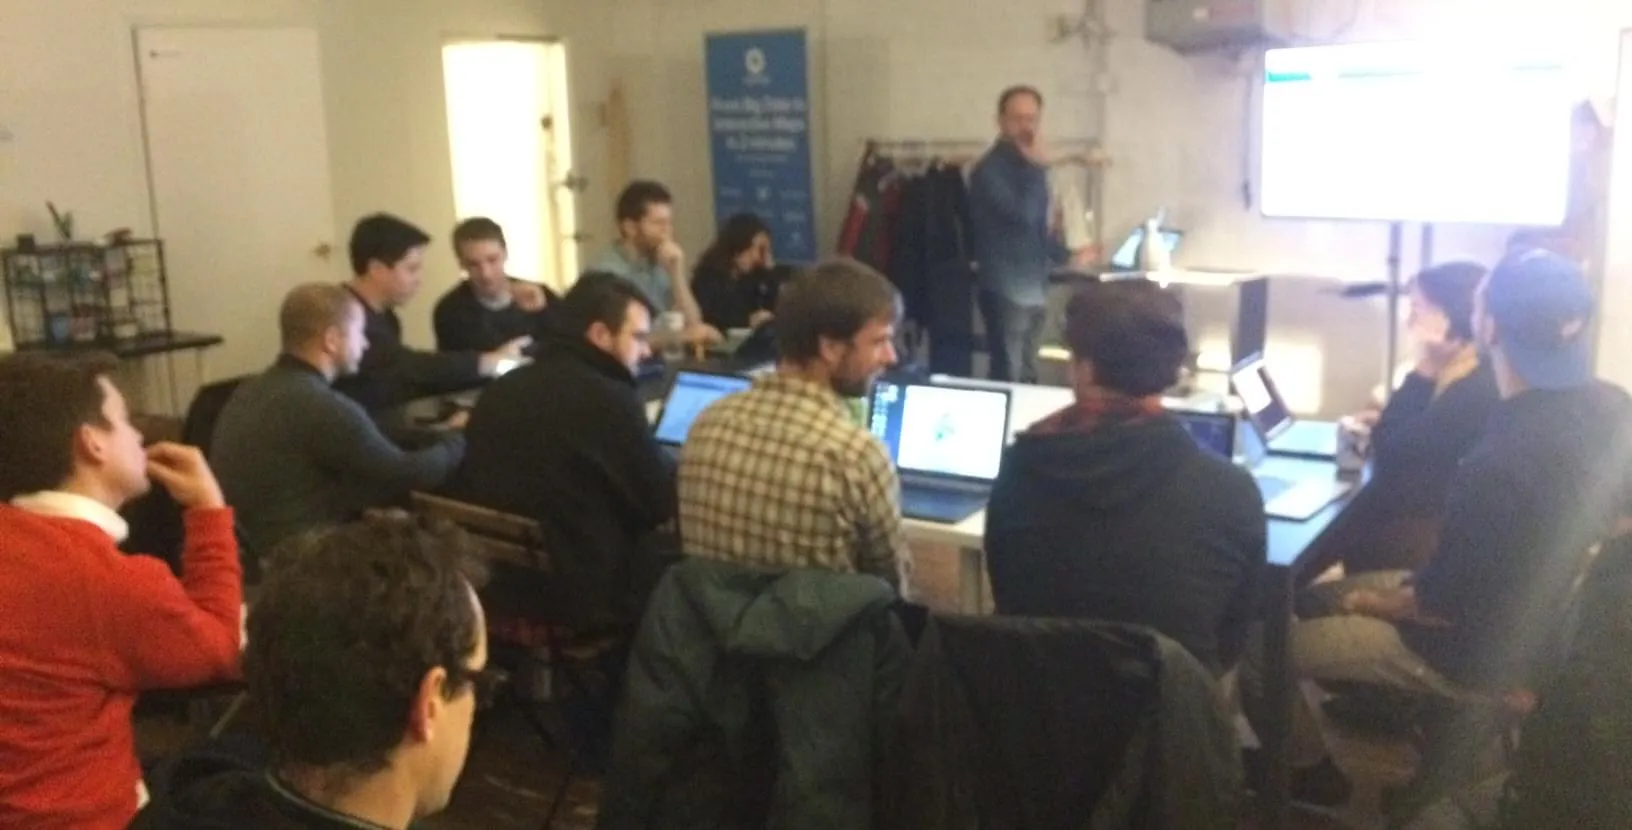
Recently CartoDB had the the chance to put our new space to work by hosting MaptimeNYC in our New York office. This exciting and informative session was a great opportunity to bring together mappers from across the city in a community-run and critically engaged environment.
Every two weeks in New York (and in other cities across the nation and world) a group of twenty or so mapping aficionados meet to share ideas and build community around mapping and generate learning experiences around how to create functional well-designed maps. Maptime is a great place for newbies and experienced mappers alike to come together and build collaboratively. People from all professions and interests are encouraged to bring mapping problems and barriers that are holding them back and through our growing and active mapping community participants can break through some of the barriers in constructive ways while making friends. Whether you are new to mapping getting started with CartoDB or a long-time GIS professional Maptime creates a safe space to experiment make mistakes and lean on experienced peers. Plus… pizza. (You can’t beat mapping and pizza!)
Each session of Maptime is designed to showcase a skill or technique presented by a fellow mapper then transition into problem-solving working sessions that tackle everything from CartoDB’s built in APIs to Javascript and many other facets of developing and mapping technologies. Our community of mappers here in New York and across the world are creating a strong culture of data visualization that CartoDB and our family of web-based mappers are proud to be embedded in.
Early December’s session featured the second part of a series on SQL using PostGIS which many have been aching to improve their skills given its robust capabilities in CartoDB.
So we offer you part 2 of our SQL demo:

Built and fine-tuned by the group of fifteen that gathered at CartoDB HQ in NYC last week these handy SQL queries range from common to exotic and inform a wide range of experienced users. We hope you find them useful!
Connecting a dots with lines: ST_Makeline
This is one for the n00bies. So you have a bunch of points whether from a GPS or points you’ve created and you want to connect them to make a path. Seems simple but might not be as straightforward as you think.
Make sure you have:
- Points on route - Here we’ve just made a few points on a blank table to make it simple.
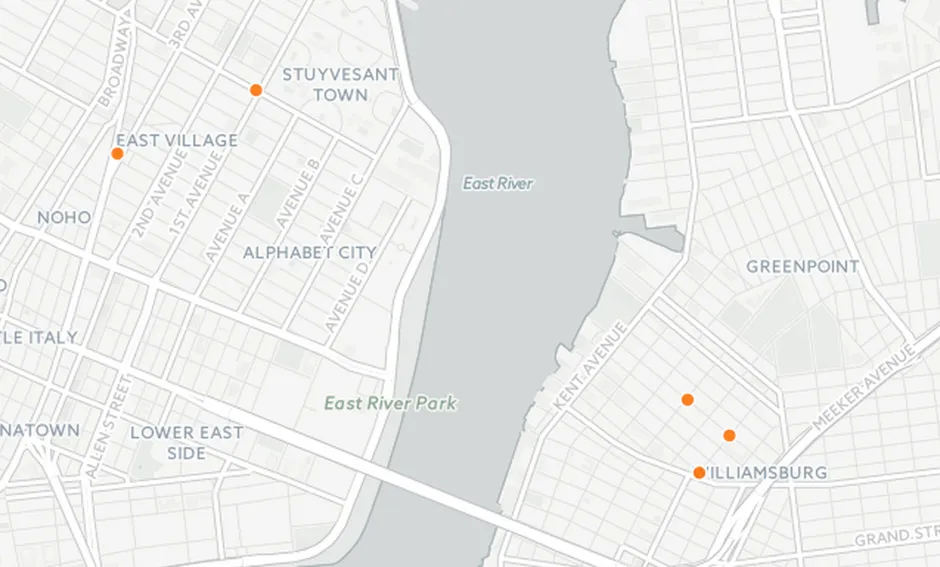
- Order points (can be cartodb_id) to make the line connecting groupings of dots. These points can be route direction segments etc.
- If you have more than one type of line - say a route that goes through two directions or has different qualities - Connect lines with the statement: ST_Makeline
##_INIT_REPLACE_ME_PRE_##
SELECT ST_MakeLine (the_geom ORDER BY _order ASC)
AS the_geom  route
FROM maptimesql_points
GROUP BY route
##_END_REPLACE_ME_PRE_##
From here you can create a new table when prompted on the CartoDB Interface.
Lines appear in new table:
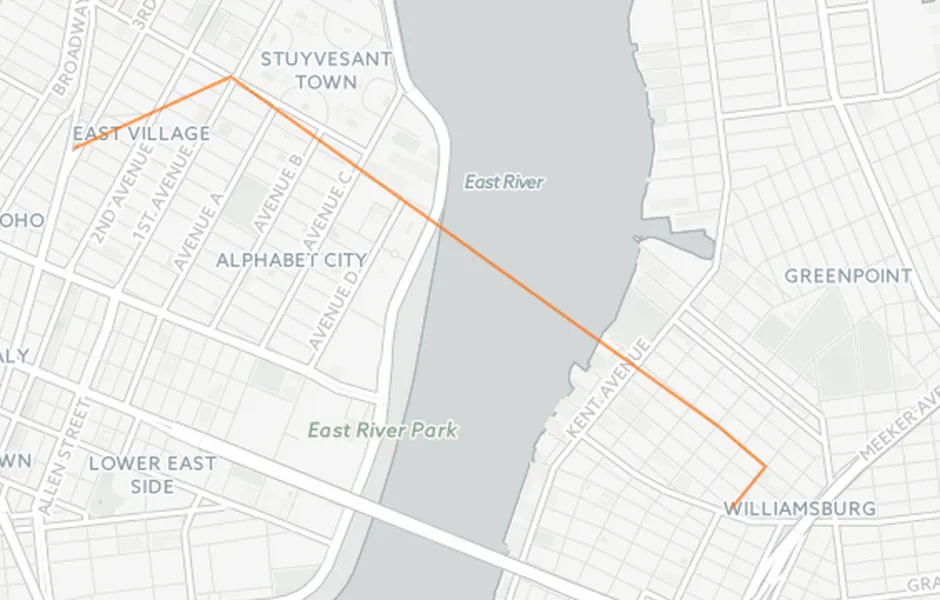
Alternately you can add in webmercator to create the line AND the cartodb_id to make it interactive. Try removing one or both of those to help you understand the function of them:
##_INIT_REPLACE_ME_PRE_##
SELECT ST_MakeLine (the_geom_webmercator  cartodb_id ORDER BY _order ASC)
AS the_geom_webmercator  route
FROM maptimesql_points
GROUP BY route
##_END_REPLACE_ME_PRE_##
Points in a Geographic Area: ST_Contains
Let’s say you want to find all the points inside of a geographic area. The first thing you need is a table with polygons and a table with points. Here we will use two CartoDB common data sets Real Time Earthquakes (points) and US Counties (polygons) found at the top of your CartoDB dashboard.
In the end this will take the counties and highlight the ones that have had earthquakes in the time-period defined by the earthquakes dataset.
Make sure you have:
- Points table in CartoDB (in this case earthquakes)
- Polygons in a table (us_counties)
Use the_geom_webmercator to get the polygons and points merged on one table without having to select ‘create new table’.
##_INIT_REPLACE_ME_PRE_##
SELECT us_counties.the_geom_webmercator us_counties.cartodb_id  count(quakes.the_geom)
AS total
FROM us_counties JOIN quakes
ON st_contains(us_counties.the_geom quakes.the_geom)
GROUP BY us_counties.cartodb_id
##_END_REPLACE_ME_PRE_##
10 Closest Points to a Selected Latitude and Longitude: CDB_LatLng
One thing that SQL allows you to do is create compounded functions and compile multiple steps into a more simple statement. Here we are using CDB_LatLng (latitude Longitude)) to find the 10 closest points from a selected latlon. The original statement is found below and is unwieldy and difficult for new or intermediate users. CartoDB has created a few new statements to make life easier.
We will now find the ten earthquakes closest to Times Square.
Make sure you:
- Have a table with a lot of points. (You can use the earthquakes data from the previous section)
- Put the SQL statement below into the UI changing ‘quakes’ to your table name
- Apply query
It should show you the ten closest earthquakes on that day to the point you noted. Use can use any latlon. Find out yours here.
##_INIT_REPLACE_ME_PRE_##
SELECT * FROM quakes
ORDER BY the_geom <->
CDB_LatLng(42.5 -73) LIMIT 10
##_END_REPLACE_ME_PRE_##
Compare Rows of Data Visualize Difference: lag( )
The lag() enables you to compare to rows of data and pull out the difference of those and display that difference visually. Here we will use some self-created data to look at the time between stops on a New York tourist’s landmark tour.
What lag() does is to takes the data in a row and compare it to a determined previous row. lag (column number of rows back). Useful in comparing data and extracting duration. Here’s a link to what’s happening in the background.
Make sure you:
- Have a journey that has points along a route. (can be multiple routes)
- Use this table to start
- Download the data and create a new table
- Look at the map to make sure everything is in place
- Put the SQL statement below into the UI changing ‘landmark_visits’ to your table name
- Apply query
- Make new table from query
You should see lines running between the landmarks that can now be changed using a chloropleth for lines to show the difference in times between the journey segments.
##_INIT_REPLACE_ME_PRE_##
SELECT cartodb_id the_geom  description  extract(epoch FROM (time_left - lag(time_left 1) OVER(ORDER BY time_left))) AS duration_in_seconds
FROM landmark_visits
ORDER BY time_left
##_END_REPLACE_ME_PRE_##
That wraps it up! We hope you learned a lot. SQL and PostGIS can be powerful tools for visualizing and analyzing data. If you want to learn more check out our SQL and Post GIS Academy course and come out to Maptime NYC. Come learn new things help grow our mapping community! We hope you learned a lot and as always:
Happy Mapping