

CartoDB + Plotly + IPython Notebooks


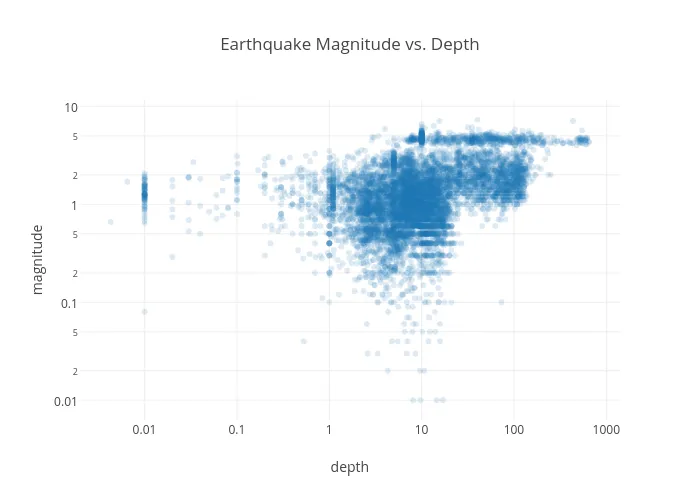
CartoDB Plotly and IPython notebooks work beautifully together. The plot above was made on Plotly from data imported into an IPython notebook using the CartoDB SQL API.
Plotly is a cloud-based graphing and analytics platform with Python R & MATLAB APIs where collaboration is easy. Using Plotly with CartoDB's SQL API leads to endless possibilities.
Together with Matt Sundquist at Plotly I've made an IPython notebook that allows the following data flow: CartoDB's SQL API → Python pandas dataframe → beautiful plotly plots. Because of IPython's rich display system you can also easily embed your CartoDB maps into IPython notebooks.
Head over to Plotly's website to see the notebook that Matt and I made.
We're excited by how easily CartoDB and Plotly work together. Watch this space for more experiments between the CartoDB and Plotly teams.
Happy Mapping and Graphing!
