Summer Mapping Project


With summer starting to wrap up in the Northern Hemisphere so are trips to the beach the mountains or anywhere in between. What better time than now to highlight all the memories made with your GPS mobile device?
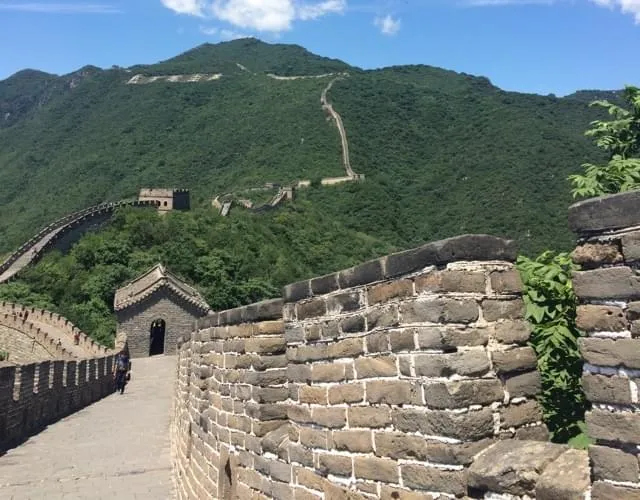
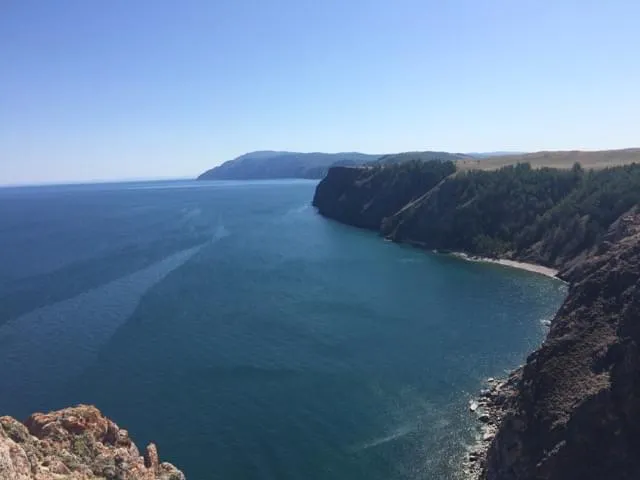
I recently took the train from Beijing China to St. Petersburg Russia on my honeymoon. Being a map scientist I was obviously thinking about maps the whole way and was able to find some nice ways to track my journey.
Data Collection Toolkit
Automation and Parsing
What felt left out was how to incorporate the geo-tagged images I took on my phone. To be able to do this I needed:
Naturally I decided to write a script to automate the whole process. My script is available in my GitHub repo img-mapping.
This Python script extracts the GPS data from each image pushes each image to an Amazon Web Services S3 bucket inserts the latitude longitude and image URL into a CSV table and then uses CartoDB's Import API to get the data in my account.
Visualization
Next I logged into my CartoDB account to create the map. I made a multilayer map with the bottom layer from the GeoJSON of the train line mentioned above the second layer the CSV I got from my MovesApp and the third layer markers representing the position where the pictures were taken. I also threw on a Torque layer for good measure to visualize our position in the time dimension.
The last step was configuring the hovers on the image layer so that the images show when their markers are inspected. Using mustache template notation you can grab data associated with the marker and have it rendered in HTML. For instance my templates were styled like this to show images:
{% highlight html %}
{% raw %}

{% endraw %}
##_END_REPLACE_ME_PRE_##
What kinds of maps can you make for your summer project? Feel free to fork my script and improve on it!
Want more to do? Check out our tutorial on Fulcrum with CartoDB for mapping mobile data. The fitness app Strava allow you to export your data as GPX which can visualized with CartoDB. If you want some courses to work through check out our Map Academy.
Happy Mapping!