Layers of Meaning from Tables of Data: Creating A Multi-layer Geoportal app on the CartoDB Platform


"How many layers does CartoDB support?" It's a question we hear often. The word "layer" has been a part of the GIS nomenclature since the times of John Snow and the geospatial community is used to thinking in terms of layers. Many of the prevailing desktop GIS software packages support this mode of thinking with "layer browsers" that have checkboxes for roads parks tax lots pipes - in short each and every type of dataset in the user's project.
Aye but there's the word: dataset! A "layer" is often really just a dataset. Nothing more nothing less. In a relational database environment like CartoDB individual datasets are stored as tables. And since PostgreSQL (and therefore CartoDB) can support thousands and thousands of tables of data the answer to "how many layers does CartoDB support?" is pretty much as many as you would like! If you need to this makes creating a "geoportal" site to all your organization's geospatial datasets no problem at all.
Given this reality you'd be forgiven for being confused by the "limit" of 4-6 layers (think tables!) in visualizations/maps made through the CartoDB Editor on our monthly plans (10 layers on Enterprise). Each CartoDB visualization/map corresponds to one set of map tiles and so these "layers" are really better described as "sublayers" that come together (with their constituent CartoCSS SQL and other parameters) to form a single tile layer. Sublayers are referenced as such in the CartoDB.js documentation and can be added with CartoDB.js' "createLayer" function and others.
Sometimes maps and visualizations with more than just a few datasets/tables/layers can be useful. Moreover sometimes you want your tables and datasets in separate tile layers or even to use multiple multi-table visualizations in your app. Having many datasets to visualize at once means you need to think carefully about your visualization choices and the user experience you're providing through your app. Making multi-table maps through the CartoDB Editor as powerful as it is will not give you or your users the fine-grained capabilities and positive user experience as building your own custom app on the CartoDB APIs and platform will once you get beyond 4-6 "sublayers".
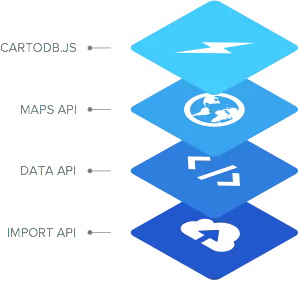
There's another good word: platform! CartoDB is not just the Editor. You have full access to all our APIs to make your own custom apps with all the control you might want when building a large geoportal site to suit tens or hundreds or even thousands of geospatial datasets. My Madrid-based colleague on our Sales Engineering team Daniel Carrión and I recently put together some demonstration geoportal sites using a custom Angular.js front-end and a crafty use of CartoDB tables and the SQL API. Unique from other multi-layer visualization techniques we've posted in the past this template gives you a scrollable list for a more enjoyable browsing experience when you've got 10+ layers. And this technique has the benefit of being able to display multiple datasets at once and toggle them each on and off independently.
You can see a demo at http://multilayer.cartodb.io/ and even use it with your own table using the URL instructions on that page. A complete example with many datasets and even multiple multi-layer visualizations I made to correspond with this blog post is here. Follow along below and make your own multi-layer mini-geoportal app in just a few minutes with our template!
Step 1: Create a "multilayer" table in your CartoDB account
We need a convenient place to store all the information related to each dataset and the viz.json or CartoCSS SQL and other parameters to create each layer in our multi-layer geoportal app. CartoDB's heart is the PostgreSQL/PostGIS database so a CartoDB table makes a convienient place to edit and store this information that our application can easily retrive over the web via the SQL API. It won't have any geospatial information but that's OK: this table will just be for the app's layer "metadata " in a way.
Create a table like Dani's or mine with columns for:
- CartoCSS
- Interactivity (if you'd like infowindows usually just
cartodb_idis needed here) - Layer name (shown in our app's checkbox selector UI)
- Whether you want this layer shown or hidden by default (each time the geoportal loads)
- SQL
- A
sql_usercolumn (if your CartoDB tables are in an organization account) - A
viz_jsoncolumn if you'd rather use the viz.json file to your layer. Note that layers with a viz.json file don't need any other information in the table as the linked file contains it all.
It may be easiest for you to "export" Dani's or my table as a CSV and import it into your own account which will give you all the required columns and just modify/enter in your own data.
Note about SQL
The order of rows in most SQL databases is undefined which means for any given database unless you use an "ORDER BY" clause in your query the rows will be returned in a random order or the database manufacturer will define an arbitrary order. With CartoDB absent an ORDER BY rows are returned from the SQL API sorted by the updated_at column. If you're just using the demo app that Dani and I created this means your layers will be listed in your selector in the order of earliest-update-first.
Step 2: Create your visualizations and add them to the table
Upload the datasets you want to visualize into their own tables and create visualizations (maps) with them using the CartoDB Editor. Or hand-code your CartoCSS and SQL if you're feeling adventurous. After you've tweaked each individual visualization to your liking you can either copy its CartoCSS SQL and other details into your "multilayer" table. You can also copy just the viz.json link from the Editor into the respective column.
An advantage of using the viz.json link is you can create visualizations with multiple "sublayers" in the Editor and view them through the geoportal app. For example I have the following visualizations with only one sublayer:
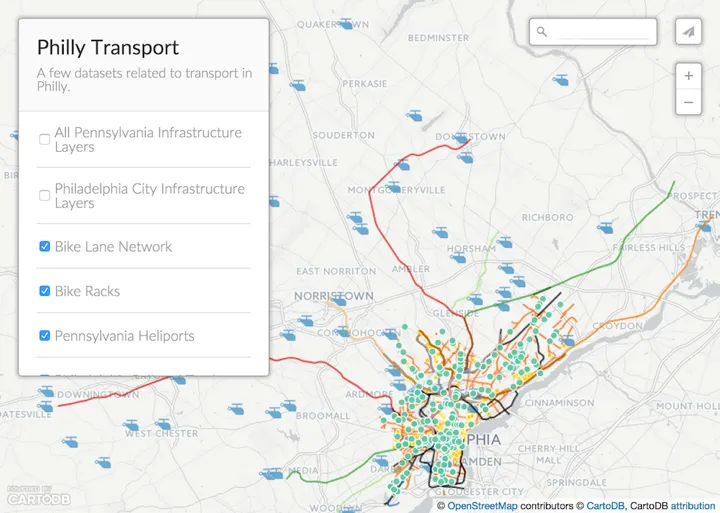
- Philly Bike Lane Network
- Philly Bike Racks
- Heliports in Pennsylvania
- All railroad tracks within Philadelphia city limits
- SEPTA's commuter Regional Rail network
- Philadelphia Streets Department's Highway maintenance districts
- SEPTA public transit Bus Shelter locations
Also I created two visualizations with multiple sublayers:
- "All Philadelphia Infrastructure" which "sandwiches together" any of the above datasets that are contained entirely within Philadelphia city limits
- "All Pennsylvania Infrastructure" which includes all the Philadelphia datasets as well as the Regional Rail and Heliports datasets that extend into other areas of Pennsylvania.
Now if you're using [the geoportal] you can check on/off "All Pennsylvania Infrastructure Layers" or "All Philadelphia Infrastructure Layers" to see these full collections of layers at a glance rather than checking them all on individually. Also note that in each layer can have its own CartoCSS - highway districts are green in the all-Pennsylvania layer but orange in the all-Philadelphia layer.
Step 3: Profit!
If you want to use the template we have at http://multilayer.cartodb.io/ you're all set! Your app URL will have a few URL parameters that are described on that main page. The Angular.js app will parse those out access your multilayer table via CartoDB's SQL API and list your visualizations with checkboxes to toggle them on and off.
If you use our hosted template however not only can we not guarantee its reliability but the map is centered near "null island" (0° latitude 0° longitude) and at a fairly high zoom. You can change this if you deploy our code yourself. The entire app is a few HTML CSS and JavaScript files so it's not hard to host and will run sweetly on your own Github Pages if you want!
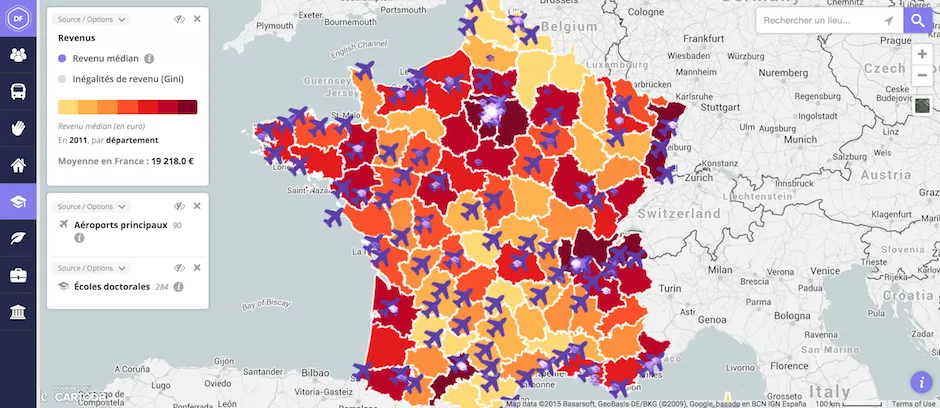
This is just a simple example of what can be accomplished visualizing multiple datasets via the CartoDB Platform. To give you an idea just recently we found a great example (shown above) at DataFrance.info using CartoDB to display dozens of layers across all of France. What multilayer visualizations will you make?
Happy Mapping!