Odyssey.js: examples in the wild


Following the release of the new Odyssey.js tool to create map based interactive stories here you have some projects that are already using it:
New York Daily News story
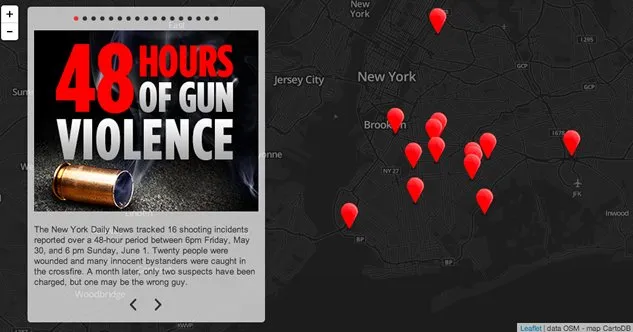
On July 9th New York Daily News published an investigation where they tracked 16 shooting incidents that occurred in a 48 hours period. They used Odyssey.js to tell the story in a different way using a map to give context to the facts related. Using an slide template the US newspaper geolocalized the reported incidents of gunfire and told the victims version.
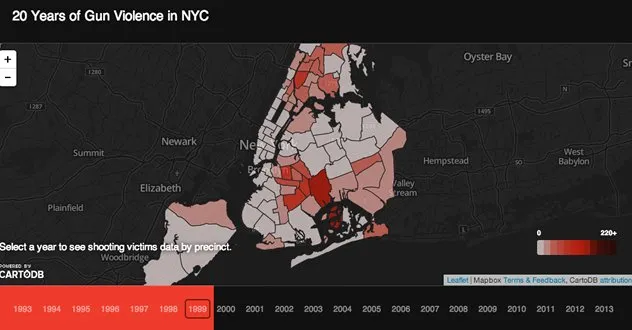
They also used a CARTO map to show in an interactive way the data of 20 years of gun violence in different parts of New York City. Through this map readers can easily see which neighborhoods are more violent than others and how that has evolved during these years.
The Voyage of the HMS Beagle
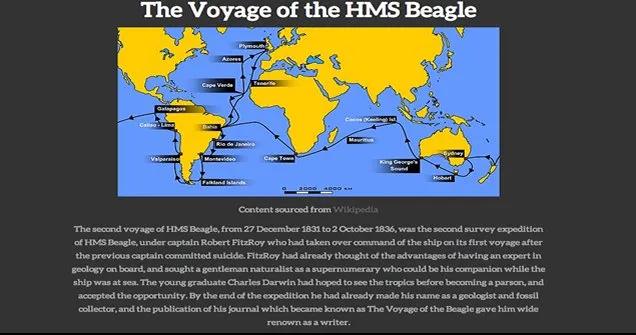
HMS Beagle ship left England for her second voyage on 27 December 1831. The ship was captained by Robert FitzRoy and carried a then young Charles Darwin. During the expedition Darwin kept a diary of his experiences and rewrote this as a book. In this Odyssey.js story you can recreate this Charles Darwin’s famous journey.
Wimbledon 2014’s Twitter map
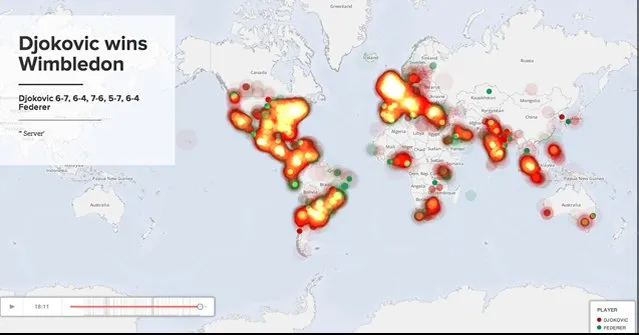
Twitter has been using CARTO maps to show how people tweet around the world during big events. This time they choose Odyssey.js to describe the Wimbledon 2014's men final and present how Roger Federer and Novak Djokovic played out on twitter.
Gull Erick during breeding season
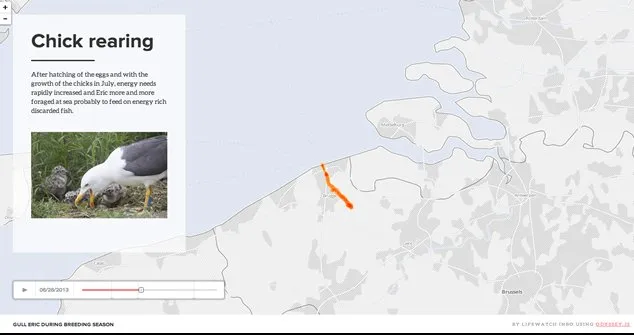
You already know Eric the Seagull. This map shows the track of Eric a Lesser Black-backed Gull in Zeebrugge Belgium while it’s incubating and after the hatching of the eggs and the growth of the chicks. To see more Eric maps take a look at >LifeWatch Inbo CARTO profile.
Virginia Beaches visualizing a Washington Post story
##_NOT_FOUND_IMAGE_## https://i.imgur.com/rY8l0wC.jpg ##_NOT_FOUND_IMAGE_##

Jonah Adkins has adapted this Washington Post piece by Jane Elizabeth a perfect example of how can things can be reimagined using Odyssey.js.
This are some of the first Odyssey.js examples that are popping up. You can go to the Odyssey.js site and start creating your own stories. if you have already created one share it with us in Twitter
Apart from Odyssey.js stories you can start creating your maps and visualizations getting a free account in CARTO and request a live demo today to find out more.