Visualizing 50 Years of Rolling Stones Concerts


The Stones passed the half-centuty mark as a band this year. An incredible achievement for an incredible band. They also happen to be one of the most prolific touring bands in the world with more than 1 300 concerts all over the world and over the last 50 years they have have traveled almost 1 000 000 Km >960 000 km actually.
As many of you know we've been working on a major update to CartoDB over the last couple of months and with it we've also developed Cartodb.js a new CartoDB Javascript library.
So when we got word that the Rolling Stones had their gold anniversary as a band this year we figured what better way to test this library visualize the Stone's career.
So how'd we go about doing this? Relatively easily. We scraped the Stones' tour data from Wikipedia and then imported it into CartoDB 2.0. After that we mixed in Reveal.js a pretty awesome library for making presentations in pure html with CartoDB.js. The result was this visualization created with literally only a few lines of code. You can fork the code and create your own story based visualization here.
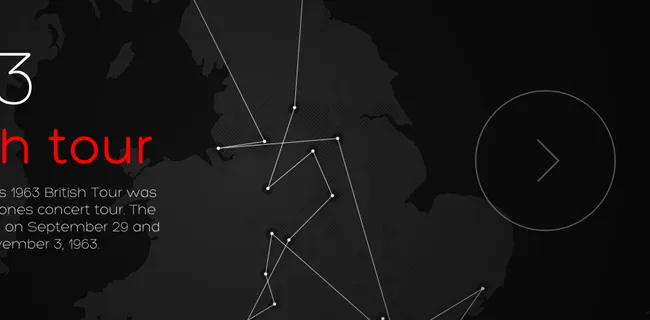
By connecting where each tour took place we not only got to see how the Stones grew in prominence globally but also the distance travelled for each tour and correlations between tours and promoting a new album.
In any case we know it's only data viz but we like it like it yes we do.