Map stories at the NYPL Labs


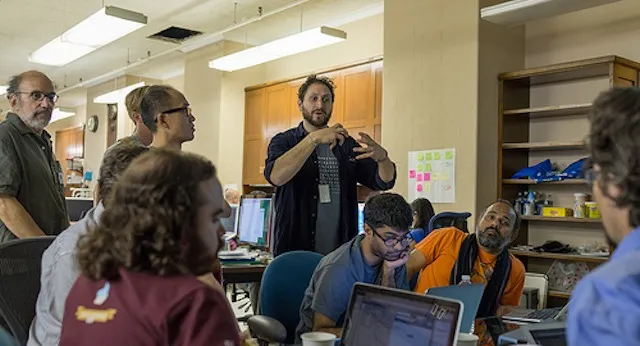
A few weeks ago we got to participate in a small hackathon hosted by the New York Public Library's Labs team. It was a really nice event built around data maps and conversations. It gave participants the opportunity to interact with some really fantastic mapper-historian-developer types. It also gave us a first-hand look at some of the Library’s APIs and datasets. In fact the NYPL just released a lot of that data through the new Digital Collections page. We think it is awesome and can’t wait to see some of the things people build and create from it.
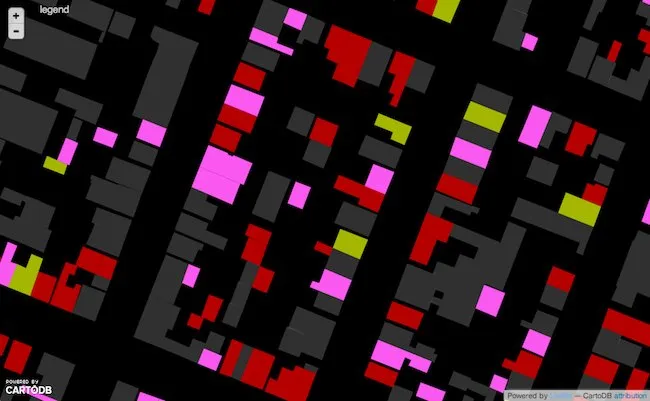
During our day at the hackathon we explored a lot of data and built a few really interesting maps. These were the types of maps that are very often used to publish and share data on the web but we also used them exploratory tools to learn from the data. CartoDB serves as an amazing platform to quickly drill into dataset and try to extract the interesting stories. We found that a fun goal of the hackathon was to try and find a story!
We have rarely seen the process of taking a dataset and finding the stories it holds described. The process is a fun at times and very challenging most of the time. So instead of telling a single story about a single map we thought it would be interesting to share the process itself as the story. We hope you find this interesting and motivating. Enjoy