3 Spatial Data Science Trends to Watch in 2018


The demand for data scientists to understand and use geospatial analysis in their process has led to new trends and innovations in the data science field.
This focus on spatial data and analysis inspired CARTO’s data and research team to host the first ever Spatial Data Science Conference at our office here in Brooklyn on Friday December 1st.

Here’s a preview of three trends that some of our speakers will be addressing:
Making sense of massive amount of GPS data
A GPS dataset for a single month can easily exceed 5 terabytes and that’s only for around 2% of the population. The sheer size of GPS datasets poses many obstacles to data scientists trying to make sense of this information. In 2018 expect to see more agile approaches and more attention given to the spatial components of this data.
SkyHook recently partnered with us to release target="_blank">OpenTIDE. OpenTIDE represents anonymous and aggregated location requests--including GPS cell towers and mobile ad software--per hour and rendered on a 100m x 100m tile (TIDE is an acronym for Tiled Device Estimation).
As a result data scientists can more precisely study user behavior and mobility in cities around the world for more accurate crowd detection public safety and cohort analyses.
The four images below show aggregated location requests from July 1 2017 in four major metropolitan areas.
Ho Chi Minh City Vietnam
Cape Town South Africa
Beijing China
Chicago Illinois
Our Spatial Data Science Conference will feature several talks on working with GPS data from Peter Lenz geospatial analyst at dstillery and Shan Jiang a Postdoctoral Associate in MIT’s Department of Urban Studies and Planning.
The emergence of spatial statistics
In 2018 expect to see more data scientists applying the spatial analogues of traditional statistics to spatial data.
Spatial statistics help data scientists extract more meaningful insights from geographical data. Whether building a machine learning model a prior in Bayesian inference identifying clusters or outliers or performing a similarity search data scientists are integrating insights extracted from spatial relations into their models alongside non-geographic attributes.
In a previous post we demonstrated a spatially-constrained clustering analysis called SKATER while creating sales territories targeting 461 of the Fortune 500 companies.
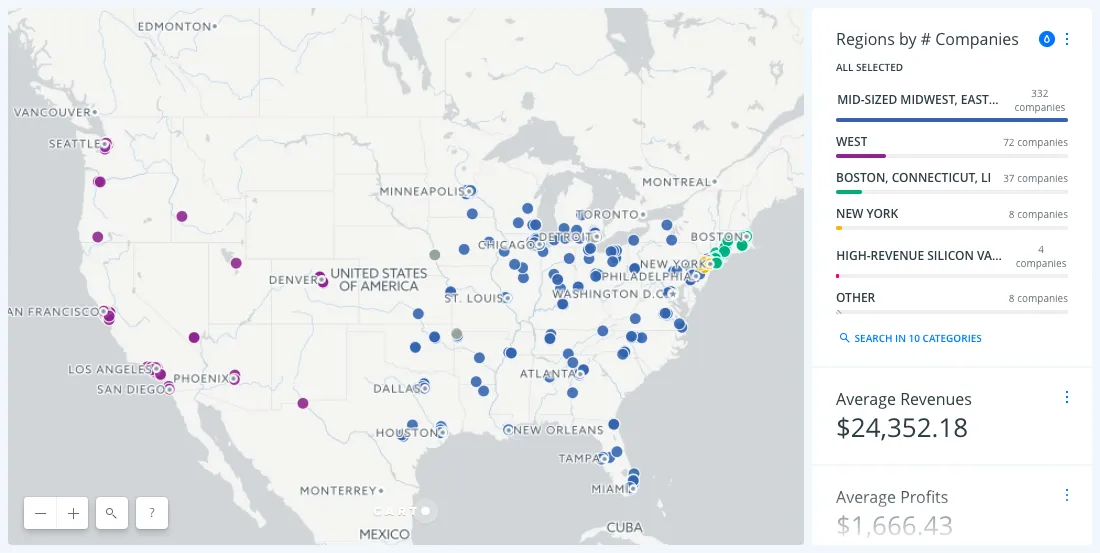
Instead of distributing accounts based on the numerical average this mode of clustering accounts for various spatial relations and uses various criteria to determine the design of a sales territory.
During our conference expect to hear more on the emergence of spatial statistics (as well as insights on emerging best practices!) from speakers including our keynote address from Dr. Seth Spielman professor of Geography at University of Colorado Boulder as well as a presentation from Levi Wolf a lecturer in Quantative Human Geography at the University of Bristol.
Spatial data science fuels route optimization
Spatial data science will continue providing answers to logistics and transportation problems like "What is the most cost-efficient route for distributing or collecting an asset given constraints?"
The answers to these questions hinge on the quality of data available. GPS data is often noisy so accurately inferring a route given a series of pings is crucial to properly tuning an optimization problem.
Route optimization will continue to expand in 2018 as more innovative processes are developed to determine how best to get from one location to the next or to reverse engineer a route given raw data.
Mapzen for example joined the World Bank’s Open Traffic initiative to optimize traffic congestion using location data. One product to come out of this collaboration is their Map-Matching service. The follow up question to "What is the most cost-efficient route?" Map-matching asks "Were our route matches any good?"
Take a look at how Map Matching "snaps" GPS-derived locations to a route segment to measure traces and drifts in order to evaluate each route’s "noise":
There will be more to hear about route optimization from conference presenters David Nesbitt Software Director at Mapzen and Daniel Merchan doctoral candidate in MIT’s Center for Transportation and Logistics.
What is Spatial Data Science? Click here to discover more.