State of the Art Styling in CARTO VL


One of the most welcomed features of modern vector renderers is the performance advantage they bring to the table. While SVG and Canvas renderers have been developed in the past it has been WebGL that has skyrocketed performance. Modern GPU architectures can easily outperform CPUs by an order of magnitude in parallel scenarios like rendering. Having to compete with a scripting language it is no surprise that WebGL and GPUs have gained the performance crown.

However while previous WebGL renderers used the GPU for the final rendering pass they didn't exploit WebGL’s full potential. Every renderer whether it is GPU based or not consists of two phases: a styling phase in which features get assigned some rendering properties (like color and point size) based on the feature properties (type price) and a draw pass in which geometries and their rendering properties are used to paint onto the final image or canvas.
Previous technologies already used WebGL for performing the drawing pass however the styling process was always delegated to slow Javascript code.
We at CARTO have unleashed the full potential behind WebGL by developing a fully GPU accelerated library for map making: CARTO VL.
CARTO VL Rendering Pipeline
Of course a fully accelerated pipeline comes with its own disadvantages. Although modern GPU architectures have been designed with the focus on giving more flexibility (see the recent trends in GPGPU) WebGL is based on OpenGL ES 2.0 a 2007 standard designed not only for desktops but for mobile devices too.
Therefore we had to be a little bit creative in the way we designed our rendering pipeline. In particular we used 2D textures as storage for feature properties (type price …) and feature rendering properties (color point size …).
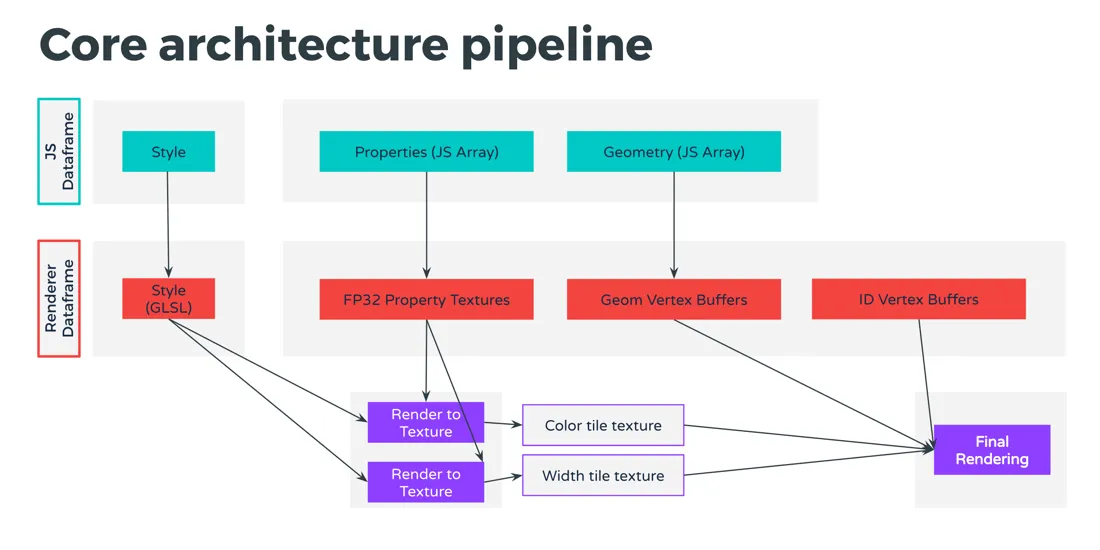
Our rendering pipeline is made up of the following components:
- JS array buffers with geometries and feature properties. These buffers are encoded from GeoJSON or from MVT tiles and they are used to push the information to WebGL.
- WebGL Vertex Buffer Object with feature geometries. Point centers and the vertices of the triangulated polygons and lines are placed here.
- WebGL FP32 textures with feature properties. Strings that act as categories are uniquely identified and transformed into unique integer IDs.
- WebGL Vertex Buffer Object with feature ID pointers to the textures to keep the connecting link between the geometry Vertex Buffer Object and its associated feature properties and rendering properties.
- JS tree that represents the styling of the visualization. This will generate the following shaders:
- WebGL Shaders with the styling information that transforms feature properties into feature rendering properties. This is CARTO VL’s secret ingredient. These dynamically generated shaders are used to generate the next textures by performing Render To Texture.
- WebGL Shaders with the final rendering pass. These are usually fixed shaders except when rendering images or translating the geometries.
- WebGL Textures with feature rendering properties. These are used by the final rendering pass.
Benefits
This pipeline allows us to restyle features by changing the styling shaders and performing the necessary WebGL drawing calls removing the need to do expensive CPU to GPU communication and the need to style the features on JS.
Having super-fast restyling is good for general performance but it is critical for making temporal maps in which the restyling must be done at each frame without stopping. This pipeline allows the display of a large number of animated features at 60 frames per second.
Interested in getting started with CARTO VL today?Visit our Developer Center!
Moreover the flexibility of our pipeline allows support for all geometry types (points lines and polygons) and enables the combination of temporal filtering and all other CARTO VL expressions. Making complex filters like "animate buildings by the year they were built but don't show buildings with less than two floors" possible.
color: ramp(linear($yearbuilt 1900 2018) prism)
filter: $numfloors > 2 and animation(linear($yearbuilt 1900 2018)  20  fade(0.5  hold))
Special thanks to Mamata Akella CARTO's Head of Cartography for her support in the creation of the maps in this post.