A trip back in time to 1940s in New York City


In 1943, four NYC newspapers published a local market analysis aimed at advertisers. The document was based on the 1940 Census and included hundreds of photos & color-coded maps portraying the geographic patterns of monthly rent levels across the city. It also featured statistics and short narratives about the neighborhoods.
The "New York Market Analysis" document was largely forgotten since its publication. Seventy years later, the Center for Urban Research at the CUNY Graduate Center is making the 1943 profiles available in a new project called Welcome to 1940s New York. The site provides "an amazing window into New York's neighborhoods of that era".
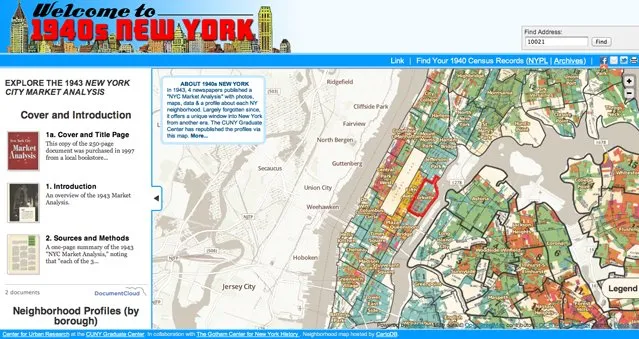
The website displays in an interactive map all the info of the 116 neighborhoods covered in the document. The neighborhood map is hosted by CartoDB. DocumentCloud provides easy access to the entire 1943 document. Map navigation is provided through Leaflet.js and the basemap is from MapBox.
There's a detailed overview of how the 1940 Census statistics compares with the city of today at the Center for Urban research website. Steven Romalewski, from CUNY has also written a post at his Spatiality blog that highlights the main aspects of the project.
The site is "still very much a work in progress" he says, but it already offers a rich picture of life in New York more than seventy years ago.
"With the maps, you can see for yourself how closely or not the patterns match life in our city today", writes Romalewski about the original 1943 document - which he found for the first time in 1997, when he was a graduated student from Columbia University.
This is a sample from the original file:
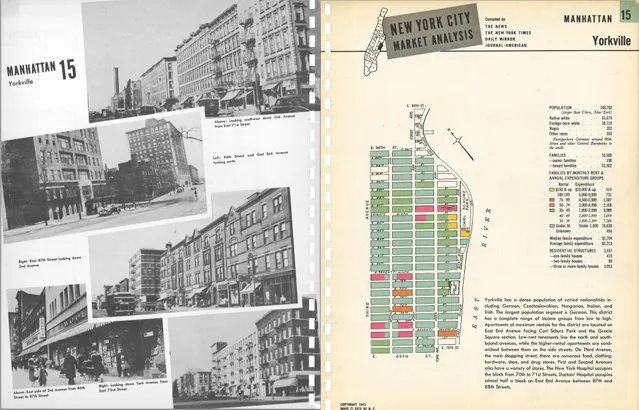
"Take a moment to appreciate the cartographic craftsmanship involved in color coding each block based on Census data. No desktop computers or Google Maps back then!", adds Romalewski.
The New York Times, one of the newspapers that contributed to the original document, has published a piece on the site along a photo gallery comparing the statistics and photographs from five sample neighborhoods as they appeared in 1940 and today.
"A time when Manhattan rent was just 30$", says The Atlantic. "Step back in time to 1940s New York", says Curbed.