Migrating spatial analytics from PostgreSQL to Snowflake


Few enterprises can ignore the ever-growing shift towards migrating data and analytics architectures from PostgreSQL to Snowflake. Cloud data warehouses offer plenty of benefits over traditional database approaches for teams looking for performant location-based analysis at scale.
For some time now, PostgreSQL has been a popular and well-respected relational database system, with thousands of organizations hard-wiring this software into their enterprise tech stacks to carry out spatial analytics. With the PostGIS extension for PostgreSQL, users are able to query geographic objects using SQL, manage spatial data types and run advanced spatial analytics.
As cloud-based architectures gain popularity, limitations of traditional database approaches for spatial analytics are becoming clearer. In this post, we will discuss some of these limitations and provide an easy-to-follow guide to migrating PostgreSQL spatial workflows to, Snowflake, using CARTO.
With a rapidly growing user base, Snowflake provides a unified platform that powers the Data Cloud. It is uniquely designed to connect businesses globally, across any type or scale of data and many different workloads, whilst unlocking seamless data collaboration. Snowflake brings performance, flexibility, and scalability so users can load, integrate, analyze, and share data securely.
Limitations with Traditional Database Infrastructures
Lack of separation between Compute & and Storage
Traditionally, databases such as PostgreSQL run on standard compute resources with data storage (i.e. disk storage) and compute (i.e. CPUs) combined in the same machine. With the ever-increasing size of datasets and the demand for more responsive analytics, a performant and scalable infrastructure is required which can only be served by cloud computing and data warehousing.
Data warehouses separate storage and compute resources, they permit the storage of large volumes of data, and allow you to query just the data you need for your analysis. When running queries you only use the compute resources for the duration of these queries. Snowflake provides this flexibility so you can set the warehouse resource size, providing even more granular control over the compute resources.
By running in parallel, you only use the data you need for each query, while the rest of the data remains in storage until required. This parallel processing allows for rapid querying and unmatched levels of performance.
Scaling Complexity
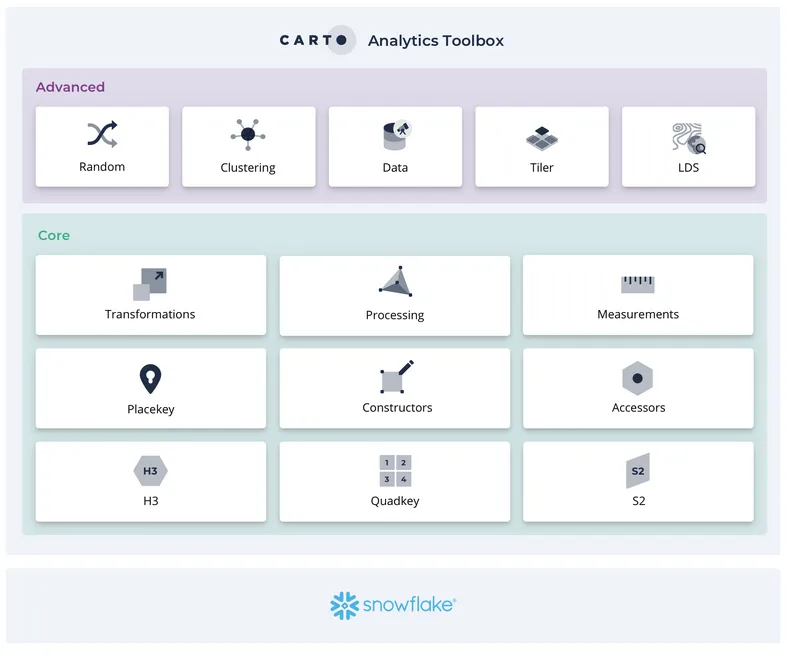
Geospatial support has been increasing over the years for the most popular data warehouses, and Snowflake has been scaling up its support for the geometry data types and spatial functions. Combined with functions from the CARTO Analytics Toolbox, users can now access a complete and modern geospatial data stack natively in the Snowflake cloud.
For users handling large spatial datasets in traditional databases such as PostgreSQL, there is an added layer of complexity. This is a result of:
- Complexity of the geometry itself
- Large number of points (millions and billions)
- Varied spatial support between data types (i.e. block groups and zip codes)
- Complex spatial analysis at scale (i.e. massive spatial joins)
- Joining to other large scale non-spatial datasets
Unlike PostgreSQL, cloud data warehouses provide a suitable solution to this due to their serverless architectures. Now large geospatial data can be accessed alongside the massive non-spatial datasets already available within the organization, all hosted in the cloud.
Sharing Limitations
As the processing and sharing of spatial data and insights normally extends beyond specialist geospatial teams to include more users across the enterprise some of the limitations with traditional databases can result in operational inefficiencies that are costly in terms of time and effort. Migrating data between resources takes time duplicating the maintenance investment for two or more separate data systems.
You can learn more about the benefits of data warehouse for geospatial analysis here.
Access the ultimate guide to navigating the new geospatial landscape. Download the free report: Modernizing the Geospatial Analysis Stack today.
Moving Geospatial to the Cloud
Snowflake, like other similar cloud data warehouses, provides unmatched levels of scalability, performance and security. With a “single source” of data truth hosted in the cloud ETL processes are simplified, and as we all know, cloud storage and computation cost is a lot lower than traditional server-based infrastructures. Also, cloud facilitates data sharing across the organization, opening up spatial insights to a wider user base through well-known tools such as Spatial SQL.
Although the spatial functionalities of PostGIS are extremely rich, the current support for geospatial analytics on Snowflake covers the most common workloads and our own Analytics Toolbox for Snowflake unlocks more than 70 User Defined Functions and routines giving data engineers, analysts and data scientists the advanced analytical capabilities they need and at almost limitless scale.
So, how should you decide which system makes the most sense for your use case? Below is a guide that compares both systems. We will rate each section on a scale of 1 to 5, with 5 being the best.
| PostGIS | Snowflake | |
|---|---|---|
| Query Scalability | 🐘🐘 Resources scale linearly based on the CPU allocated to the database. | ❄❄❄❄❄ Scales based on user needs. |
| Data Scalability | 🐘🐘🐘 Can store large scale data but tied to the database resources and must be in memory. | ❄❄❄❄❄ Storage is separate and is low cost only accessed at query runtime. |
| Spatial Analysis Functions | 🐘🐘🐘🐘🐘 Complete set of spatial analysis functions (spatial relationships clustering etc.) | ❄❄❄❄❄ Complete set of spatial analysis functions when combined with the CARTO Analytics Toolbox (spatial relationships clustering etc.) |
| Tiling | 🐘🐘🐘 Tiling can be supported by setting up a separate server for a tiling service (such as pg_tileserv). | ❄❄❄❄❄ Dynamic tiling and stored tiles in Snowflake using the CARTO Analytics Toolbox |
| Geometry Functions | 🐘🐘🐘🐘🐘 Most complete set of geometry support functions including geometry manipulation. | ❄❄❄ Functions mostly focused on preparing data . |
| Spatial Indexing | 🐘🐘 External libraries are supported for H3 and other spatial indexes. | ❄❄❄❄❄ H3 S2 Quadbin and GeoHash support using the open source CARTO Analytics Toolbox. |
| Geometry Indexing | 🐘🐘🐘🐘🐘 Multiple indexing options. | ❄❄ Leverage Search Optimization Service. |
| Machine Learning | 🐘 Basic spatial clustering support (DBScan KMeans). | ❄❄ Build models and deploy in Snowpark with Python or Java. |
| 3D Data | 🐘🐘🐘🐘🐘 Full 3D geometry support. | No 3D geometry support. |
| User Community | 🐘🐘🐘🐘🐘 Strong community support. | ❄❄❄❄❄ Strong community support. |
| Security | Varies based on the environment set up. | ❄❄❄❄ Full set of enterprise security features built in. |
| Supporting ETL Tools | 🐘🐘🐘 Tools to import files transform using GDAL via extensions and more. | ❄❄❄ Tools to import and transform like SnowSQL and more. |
| Spatial Statistic Functions | 🐘🐘 Limited mainly to clustering. | ❄❄❄❄ Supported spatial models via the CARTO Analytics Toolbox. |
A step-by-step guide to migrating from PostGIS to Snowflake
In this section, we will outline the key steps required to migrate your PostgreSQL spatial data infrastructure to Snowflake.
Step 1 : Setup your spatial infrastructure in Snowflake
As a first step, we need to create a Snowflake account in your chosen cloud environment, if you don’t have one already. You should decide on the pricing option that best fits your organizations’ needs.
There are two different methods to import your data into Snowflake. For files under 512 MB you can use the CARTO Workspace to connect to your Snowflake instance and directly import your files using our drag-and-drop feature once they have been converted from PostGIS. The second step is to import CSV files into Snowflake and transform the geometry column from GeoJSON to a proper geometry for files larger than 512 MB.
To sign up for CARTO, go to, and create a CARTO account. We offer a free 14-day trial or you can sign up to one of our enterprise plans by contacting the CARTO team.
Once you have logged into the CARTO Workspace, you can create a Snowflake connection. This is a relatively easy process just enter your credentials and your connection will be established.
Step 2 : Import your data from PostgreSQL
The most effective way to prepare your data to move from a PostgreSQL database into the Snowflake environment is by using the open source GDAL translator library.
To do this, we’ll use a command line tool called ogr2ogr (from the GDAL library) to convert a table from PostgreSQL into a GeoJSON format.
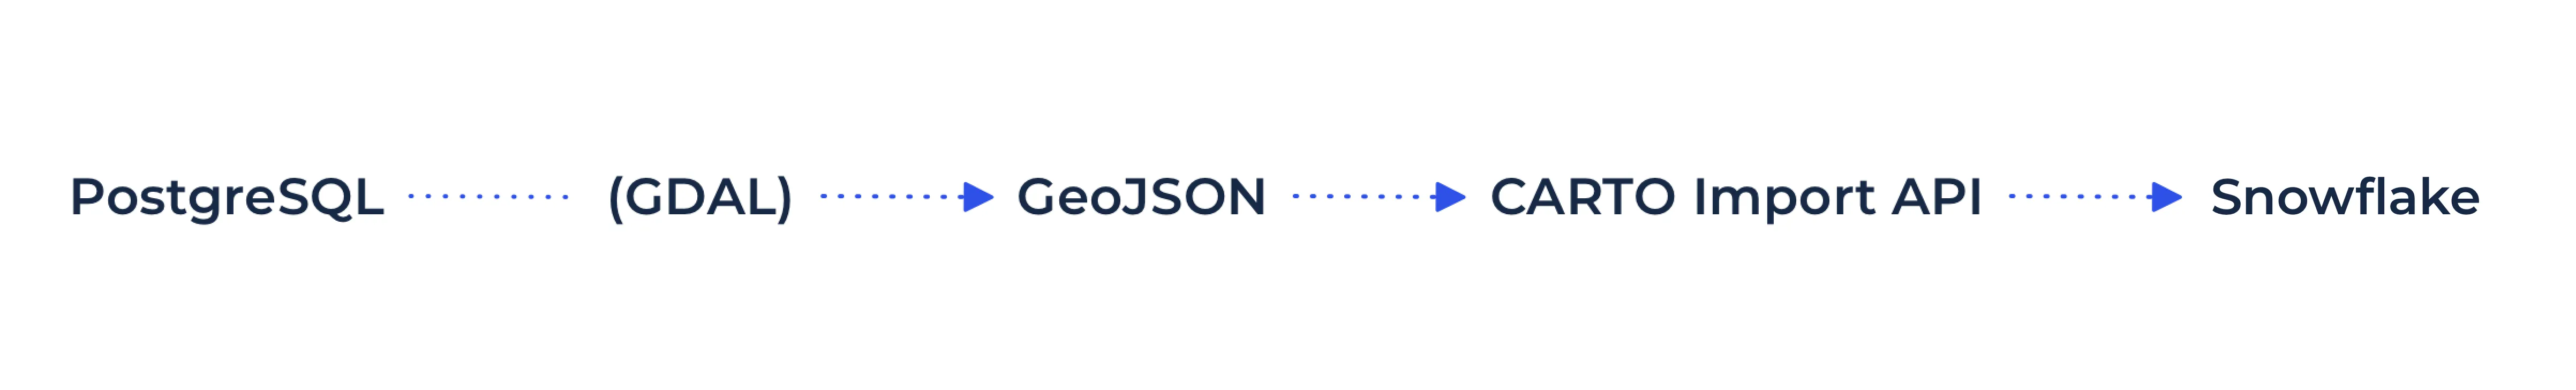
The first step is to run the command line to export your PostgreSQL table into a GeoJSON file, for more information on how to do this visit:
Let’s focus on a typical spatial use case. In the following example, we are going to export a geographic table that contains data on the wildfire boundaries in the state of California (US) to a GeoJSON file.
ogr2ogr \-f GeoJSON ws_wildfire_perimeters.geojson \PG:"host='YOURHOST' dbname='carto_dev_data' user='USERNAME' password='XXX" "ws_wildfire_perimeters"
Once we have our GeoJSON formatted file with the wildfire boundaries, we can import this data table into Snowflake using the interface in our Data Explorer. Note that the CARTO Import API has a limit of 512MB if you need to import a larger file you will need to use the standard Snowflake methods for importing. See here for more information on how to handle larger datasets or check out this tutorial for more details.
Importing data tables into Snowflake with CARTO's UI.
You can also view the same data import by accessing it through the Snowflake console.
Step 3: Accelerate your queries in Snowflake
By using the Search Optimization Service
An important step to improve your geospatial query performance in Snowflake is by using the Search Optimization Service. The search optimization service can improve the performance of queries with predicates that use geospatial functions with GEOGRAPHY objects through a fast in-memory analysis service. The Search Optimization Service lets you analyze data stored in Snowflake while providing compute cost savings.
In order to make the most of this feature, it needs to be enabled in your Snowflake account. We have included an example of how this can be activated through the Snowflake console.
GRANT ADD SEARCH OPTIMIZATION ON SCHEMA <schema_name> TO ROLE <role>;
Additionally, data tables need to be ordered in a specific way taking into account the coordinates of each geometry.
-- Order Table
CREATE OR REPLACE TABLE "BLOG"."BLOG"."WS_WILDFIRE_PERIMETERS"
AS SELECT * FROM "BLOG"."BLOG"."WS_WILDFIRE_PERIMETERS_OPT" ORDER BY ST_XMIN(GEOM)  ST_YMIN(GEOM);
-- Setup Search Optimization Service
ALTER TABLE  "BLOG"."BLOG"."WS_WILDFIRE_PERIMETERS_OPT" add search optimization;
For more information about this optimization service, take a look at Snowflake’s documentation.
By using spatial indexes
A second approach is to use Spatial Indexes, or global discrete grid systems to effectively turn your geometric data into strings or numbers, rather than a geometry type. There are several different Spatial Indexes available, all of which are accessible using the open source tools in the CARTO Analytics Toolbox for Snowflake but we generally opt for H3 and Quadbin Spatial Indexes. You can read some of the benefits of these approaches for spatial analysis in this free ebook!
Our documentation provides more details on how to use these functions and install the CARTO Analytics Toolbox in your Snowflake instance.
To tackle the most common use case of visualizing massive amounts of point data is by adding a new column to your dataset and choosing an H3 index at an appropriate resolution level. If for example we have a global data source and don’t need to zoom in beyond the metro level somewhere between zoom levels 6 and 8 would be a good fit. Otherwise 9 and below will work for more granular data.
There are some major advantages of using a these indexing approaches for spatial analytics:
- Data storage - strings and integers are much smaller to store than geometries, usually 50% less for points, and far more for other geometries
- Automatic aggregation - you can query data without aggregation in CARTO and the map visualization will automatically tile and aggregate your data
- Visual approachability - generally it is far easier to visualize hexagons on a map than multiple points stacked on top of each other
- Query time - Snowflake provides amazing performance for integers and strings so query speed can be vastly improved
Here is an example of how H3 can be used in Snowflake.
First create a new column in your table:
ALTER TABLE "DATABASE"."DEV"."TABLE"
ADD COLUMN h3 STRING
Next, let’s set this new column using our point geometry for wildfire locations.
UPDATE "DATABASE"."DEV"."TABLE"
SET h3 = carto.H3_FROMGEOGPOINT(geom  9);
We can now query and view our results right from CARTO by only querying the H3 cell:
SELECT h3 FROM "DATABASE"."DEV"."TABLE"
✅ Be sure to change the geometry type from geometry to H3.
Step 4: Sharing data
With data hosted in the cloud, a powerful feature of Snowflake (which is a practical limitation of PostgreSQL) is how easy it is to grant access to your data to other users outside of your department or even with other organizations.
To be able to grant access to your data to an external organization in PostgreSQL, you usually have to deal with your IT Infrastructure team to open a firewall create new users in the database, generate security certificates, etc. As a result in most cases, you’ll end up sharing the data as CSV files or developing a custom ETL project to duplicate and move the data ultimately creating two (or more!) sources of the data. This adds complexity and expense not to mention some of the inherent risks of managing data in this way.
The process is much simpler with Snowflake. You can easily grant access to datasets, tables or views using the Snowflake console or by using simple SQL.
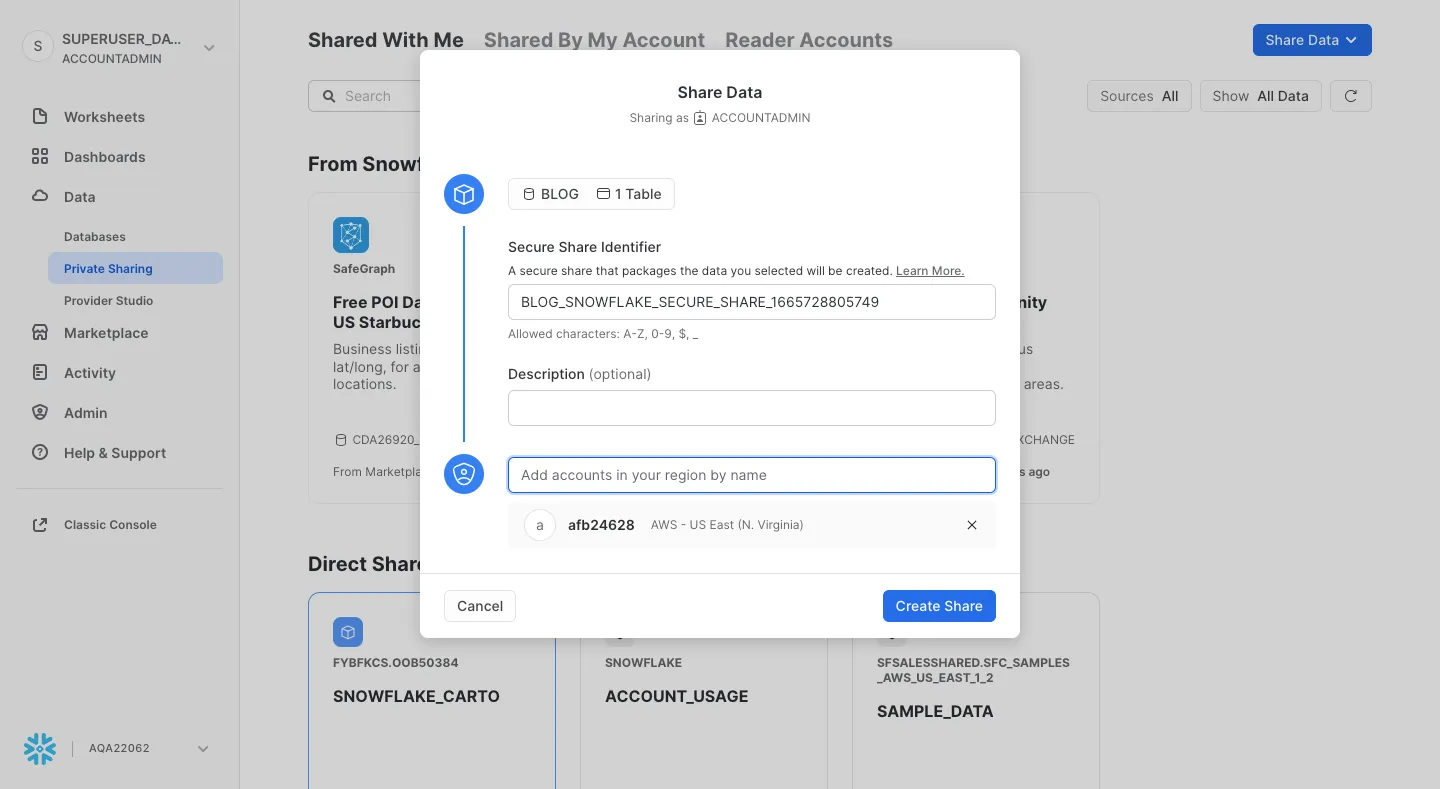
In the following example, we outline the simple steps to share a table with other accounts through the new Snowflake Web Interface.
From the navigation menu select Data » Private Sharing and share your data with other accounts using the account locator.
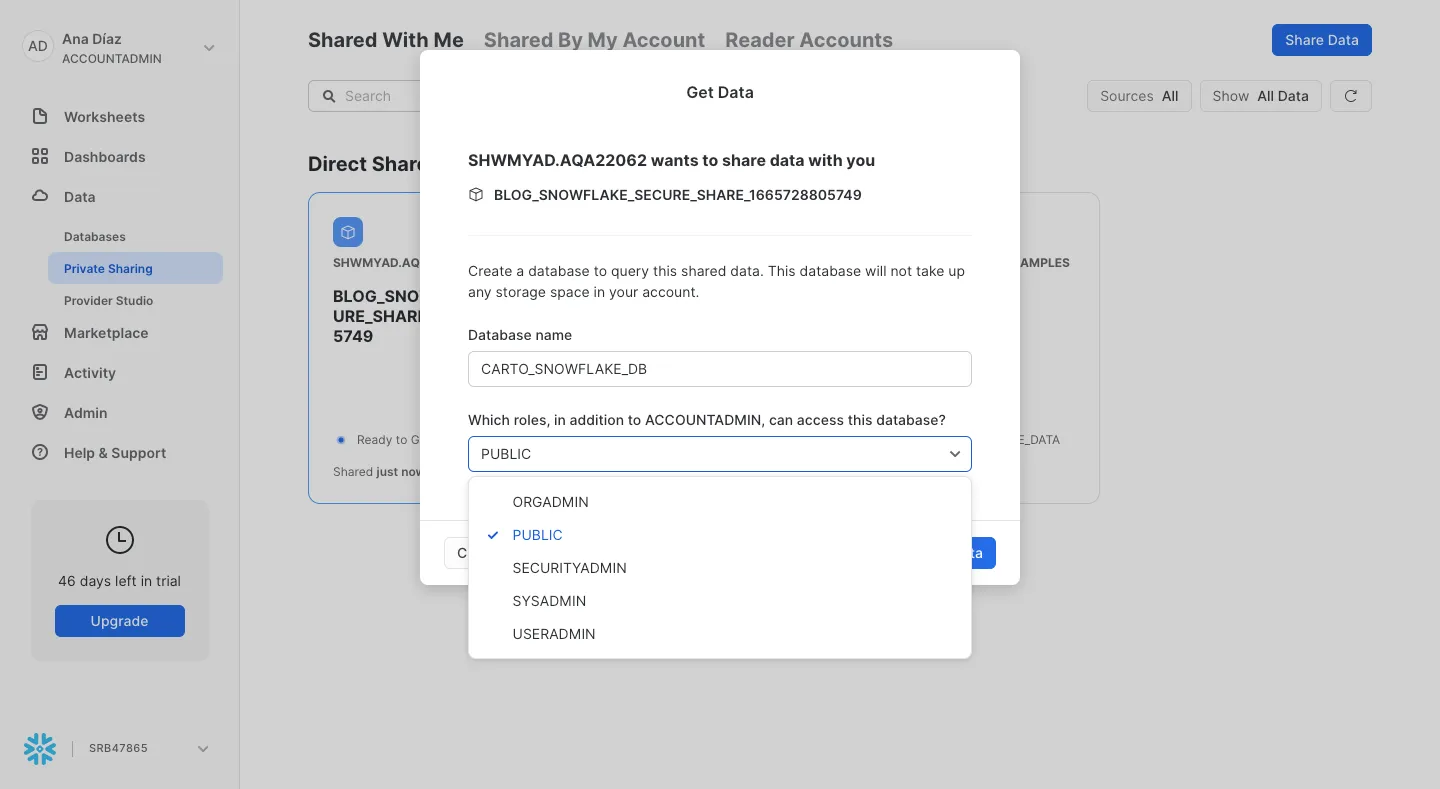
From the navigation menu, select Data » Private Sharing and get the data shared with you.
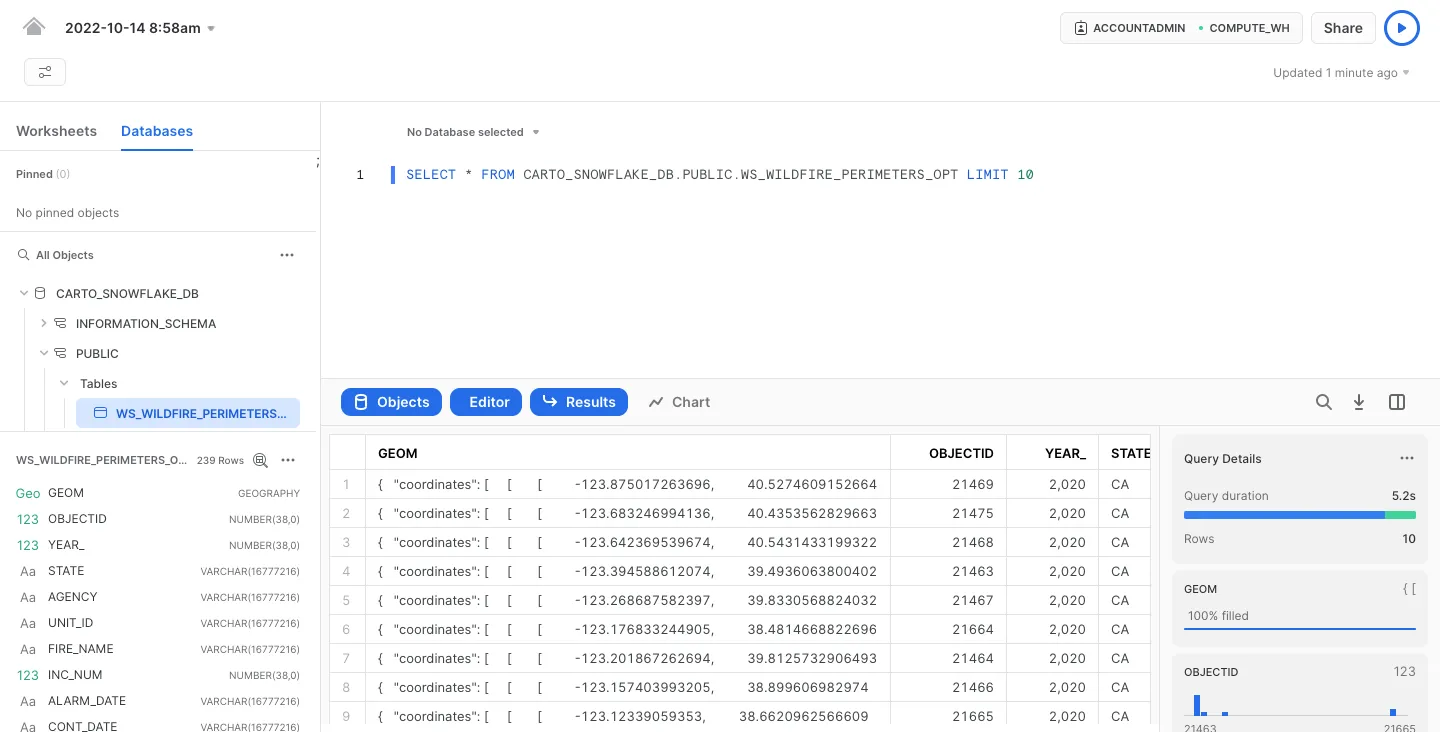
Create a new worksheet and you can begin executing queries with your shared data.
You can also easily grant access to your data in Snowflake using SQL.
CREATE SHARE CARTO_SNOWFLAKE_DB;
GRANT USAGE on DATABASE BLOG to share CARTO_SNOWFLAKE_DB;
GRANT USAGE on SCHEMA BLOG.public to share CARTO_SNOWFLAKE_DB;
GRANT SELECT on TABLE BLOG.public.WS_WILDFIRE_PERIMETERS_OPT to share CARTO_SNOWFLAKE_DB
ALTER SHARE CARTO_SNOWFLAKE_DB ADD ACCOUNT = 'fab67018';
For more information on private sharing in Snowflake, check out this link: https://docs.snowflake.com/en/user-guide/ui-snowsight-private-sharing.html.
Step 5: Enrichment spatial analysis and visualization in CARTO
Once we have imported our data to the folder under the Snowflake connection and optimized it, we can now start to run some powerful spatial processing and analyses such as enriching our dataset with 3rd party data variables.
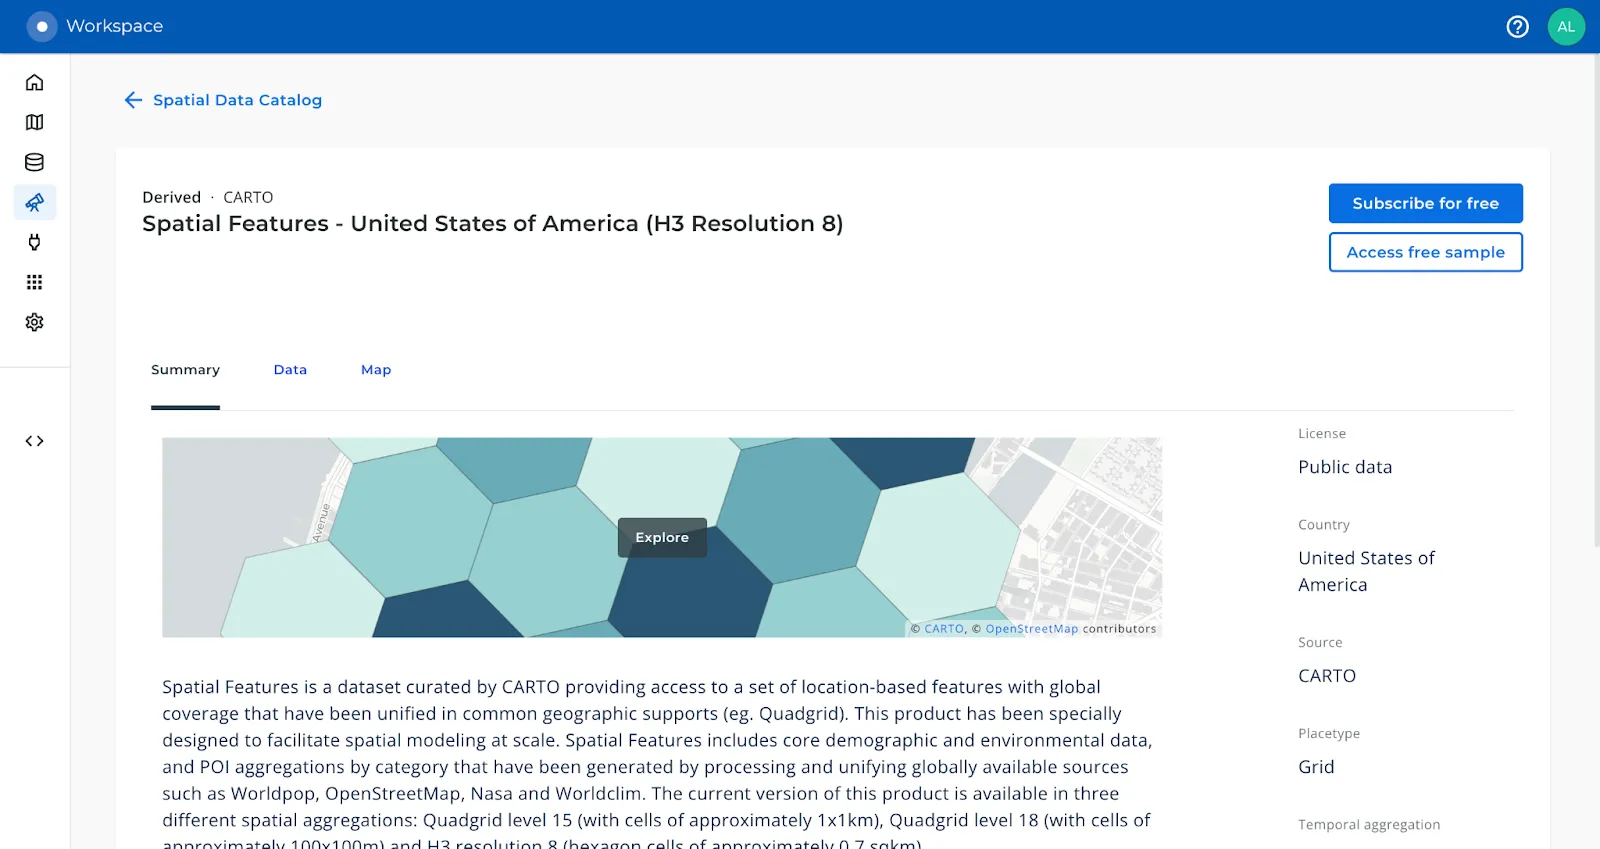
The first step is to move within the CARTO Workspace to the Data Observatory section to access the Spatial Data Catalog. This is a curated catalog of more than 11 000 public and premium spatial datasets you can use to enrich your spatial analysis. For this example we are going to enrich our dataset with some variables from the CARTO Spatial Features dataset for the US aggregated in a H3 grid of resolution 8. To do this, we first need to subscribe to this dataset from the Spatial Data Catalog using the CARTO interface.
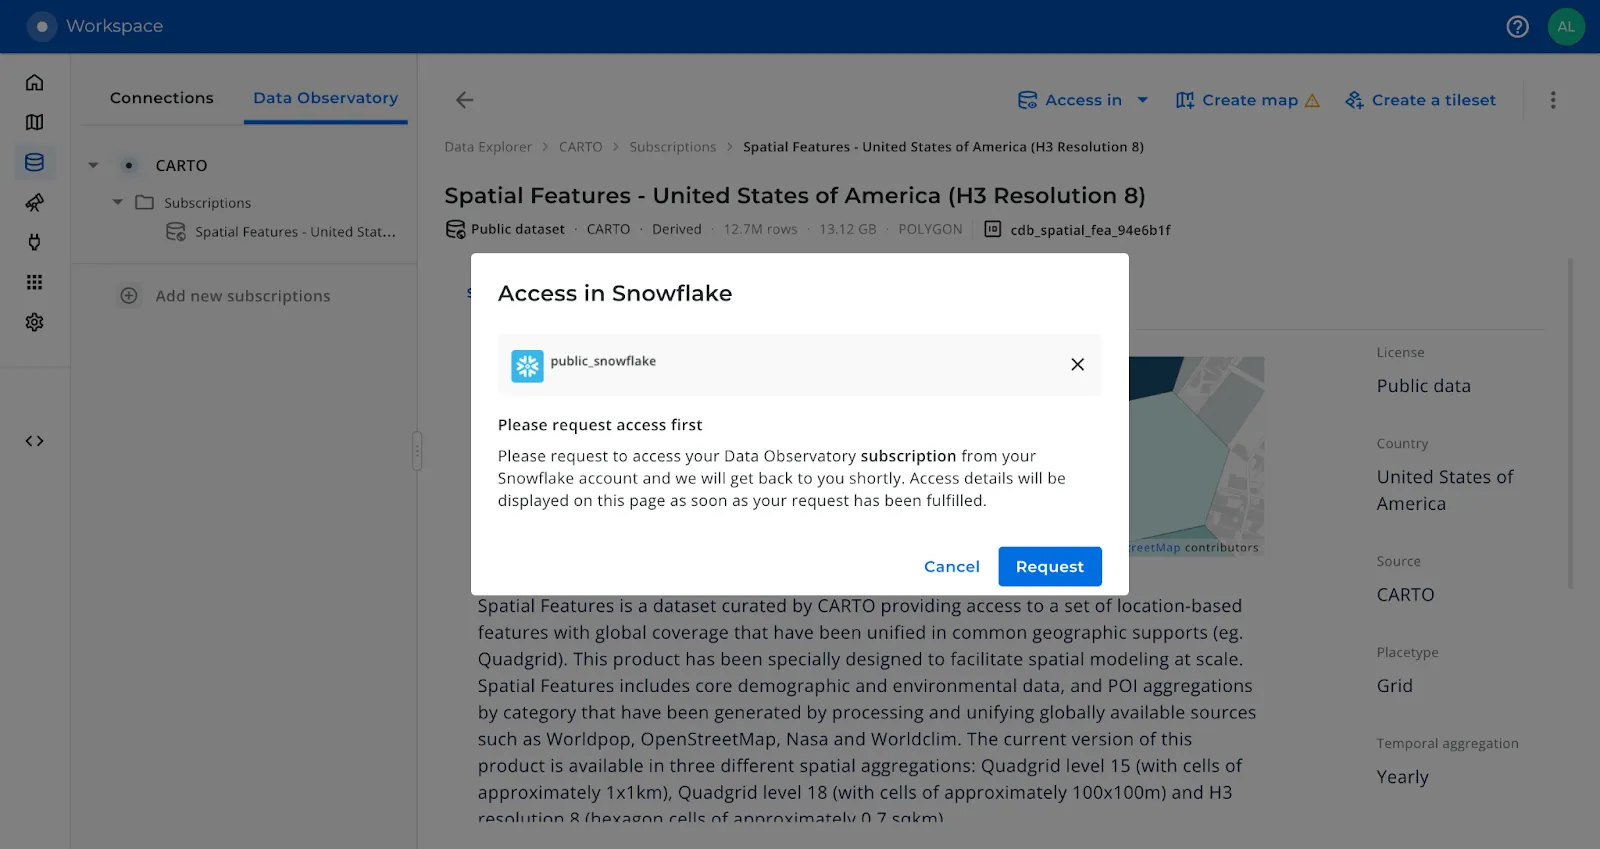
In order for you to access any of your Data Observatory subscriptions in Snowflake, our team needs to manually provision the data in a database within your Snowflake account. Go to the “Access In > Snowflake” for your Data Observatory subscriptions and place a request so our engineering team kicks off the provisioning process.
For detailed information on how to perform data enrichment using Data Observatory data and the Analytics Toolbox from your Snowflake console, take a look at our documentation.Once subscribed to the dataset, we can start the simple data enrichment process using the CARTO interface. You can either use CARTO Workflows for a low-code approach, or follow the steps below.

This same enrichment process can be run directly from the Snowflake console using the DATAOBS_ENRICH_POLYGONS procedure of the CARTO Analytics Toolbox:
CALL carto.DATAOBS_ENRICH_POLYGONS(
    'BLOG.PUBLIC.WS_WILDFIRE_PERIMETERS_OPT' 'GEOM'
     ARRAY_CONSTRUCT(
      OBJECT_CONSTRUCT('variable'  'population_f5b8d177'  'aggregation'  'SUM')
      OBJECT_CONSTRUCT('variable'  'elevation_c921552a'  'aggregation'  'AVG')
     )
     NULL
     TO_ARRAY('BLOG.PUBLIC.WS_WILDFIRE_PERIMETERS_OPT_enriched_query')
     'BLOG.CARTO'
);
Note: To enrich the table, we can use any variable we need for our analysis. In this particular scenario, we are using variables about population and elevation so we can generate insights on the relationship between elevation with wildfires, and how many people are in the affected area in the state of California (US).
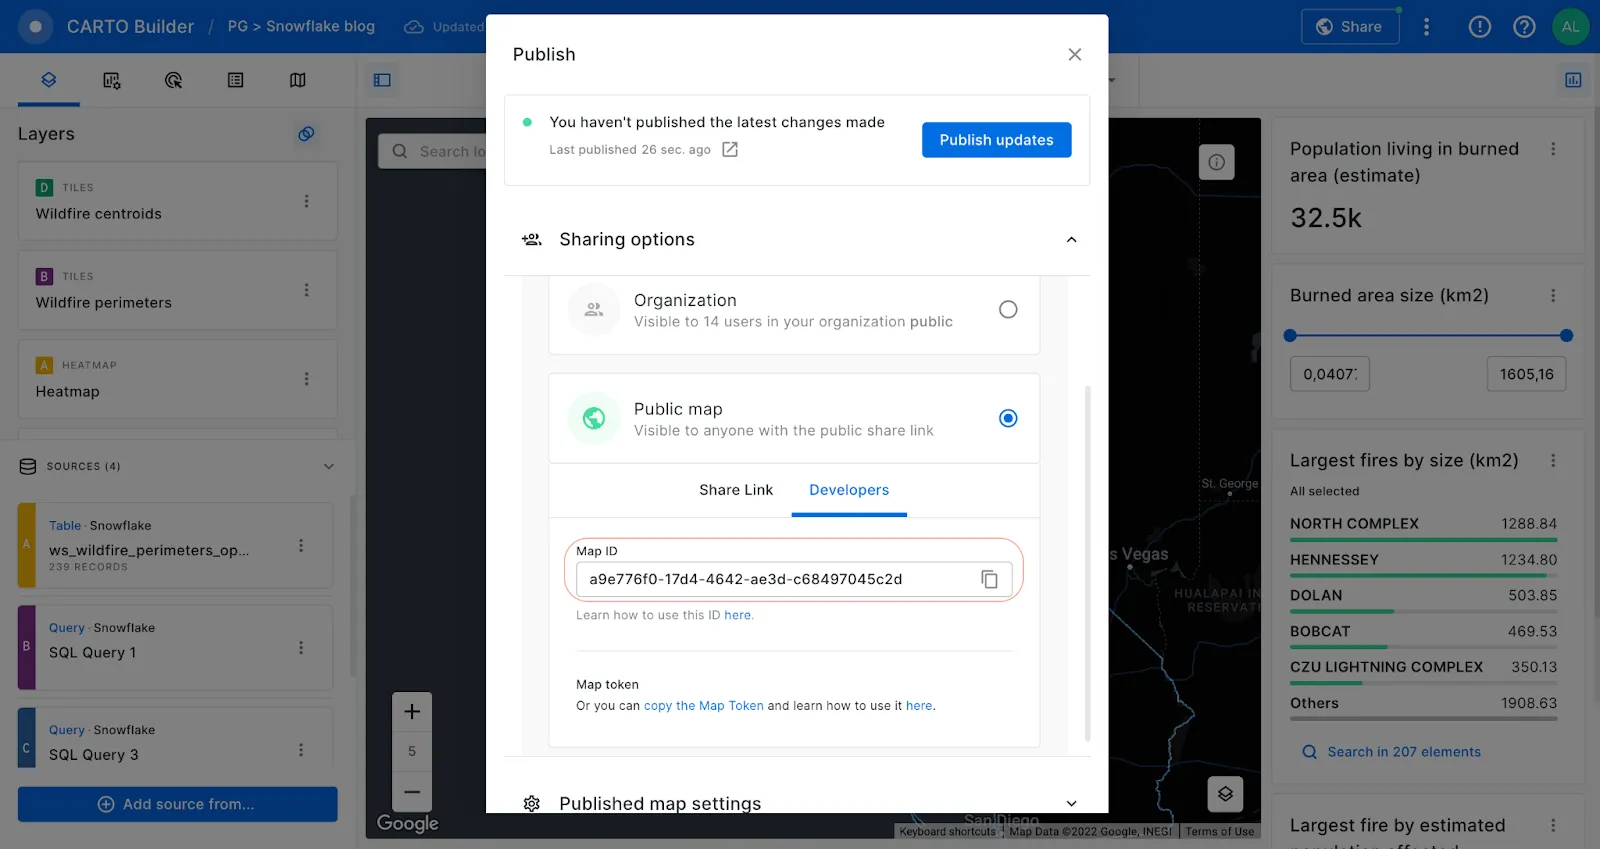
Once we have enriched our table, we can start creating an interactive map visualization in Builder. Builder offers advanced map making and publishing features alongside powerful point-and-click spatial analysis. Using Builder, we can analyze our data, add map features, styling, widgets, tooltips and easily share the results of our analysis throughout our organization, or create publicly accessible map visualizations.
Furthermore, by sharing the map publicly we can easily use the generated Map ID to incorporate the visualization into a spatial app developed using deck.gl. With an html template like the one shown in this example from our CARTO documentation, we just need to change the code line and input our Map ID.
In the html template we are using a fetchmap function to extract the properties of the map. Finally, to visualize your map simply, you just need to insert the generated html template in the codepen site.
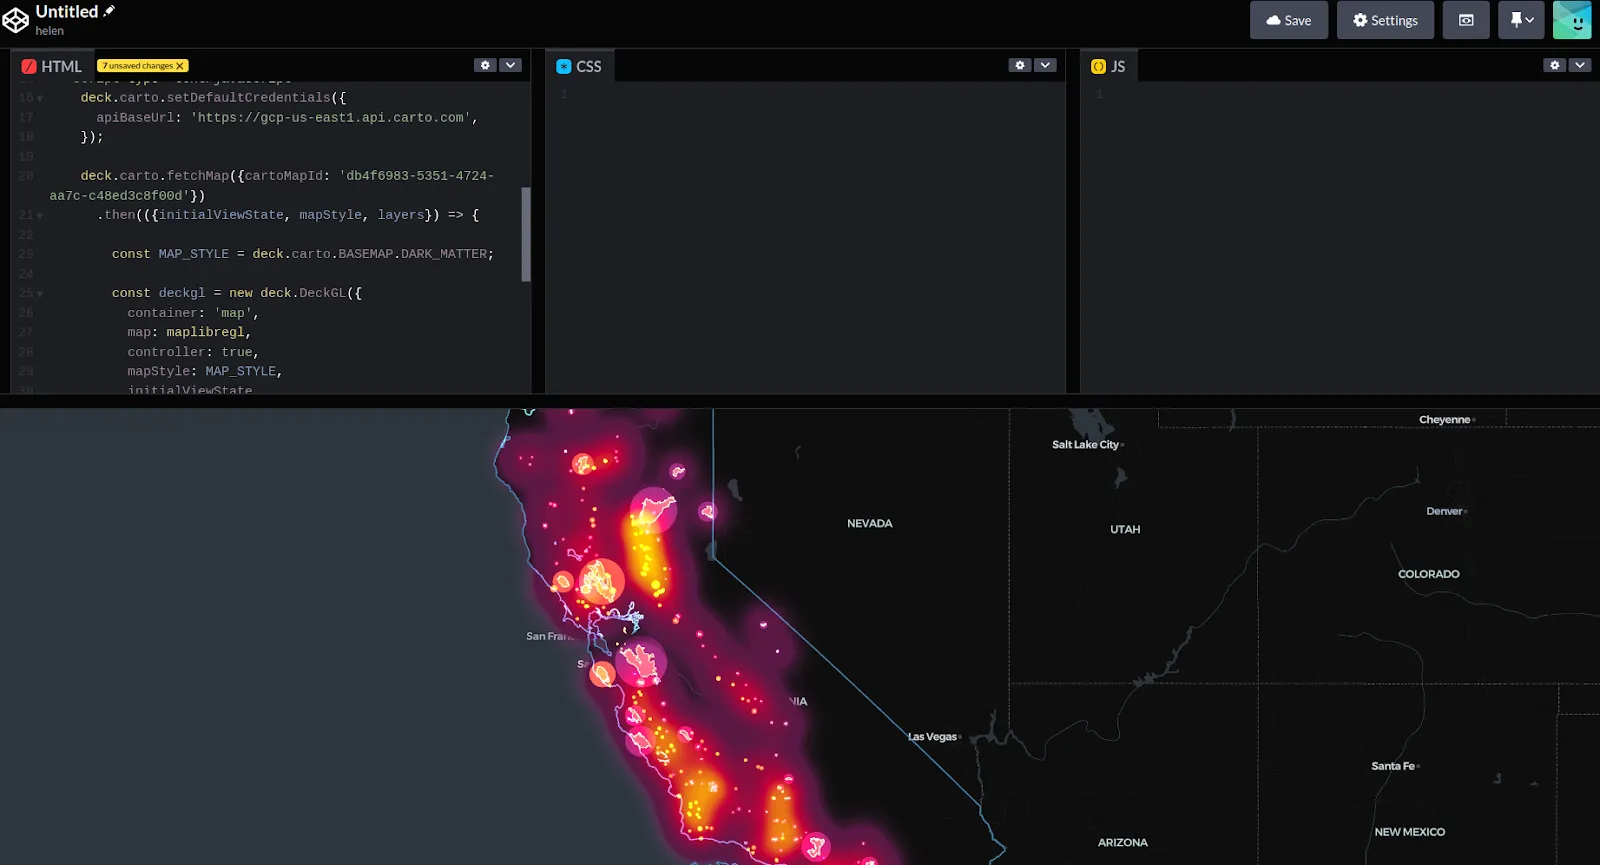
Code line of the Id map to change in the html template (Visualization in Codepen)
So, following these simple steps we have outlined how geospatial workflows can be easily migrated from PostgreSQL to a cloud data warehouse platform such as Snowflake. Native support for geospatial in Snowflake, and the CARTO Spatial Extension bring a wealth of spatial functionality, with the added cloud benefits of security scalability, and cost effectiveness.
If you’d like to understand more about migrating your PostgreSQL spatial stack to the cloud feel free to reach out to our experts. We’d love to hear from you!