Why use Data Warehouses for Geospatial Analysis


Geospatial data is increasing in scale and magnitude, yet traditional infrastructure has not caught up to demand for scaled GIS and geospatial analysis.
This shift is impacting all roles and user types in geospatial, and outside the traditional GIS roles.
Data warehouses have helped to solve this to provide a scalable, serverless (no need to scale or change underlying compute resources like CPUs or Storage) solution for the modern data stack, and has recently started to expand into geospatial support.
Let’s walk through an example and understand why you may or may not want to leverage the modern geospatial data stack.
The background: Identifying customers for product launches
Meet Jane. She is a Data Analyst who has to help identify new locations to launch a product that her company, a multinational consumer packaged goods company, is developing targeting young families with children.
She knows a lot about her target consumer, but now she needs to find where they are most likely to shop.

Jane knows she needs to find:
- Retail locations with a high number of visits
- Ensure the store locations are accurate
- Find which consumers shop at those stores
- Pick the best locations to roll this product out
- Ideally, even predict the performance of those products
Jane has access to locations of stores and millions of records of past sales and performance data, but how is she supposed to find what type of people shop in these stores…
Bringing location into the picture
Wait! Jane remembers talking to Jim and Nancy, a GIS Analyst and a Data Scientist. They work with demographic data and make maps of it, and Nancy is a data wizard who can make just about anything from data. They get together and talk about it.

They know that they need to:
- Analyze and spatially join lots of consumer profile demographics to trade areas for these stores
- Categorize the stores to find the best fits
- Join the past product sales data (100s of millions of rows of data) to each store
- Ensure that the end users can filter and adjust assumptions
They also need to do this quickly (launch is in just a few weeks!) and ensure that assumptions can be changed with limited latency, and stay within the framework of the cloud environment.
What are the options?
Python

They could run this process with Python in a Jupyter notebook. This would answer this one question, but Jane says that they actually need to answer this question repeatedly, even change assumptions. Running this over and over for every question from the team - not going to work.
GPU Accelerated Analytics
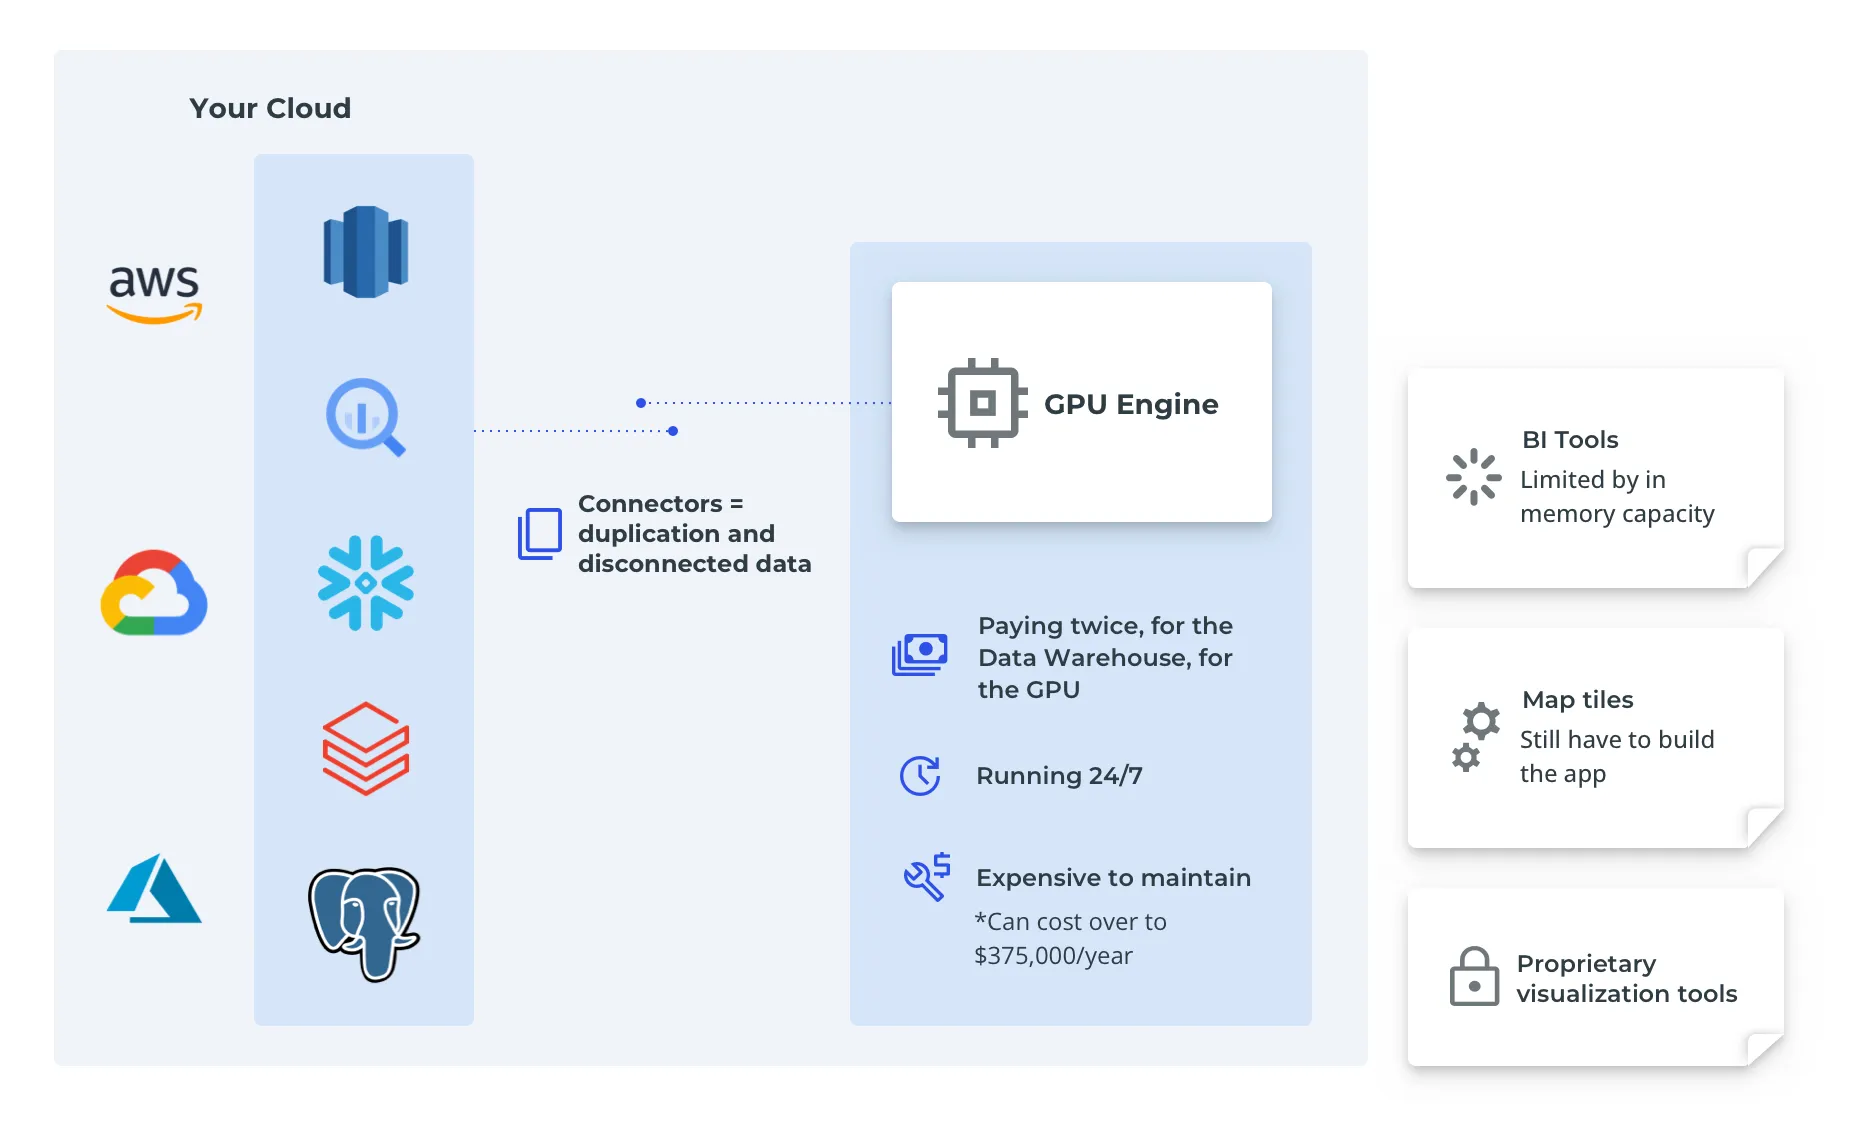
They also take a look at GPU accelerated analytics. It checks a lot of boxes: no need to transform data, anyone can filter anything, and of course - there are maps! But the Cloud team says no way, we invested a lot of time into our modern data stack, and do you know how much running GPUs around the clock costs?

BI tools
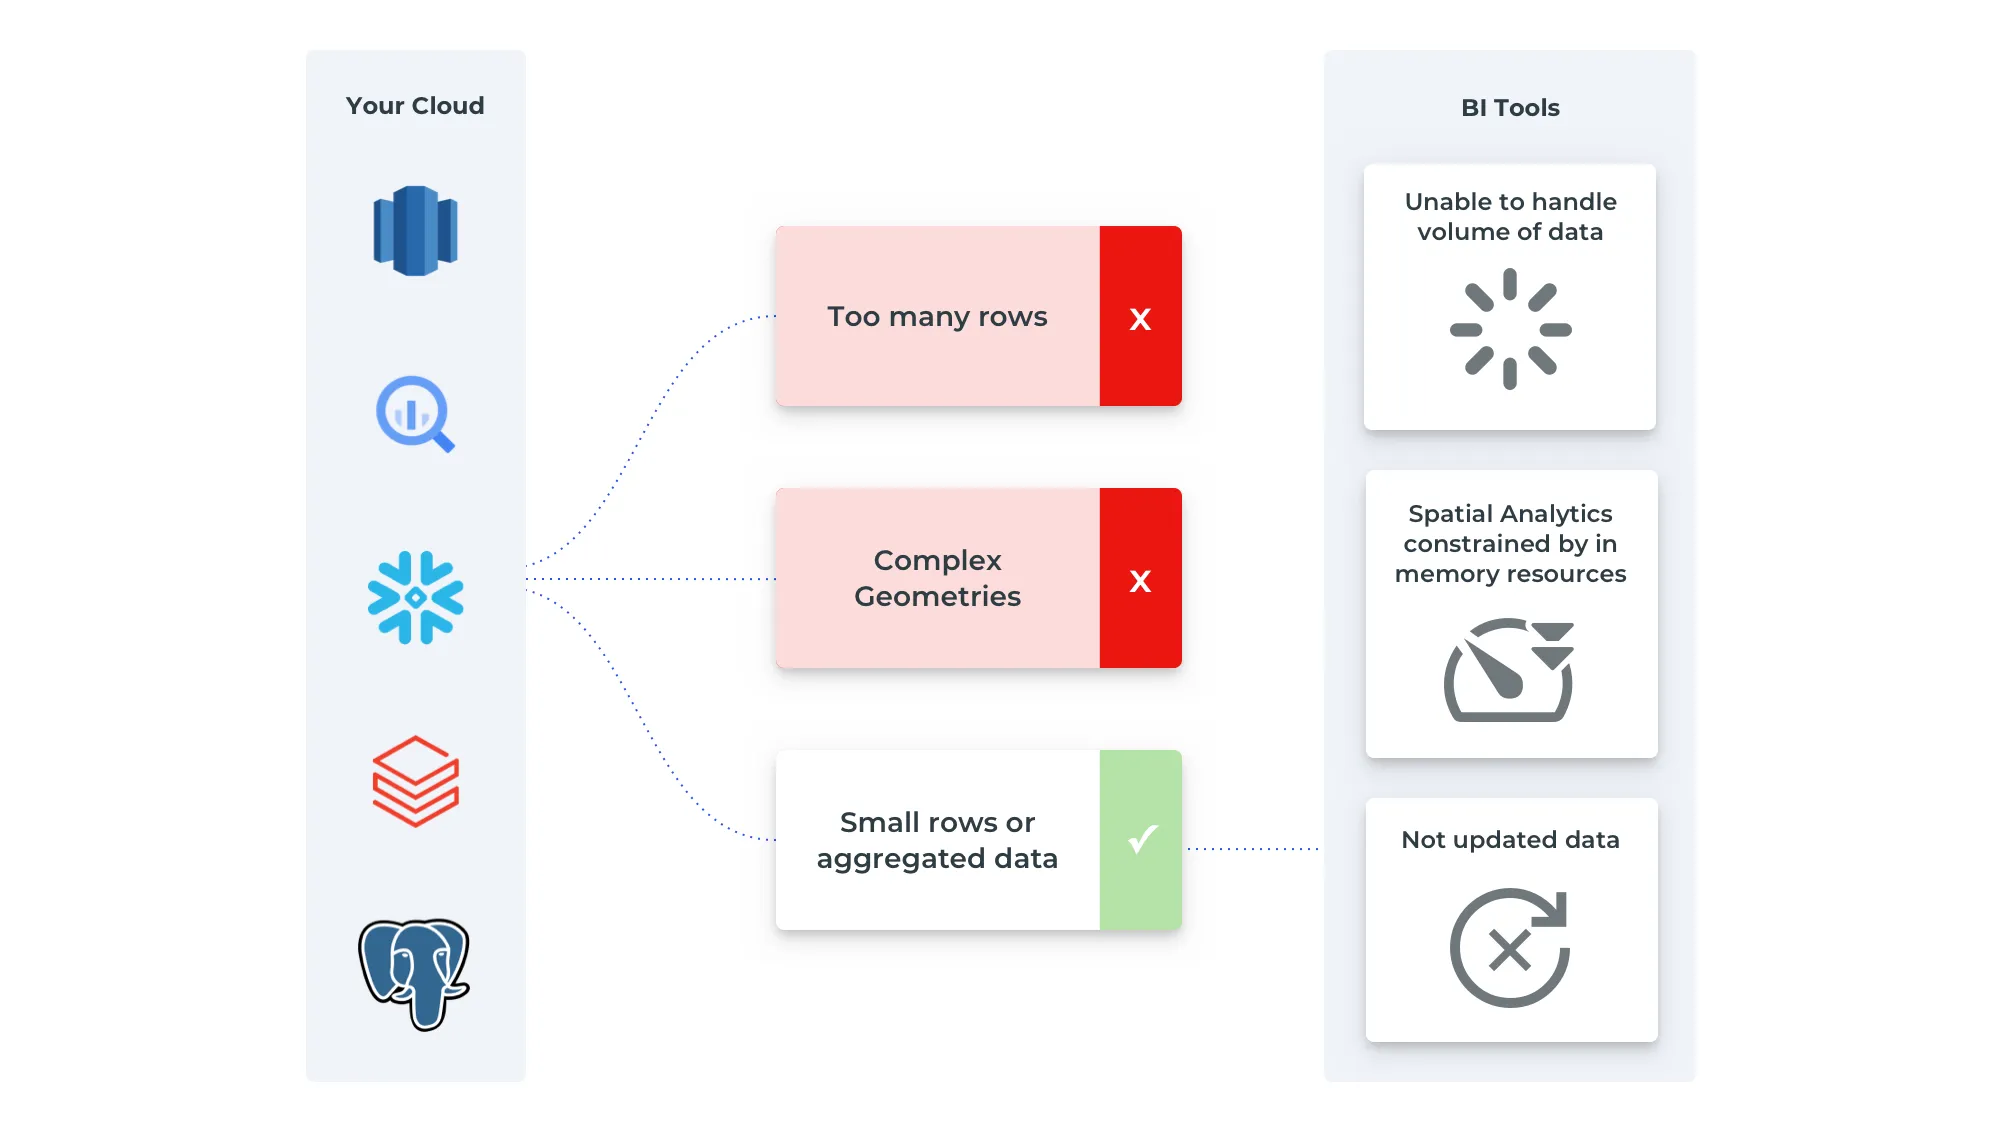
So with that off the table they think maybe we can just use aus a BI tool to visualize this data, right? Jane uses BI tools and delivers dashboards all the time. Nancy uses them sometimes too. But Jim doesn’t think so.

Jim knows BI tools can make maps, but they have major limits in terms of the amount of data they can show, and for this project, they just won’t make the cut. Jim has access to his traditional GIS tools and data, but he knows they can’t handle the data volume required, both in the server and in visualization.
The team seems stuck…
Cloud computing for the Modern Data Stack
But wait, what was that thing the Cloud team was talking about. The modern data stack?
Access the ultimate guide to navigating the new geospatial landscape. Download the free report: Modernizing the Geospatial Analysis Stack today.
Nancy chimes in. She has heard a bit about it and has used the Cloud teams “data warehouse”, even though she usually just uses it to grab and manipulate data for her data science work in notebooks.

So they talk to the Cloud team to see if this will fit their needs. Introducing Chris and Mary.

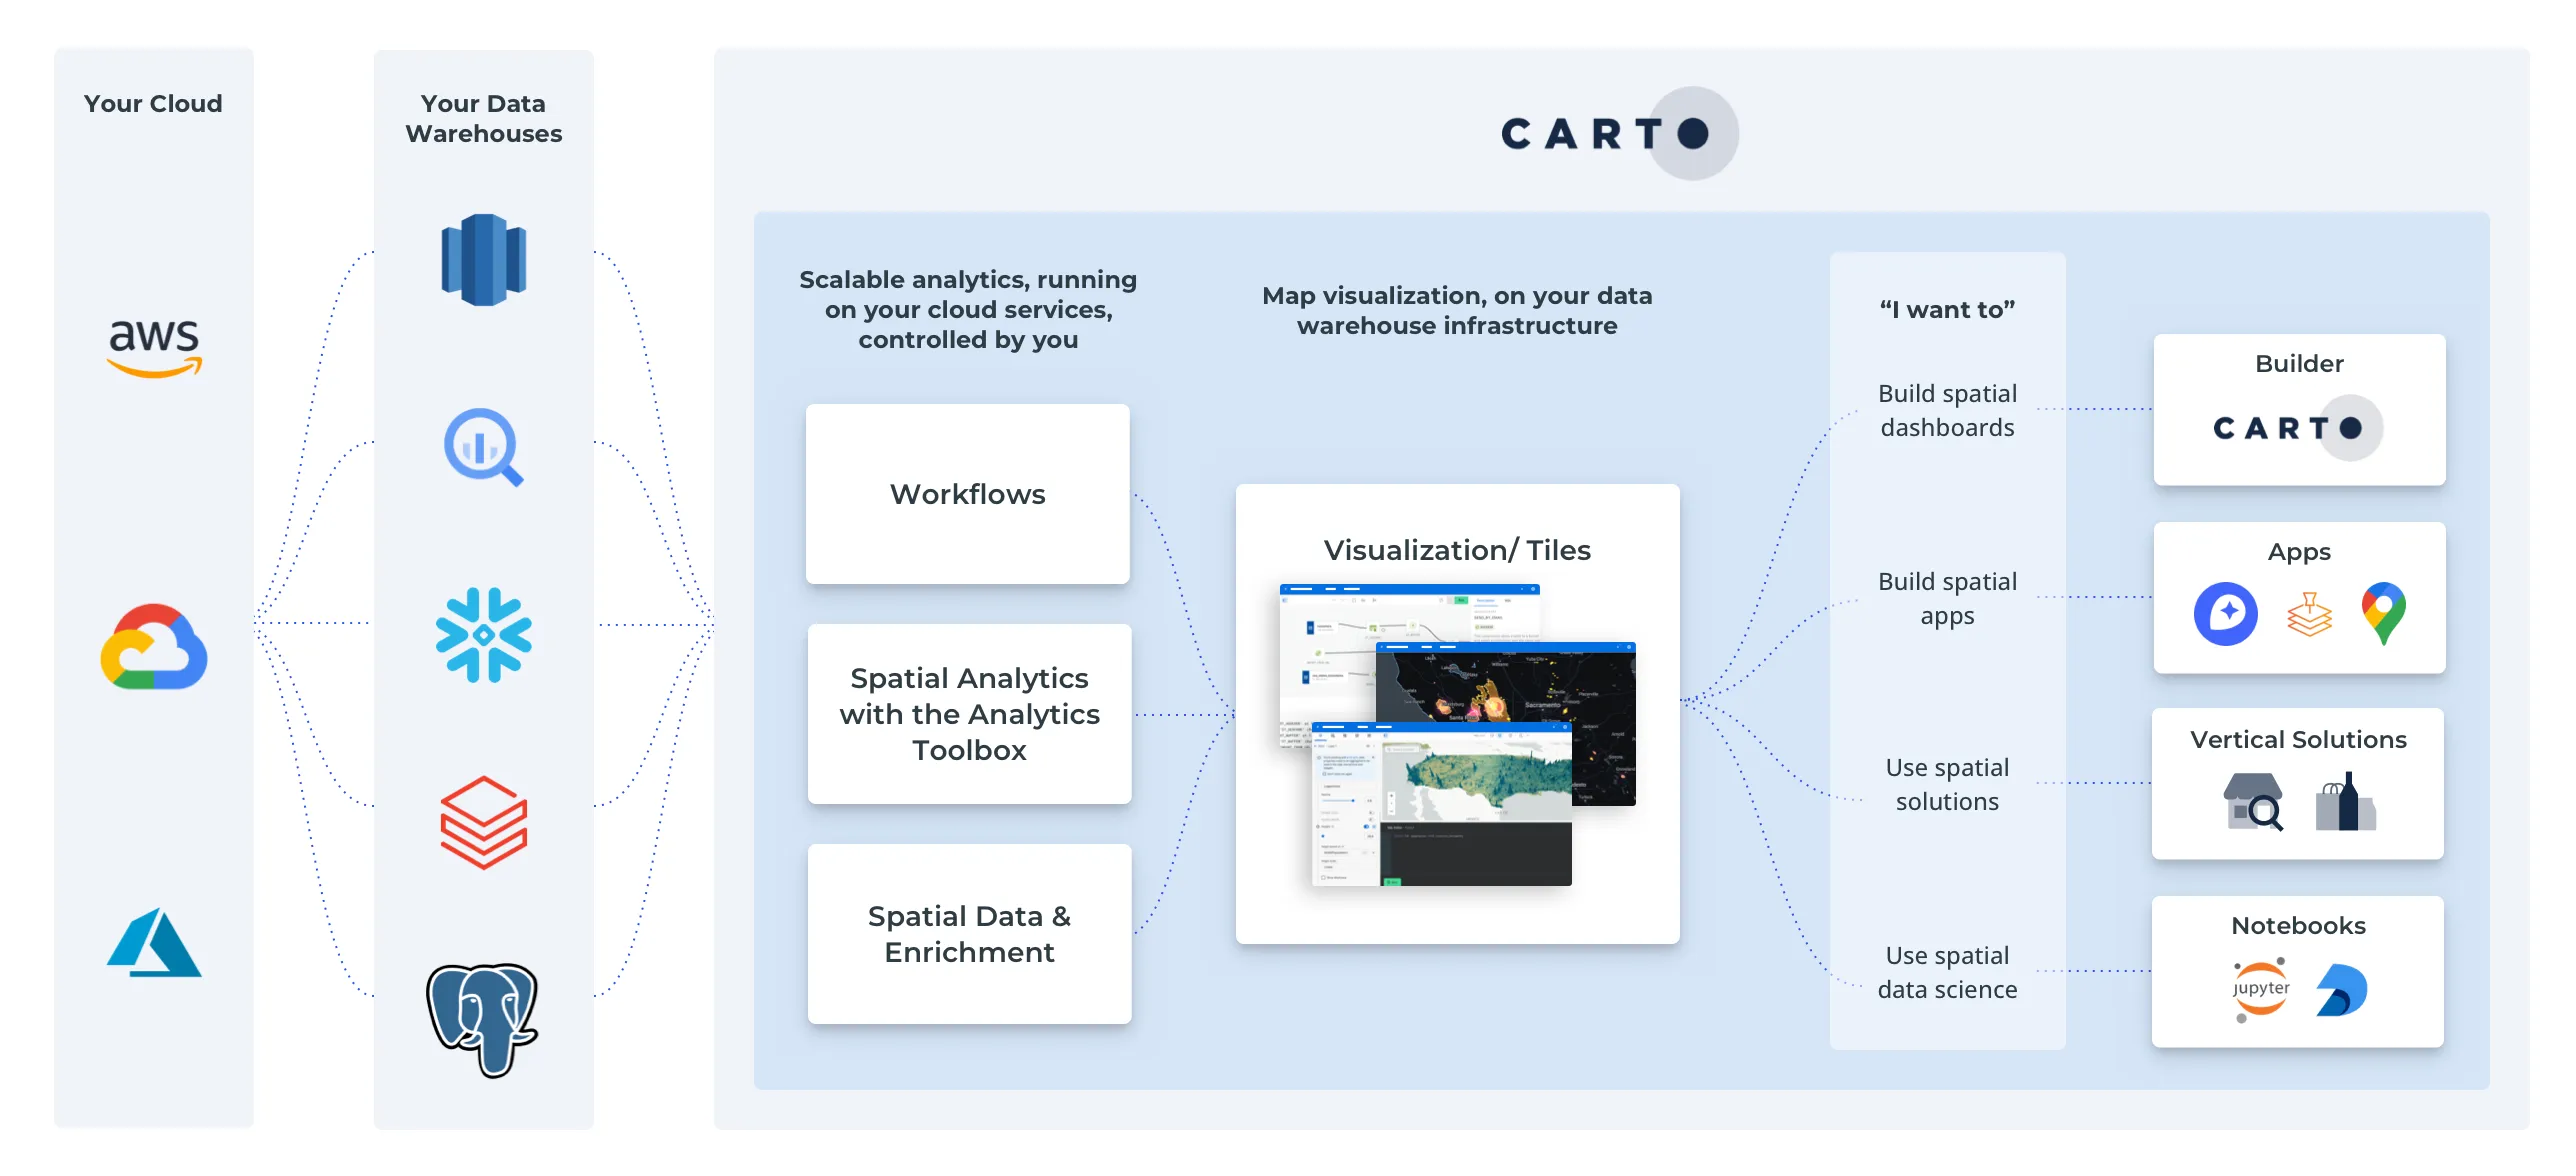
The data warehouse is purpose built for large scale analytics. Compared to traditional data infrastructure where the computational power (or the machines resources to run queries) and data storage are bound together, data warehouses separate these two resources. This means that:
- Large amounts of data can be stored in a cost effective manner.
- You can query only what you need, all other data stays in storage.
- You can scale your compute resources to meet the needs of that query, then shut them down when you don’t, without any work on the users or IT teams end.
Better yet, the data warehouse that they use has support for geospatial data and functions. This means that they can ingest and query geospatial data, and join it to the data already in the data warehouse - in this case the sales data - getting answers in seconds all within an approved IT infrastructure, all with geospatial data. You can even create machine learning models right in the data warehouse (great for our classification problem!).

Cloud Computing - who benefits?
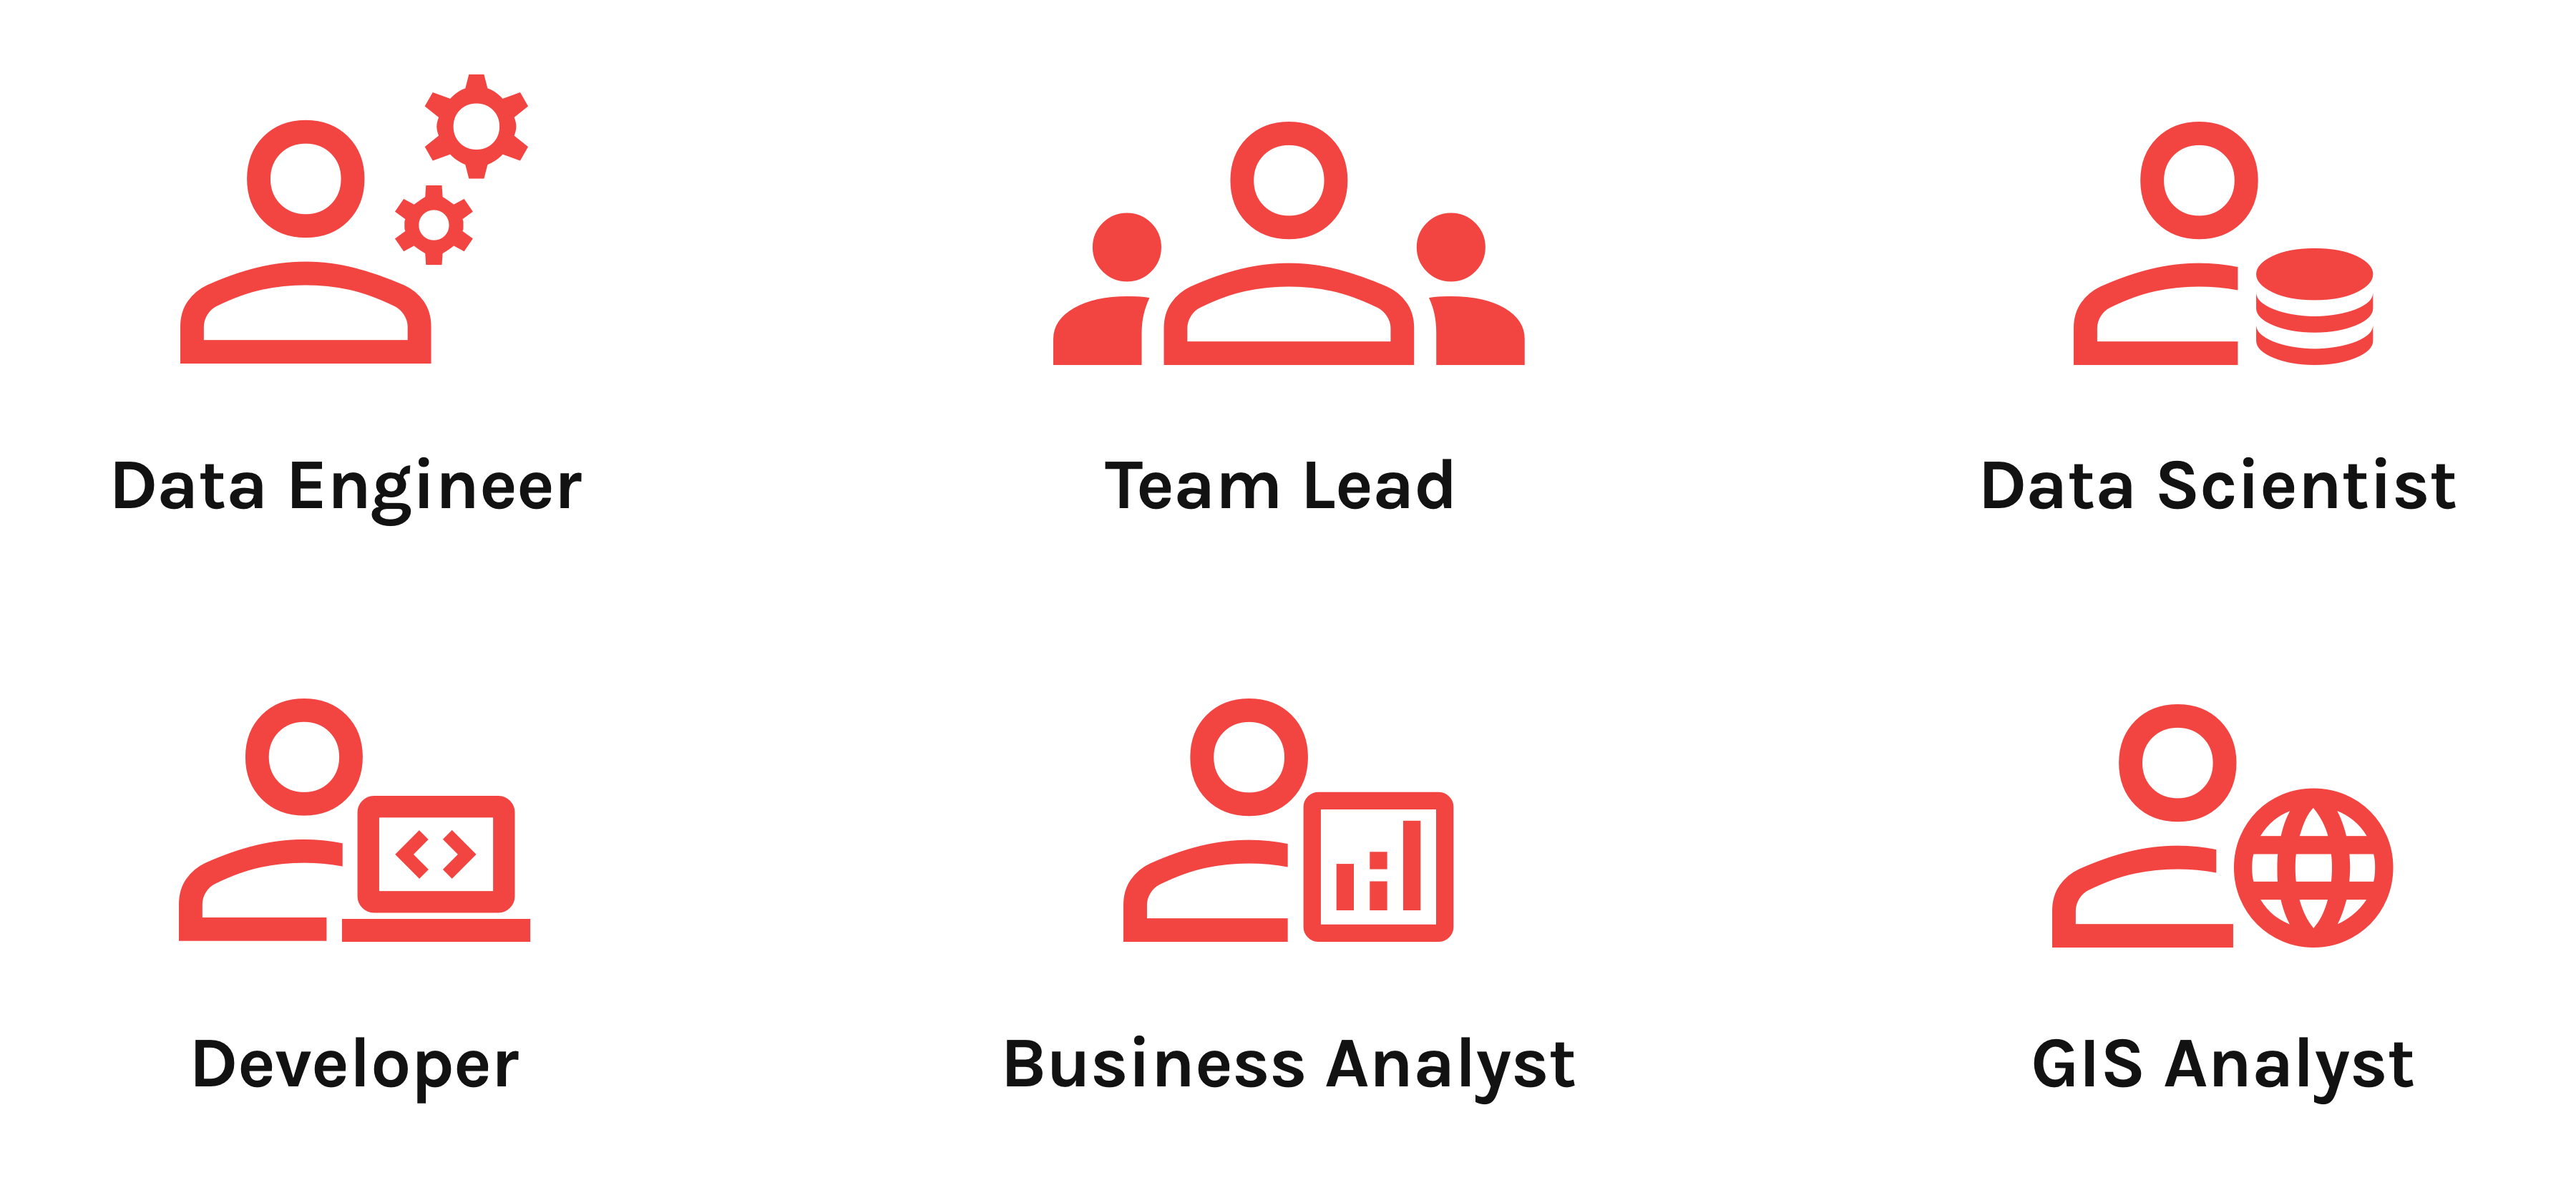
Everyone benefits:
Cloud Architects: Use existing resources without any extra work
Data engineers: Ingest geospatial data to an existing infrastructure
Data Analysts: Provide answers quickly with all the necessary data
GIS Analyst: Query geospatial data at scale
Data Scientist: Quickly test assumptions and model data in a Python environment, or create models in the data warehouse
But, there is still one small wrinkle - the map. One of the key requirements of the project was to see this data on a map. The business team is global and wants to be able to see how this product will roll out whether they are in Los Angeles or Lagos.
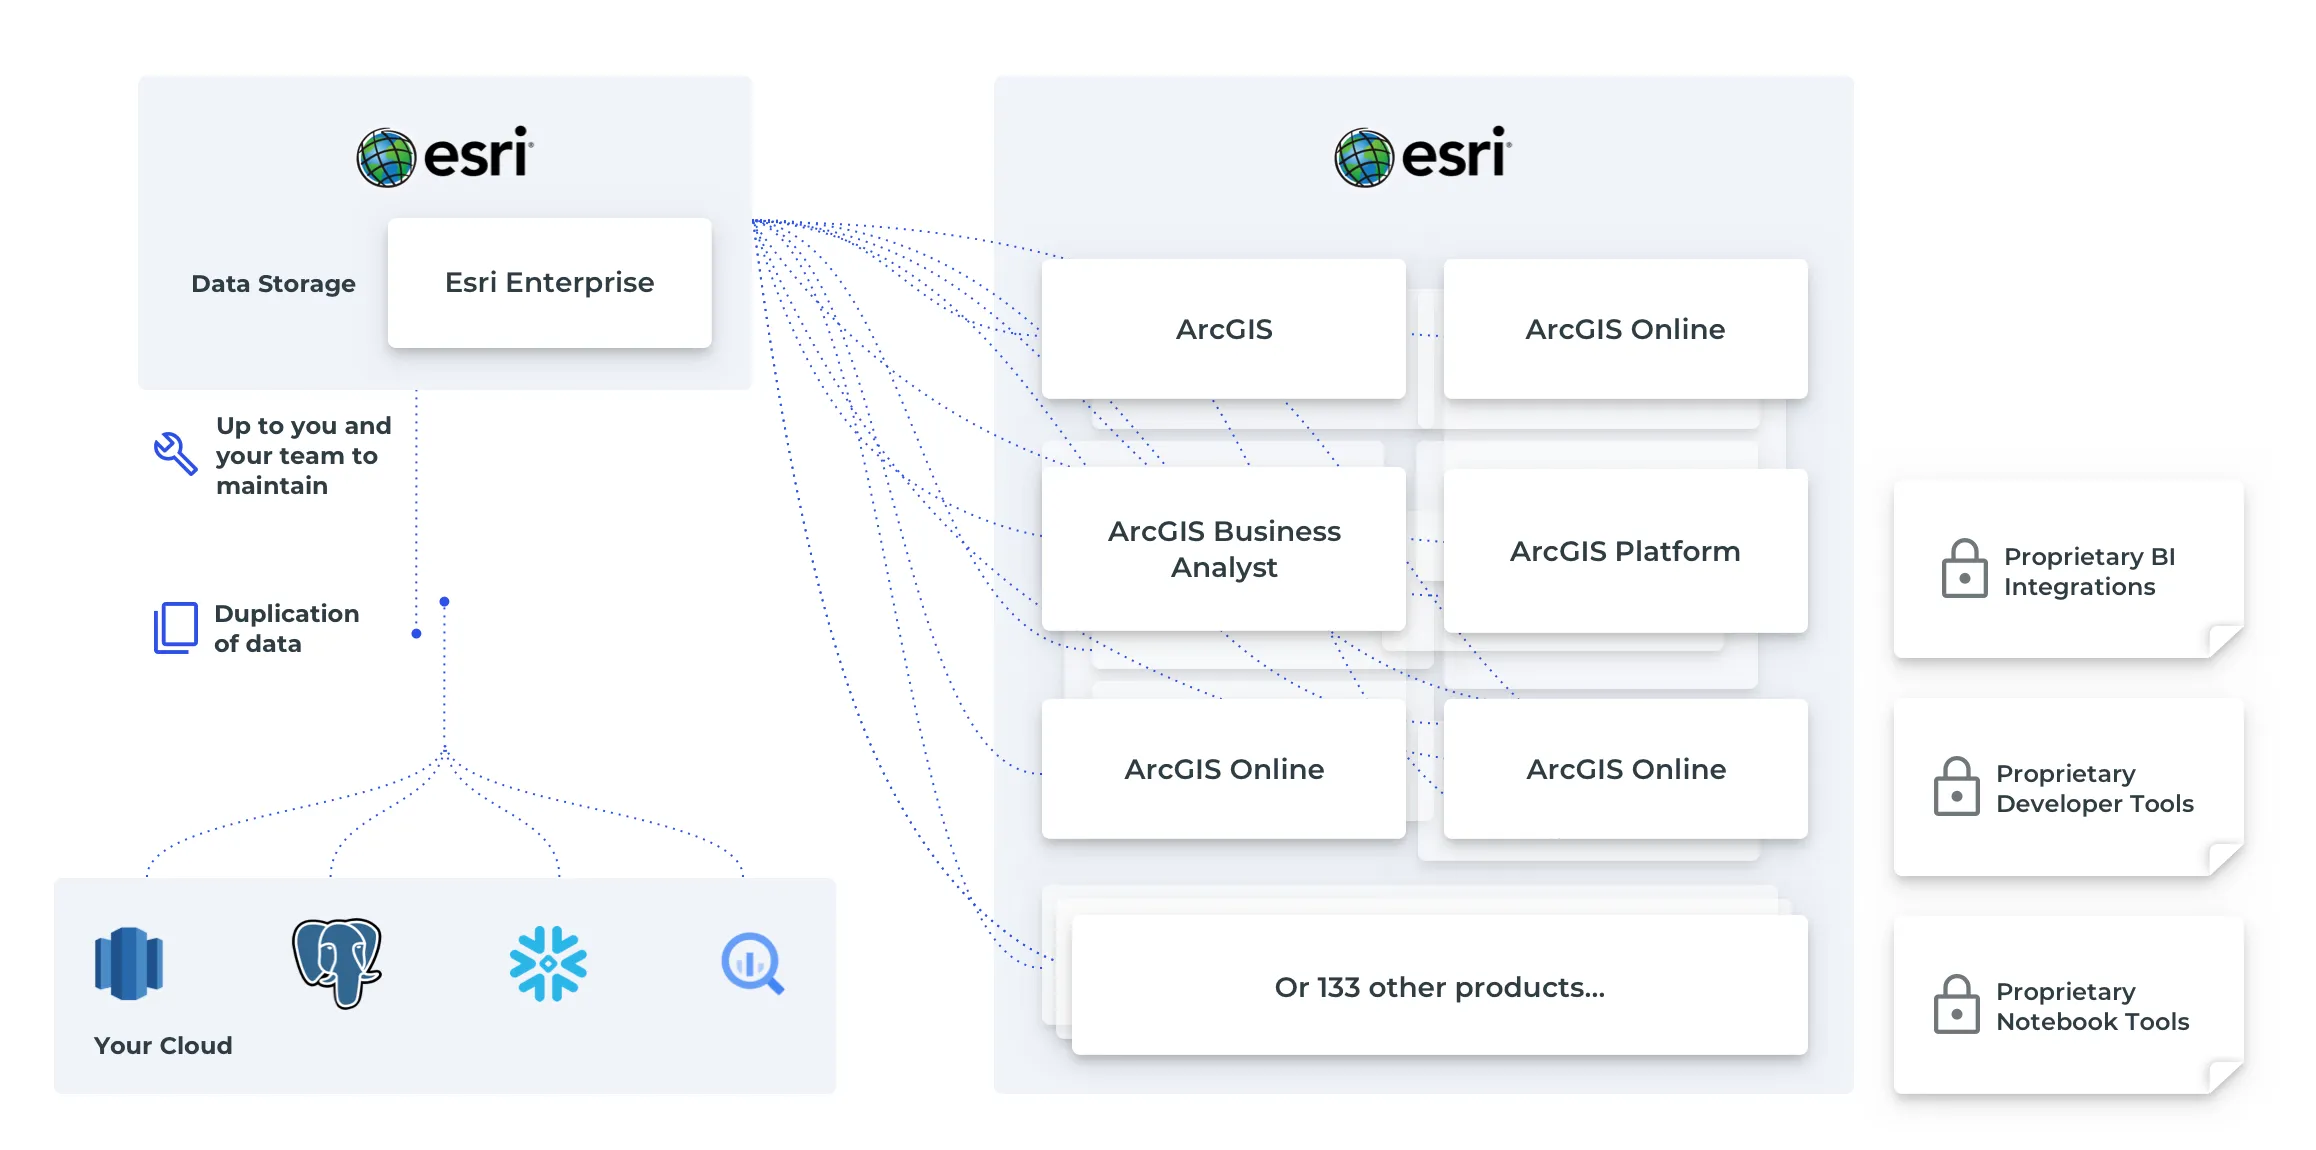
Jim starts to get a bit concerned. He has the ability to make map tiles (map tiles are used in all web maps to efficiently visualize large amounts of data at various zoom levels) with his current toolkit, but not this much data, and he will have to recreate them everytime the data changes.
And what about geocoding, creating trade areas, and styling all this data in a dashboard?
Chris chimes in, you know we have been investing in the modern geospatial data stack right?
Cloud computing for Location Intelligence
Chris talks about the great partnership with CARTO that actually helps solve this exact set of problems, Jim. All within the data warehouse itself using the CARTO Analytics Toolbox alongside Spatial SQL we can:
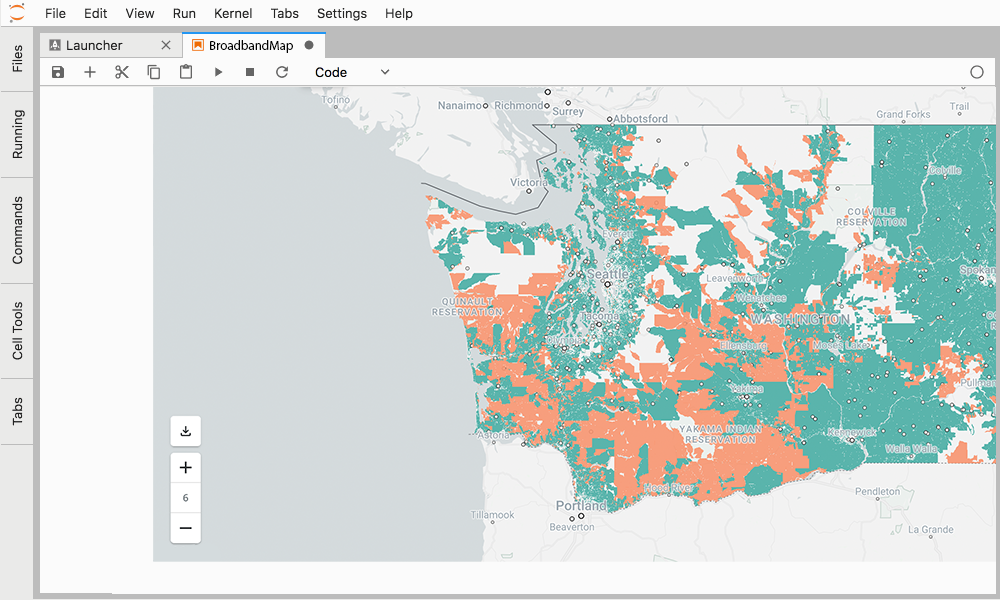
- Create map tiles in the data warehouse, or render them on the fly with the freshest data
- Geocode locations and create drive time trade areas
- Visualize those results in the CARTO Builder
- Solve routing problems with any road network
- Enrich our data with other datasets (public and premium) from the CARTO Data Observatory
They even have modules to create models for retail like revenue prediction and twin areas, and for consumer packaged goods like generating trade areas and performing customer segmentation.
And Mary lets them know that since all this runs in the data warehouse, they get all the exact same performance advantages and security approvals.
Looking good! But the team has varying SQL skills. Nancy uses it a bit but prefers Python, Jim as well. And Jane mostly does her data work in tools like Tableau or Alteryx.
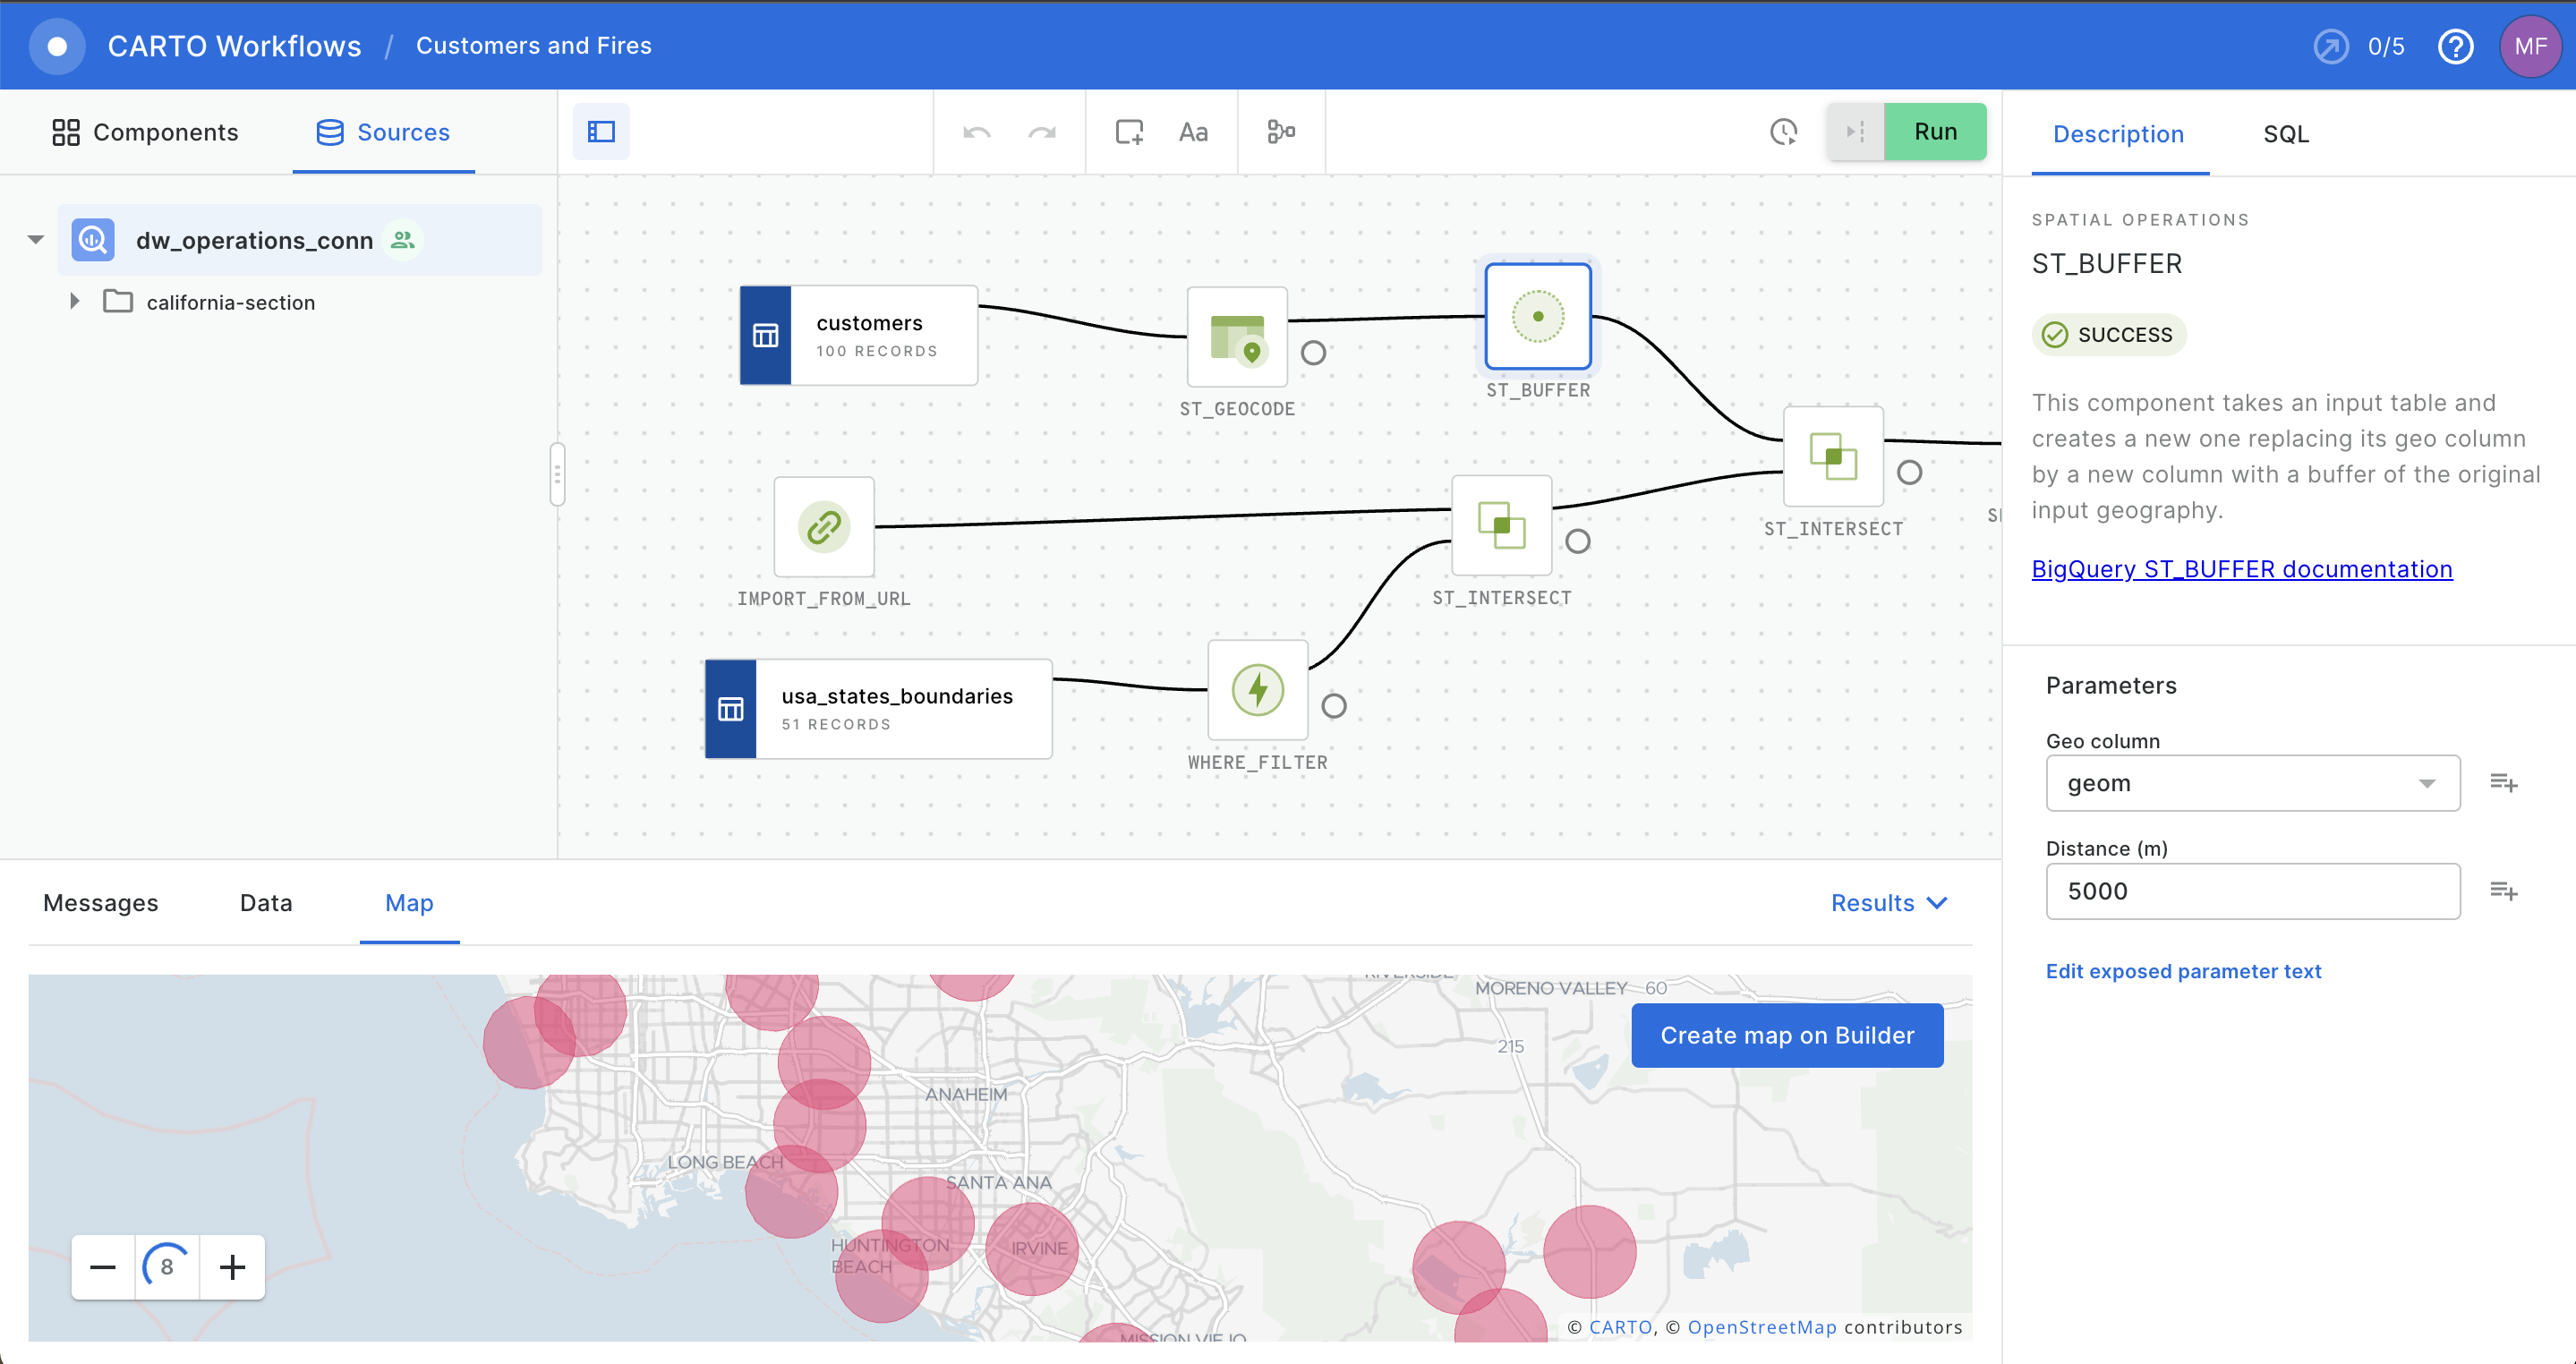
Low-code spatial analytics
You guys will love this, Mary says. Check out CARTO Workflows. It’s a tool to build your own models using a visual model builder, but it runs and compiles the same SQL you would need to run in the data warehouse.
Okay, one last tiny thing, Jane says. What about making sure that the teams can only see the data for their team, not data from other locations?
Good news, Chris says. CARTO maps inherit our row level security and authentication protocols. That means that we know who is logged in, and only show the data that they are approved to see, and CARTO just uses that information in the maps.
The team thinks they have found their tool. Time to get to work.

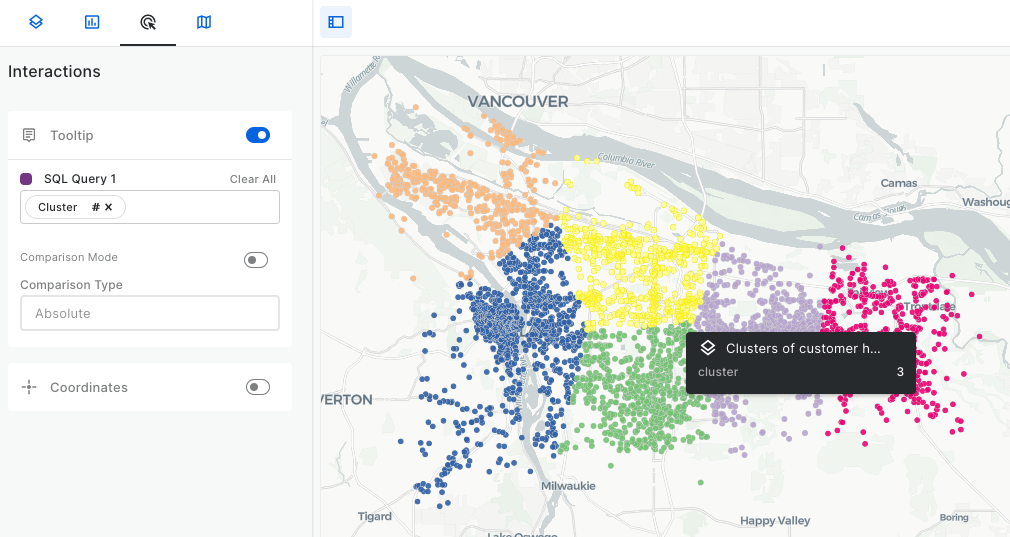
Flexible analytics
Jane is presenting her results to the product owners and marketing teams. She seamlessly shows them the best locations where they can roll out their new product. They can see the number of suitable stores, potential target consumer reach, and potential revenue for each region, and each potential store.
Then Jane gets a question:
“Hey but what if we wanted to only focus on the top 50% of suitable locations. What then?”
Jane is waiting for this moment. With one simple filter she quickly adjusts the map, shows the new results, and gives the answer on the spot. No new data processing. No creating a new dashboard.
“And that uses up to date sales data?” one marketing lead asks.
“Of course! And we don’t have to do anything to update it, it comes right from our data warehouse,” Jane says.
The questions keep rushing in from the team, and Jane is able to quickly provide answers.
“Hey, I could use one of those for my team? How did you even make that?” asked one of the product owners?

“Well, we have a great team helping us across our organization. From our cloud team, GIS team, and data science team, we were able to design a repeatable and scalable solution to answer these really complex questions.”
Several more requests came in from the team, and now it was time to get to work again. The good news is that Jane knew that she now had the tools to push out geospatial insights faster than ever. It’s off to the races now!
Does all this sound good to you? Request a free demo below!