London vs New York: Which city has the higher average building height?


Many comparisons have been made between these two iconic cities not least in terms of size population and other factors like quality of life and the best pizza slice but we wanted to take a look at the spatial data to give some insights into the differences between their Real Estate.
For this we are happy to once again feature the work of Housing and Spatial Information Specialist Dan Cookson who readers may remember from our 2018 Twitter Guide and a post mapping the 1.5 million new homes built in England over the last decade.
Visualizing the Data
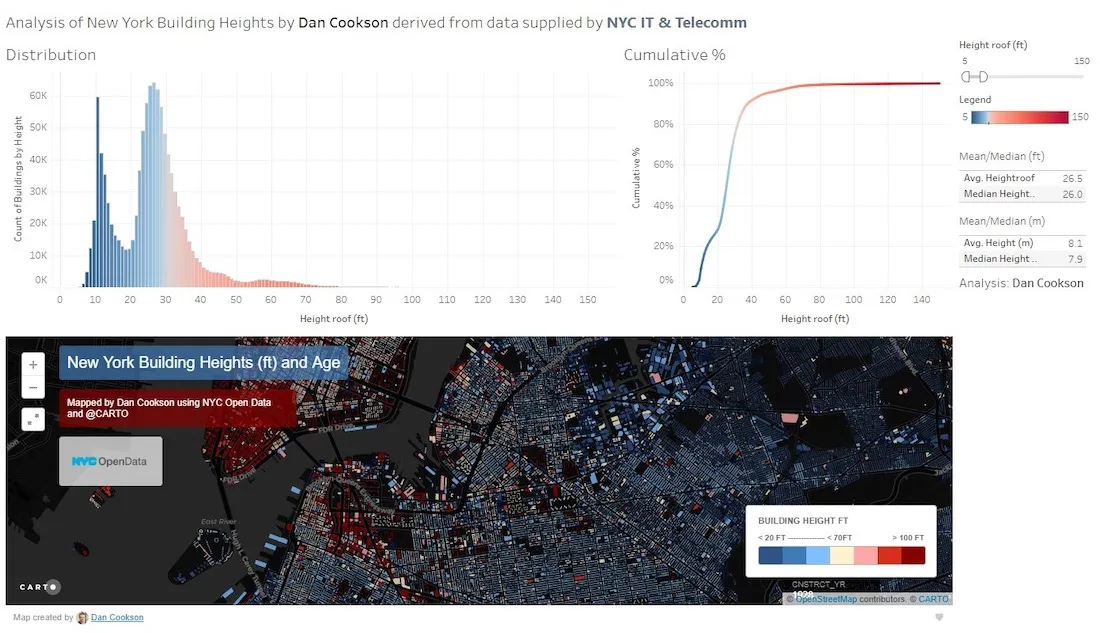
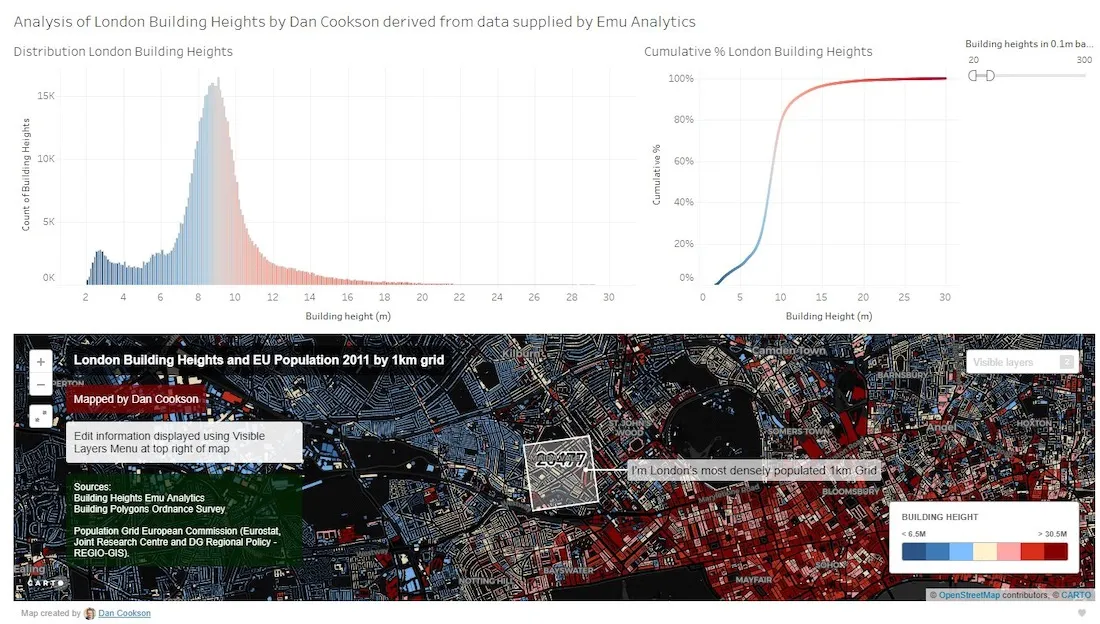
New York City has over 6 000 high-rise buildings in total 274 of which are skyscrapers standing over 150m tall. By comparison London only has 33 so one might assume that New York has the higher average building height. In his work Dan decided to test this assumption and using open source data from NYC Open Data Ordnance Survey and Emu Analytics (who had combined OS Open Map and Environment Agency LIDAR data to create a useful building heights dataset for London) he was able to create the two maps as seen below.
Adjusting the zoom to show just central Manhattan and central London does indeed show that for these areas New York has a higher average building height but when we zoom out to include the city limits we see that both cities actually have a very similar figure at a little over 8m.
So if you are looking for an interesting trick question to include in your next Zoom quiz this is it.Which city has the highest average building height? Answer: Neither - they’re the same.
Additional Analysis
Performing additional analysis shows just how many low buildings there are across the five boroughs of New York City with a twin peak distribution visible.
Performing the same analysis for London shows a similar but less significant twin peak in the distribution of building heights. One reason for this could be that the building footprint data for London is less detailed than the equivalent for New York which includes low outbuildings and garages.
By combining this type of building height analysis with local population densities it is possible to better understand and describe the actual lived-in density of our cities. This is a hot topic at the moment as the world tries to figure out quite how COVID-19 infection rates relate to city population size and density or indeed household size and density.
Building Heights Analysis is just one geospatial use case in Real Estate but there are many more for research teams to consider.
Commercial Market Analysis
Research & Data Science teams in large CRE firms & REITS rely on spatial analysis to deliver market insights that improve the quality of their investment strategies. Whether it’s office industrial multifamily or retail - using new types of location data to identify opportunities & predict returns can give a competitive edge in an increasingly competitive market.
Trade Area Analysis
In M&A trade areas are fundamental to understand where potential acquisition chains’ customers live in relation to existing or potential business sites. By comparing the number of customers by distance from a business site to the number of households in the study area - your analysts can rapidly gauge the opportunity that a potential investment may have or that an existing portfolio company may be missing.
Site Selection
Using multiple location data streams in the site selection process as a Commercial Real Estate developer is crucial in order to understand catchment and trade areas for your final clients. Whether it’s for retail sites corporate offices or industrial units - justifying pricing for both sales and rentals is more important than ever. Bringing in new datasets relating to credit cards transactions or human mobility can be the difference between closing that big deal or losing it to your competitor.
One of Dan’s maps was also recently featured in a tweet by a Scottish Member of Parliament and a press report about second home ownership in Scotland amidst a debate around lockdown protocols during the COVID-19 pandemic.
Want to learn how to perform similar analysis?