What We Learned At NACIS 2017


This post may describe functionality for an old version of CARTO. Find out about the latest and cloud-native version here.
The North American Cartographic Information Society’s annual meeting took place a few weeks ago in Montreal Canada. It’s an important conference for GIS professionals where you can learn new tips and techniques from the industry’s top cartographers and companies. Some of us from CARTO were lucky to attend and give presentations about data-driven cartography for Data Scientists and tips for making web maps responsive. Here are a few of the other talks we liked:
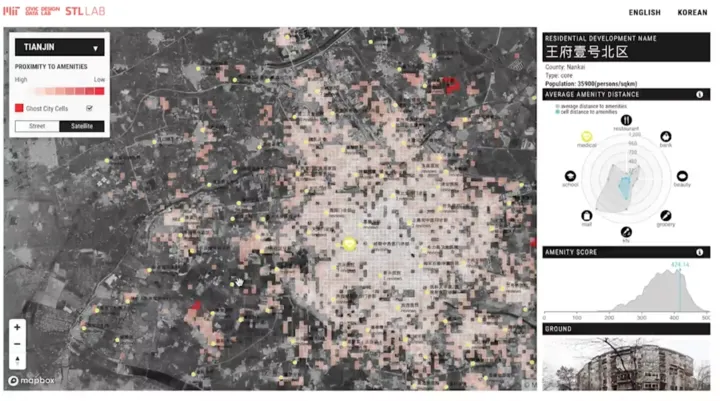
- CARTO’s Wenfei Xu gave a talk about work she did while at MIT: Ghost Cities of China.
- Lyzi Diamond had a great illustrated explanation of when and why digital services like Mapbox & CARTO use Web Mercator vs. WGS84 projections.
- Aaron Dennis from the Azavea Data Analytics Team pointed out that your interactive or animated data vis can be shown as a static screenshot when re-shared by others. Sometimes that static image misrepresents what you’re trying to show. Here's their Node.js/D3/Canvas solution for generating the right static infographics efficiently.
##_IMAGE_SIZE_LIMT_## https://carto.com/media-content/blog/img/posts/2017/2017-11-06-nacis-recap/rainonterrain3.gif##_IMAGE_SIZE_LIMT_##
- Andy Woodruff showed us how he built an animated drainage map with HTML Canvas JS and Mapzen's terrain tiles
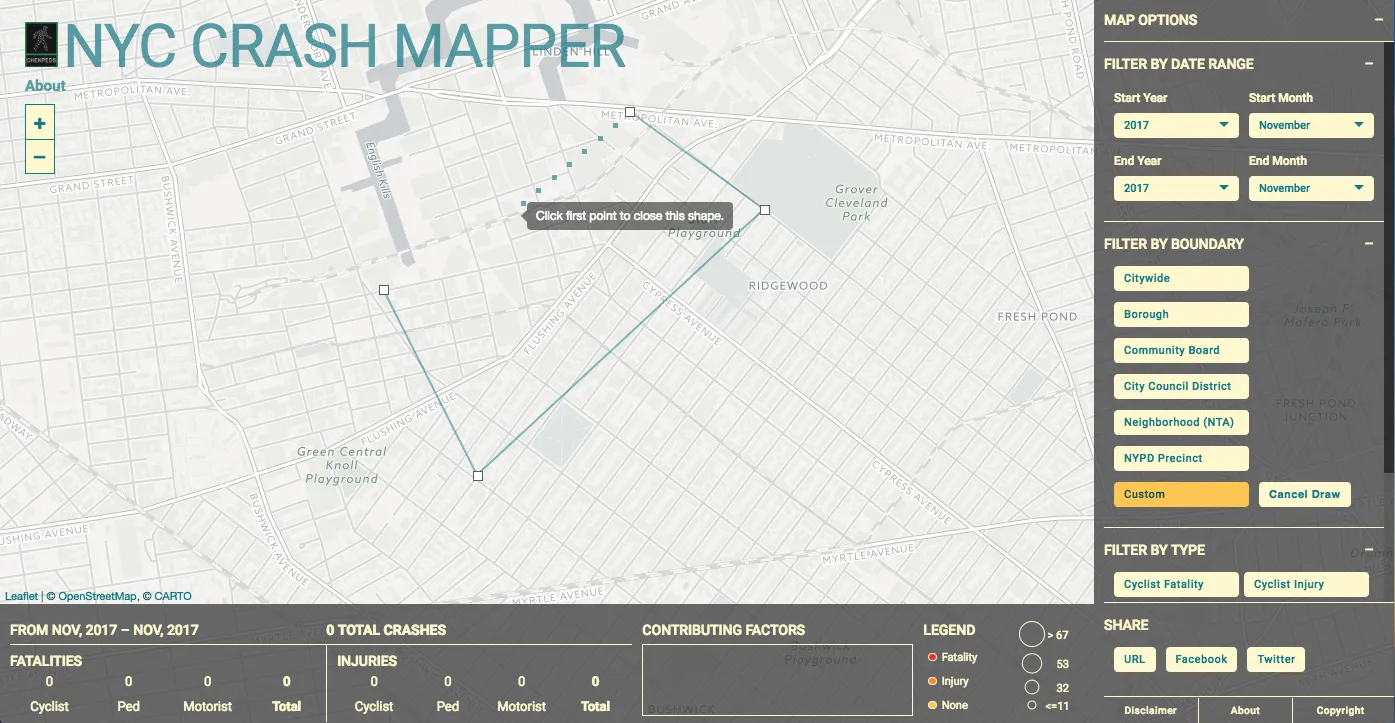
- Chris Henrick's NYC Crash Mapper implements a useful custom area selection tool in the CARTO map.
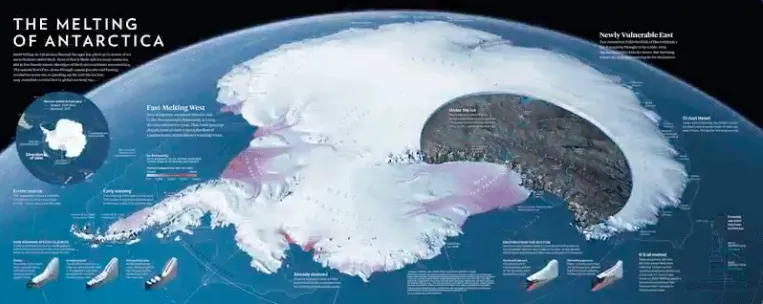
- Lauren Tierney showed us that beautifully detailed maps like this one of Antarctica from National Geographic Magazine:
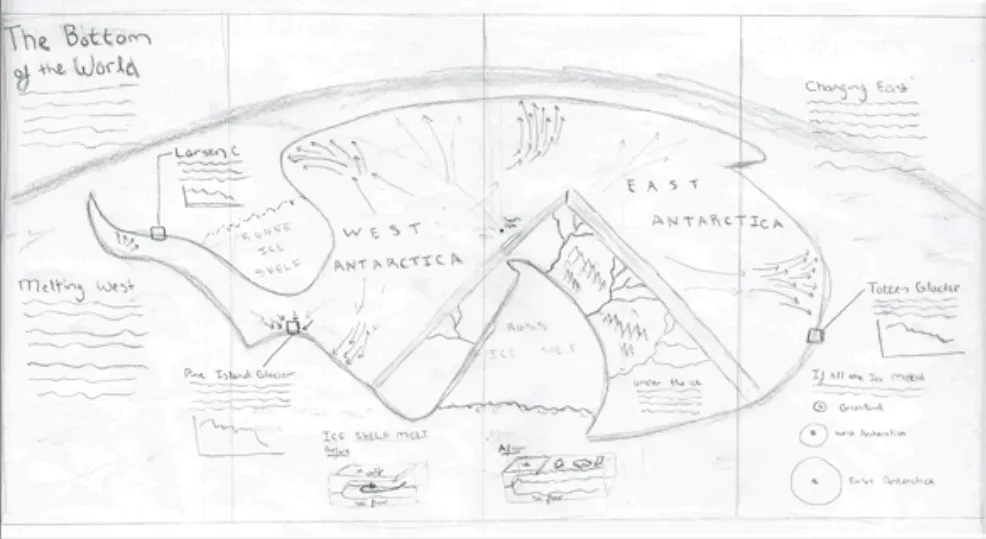
…start from sketches like this:
NACIS has posted the recorded talks here on YouTube. We're already looking forward to next year's meeting!