

Spanish Residential Real Estate data in CARTO with Tinsa Digital


New data streams and analysis techniques are critical for industry growth today. Yet until recently the Real Estate sector suffered from a lack of appropriate analytical tools for market research — from comprehensive data sources to geospatial tools — in a sector that by its very nature dealing with physical properties should be ground zero for spatial analytics development. Despite this for many in the industry analysis of critical factors like potential Real Estate demand is still carried out in manual and rudimentary ways.
Fortunately for both clients and professionals in the market recent years have seen intensive growth in the application of techniques that have evolved in parallel with the growing availability of data and tools. These changes along with the development of applications allows this data to be exploited and represented in richer and more complex ways. This has also radically changed the professional profiles demanded as well as the quantity and quality of information that customers and consumers rely on to understand the market and make decisions.
Specifically geospatial analytics platforms have become absolutely essential in the Real Estate sector. Whether for the analysis of large Real Estate portfolios in the form of viewers with integrated statistical and sectoral information in market studies - of trends or ad hoc- etc.; they have become an essential and indispensable tool for analysts data scientists and business users.
It is for these reasons that we are thrilled to announce the inclusion of premium datasets from Tinsa Digital in our Location Data Stream Catalogue.
Comprehensive Unbiased 100% Verified Real Estate Data
Tinsa detected a lack of transparency in the Spanish Real Estate market several years ago where data was not available as open source and therefore data players in the market had to use unofficial sources by independent experts. As a result the market for verified Real Estate data was very fragmented with hundreds of actors with partial data but there was not one source with sufficient coverage to serve the entire national territory.
Tinsa Digital was created to offer Big Data & Location Intelligence indicators and tools based on data from 300 000 annual valuations of properties that have been physically inspected by independent experts who neither buy nor sell nor manage these properties. This allows for unbiased and 100% verified data.
Tinsa Digital has both market and supply information dating back to 1985 allowing them to perform analyses with great historical indicators. So for the first time the market has Real Estate insights based on a consolidated reviewed and unbiased database with which to make decisions while minimizing risk. Tinsa Digital is currently focused in Spain but they are already opening markets in Portugal Mexico Chile and Colombia.
Datasets now available in CARTO include metrics such as:
- Main characteristics of residential properties of an area
- Average appraised values for different types of residential properties
- Average rental prices
- Annual pricing variations for different types of residential properties
- 12-month pricing forecasts
- Average total mortgage and mortgage fees per area
- Net and gross financial burden per household based on first year of mortgage
- Gross rental yields
Datasets are provided with spatial aggregations at postal code municipality and province levels.
Tinsa Data Paints the Real Estate Picture in Madrid
To get a clear sense of the analyses that can be performed with Tinsa Digital data we'll be showing two examples:
- The evolution of the residential parks from the beginning of the 20th century onwards.
- The evolution of unit value by square meter in the districts of Madrid - a comparative analysis from the actual values to the evolution in the last 5 and 10 years.
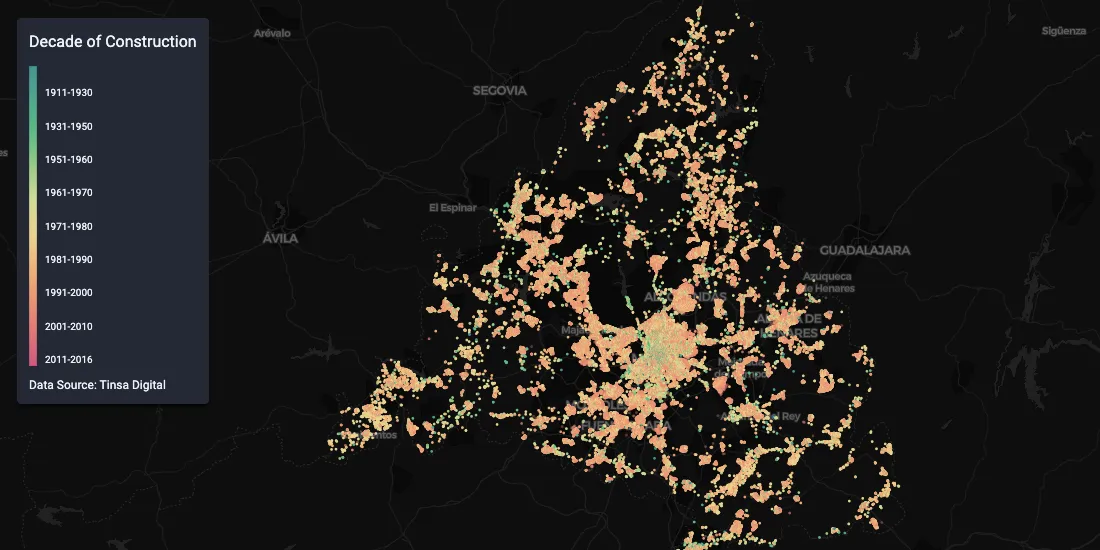
As we can see in the map below the gradual residential growth in the Community of Madrid is evident in a sequential way showing the expansion of the capital and the different municipalities during the last decades finally giving place to the current residential park. The map shows the cumulative quantity of buildings that have been built in each area. Areas with a high number of residential properties are marked in light green areas with low development are visualized in dark green.
One of the main variables that Tinsa publishes historically as a national reference in the market is the residential price index also used as the fundamental base of many other indicators (i.e financial effort per household gross rental yield etc.). The representation of its recent evolution with an adequate geographical breakdown (in this case for some municipalities of the region and districts of the capital city) provides a detailed vision of rising prices during the last expansive cycle.
After years of information gathering from thousands of weekly appraisals these and dozens of other real estate insights can be mined through spatial analysis of the Tinsa Digital data that is now available in CARTO Data Observatory.
Get Started with Modern Up-to-Date Data Streams
Learn more about CARTO's location data streams today and start incorporating data from Tinsa Digital and other high-quality data sets into your models and spatial analyses today.
Special thanks to Mamata Akella CARTO's Head of Cartography for her support in the creation of the maps in this post.


