Understanding Retail Store Clusters with Local Outlier Factor Analysis


The retail landscape of a city is a complex and intricate one. A store’s success or failure depends heavily on its location; whether it is in a busy area has a strong local market and good transport links for incoming goods staff and customers. One of the more complex aspects of this is proximity to competitors. For some types of stores proximity to competitors can dilute their market share and therefore their income. However in some cases the reverse can be true. The multiplier effect of numerous similar businesses can lure more customers to an area and allow for stores to capture new customers who otherwise may not have visited them.
Clothing stores are an excellent example of a retail unit which can benefit from proximity to competitors. Customers prefer to visit areas where they have the ability to visit different stores comparing products and prices often returning to the same store multiple times in one day to make sure the item of clothing they are buying is exactly the right choice.

With this in mind it’s important for retailers to consider local store clusters for multiple reasons including:
- When selecting a new store location to ensure their location is part of a key cluster rather than lying on the outskirts of the retail core. This is particularly powerful when combined with other datasets and techniques such as Consumer Spending and Journeys (read more about CARTO’s Site Selection solution here).
- Understanding the location-based strategies of competitors.
- Monitoring the unfolding retail landscape around them to understand emerging - or declining - locations.
A great tool for understanding these spatial patterns is Local Outlier Factor which can be used as part of CARTO’s Analytics Toolbox.
What is Local Outlier Factor?
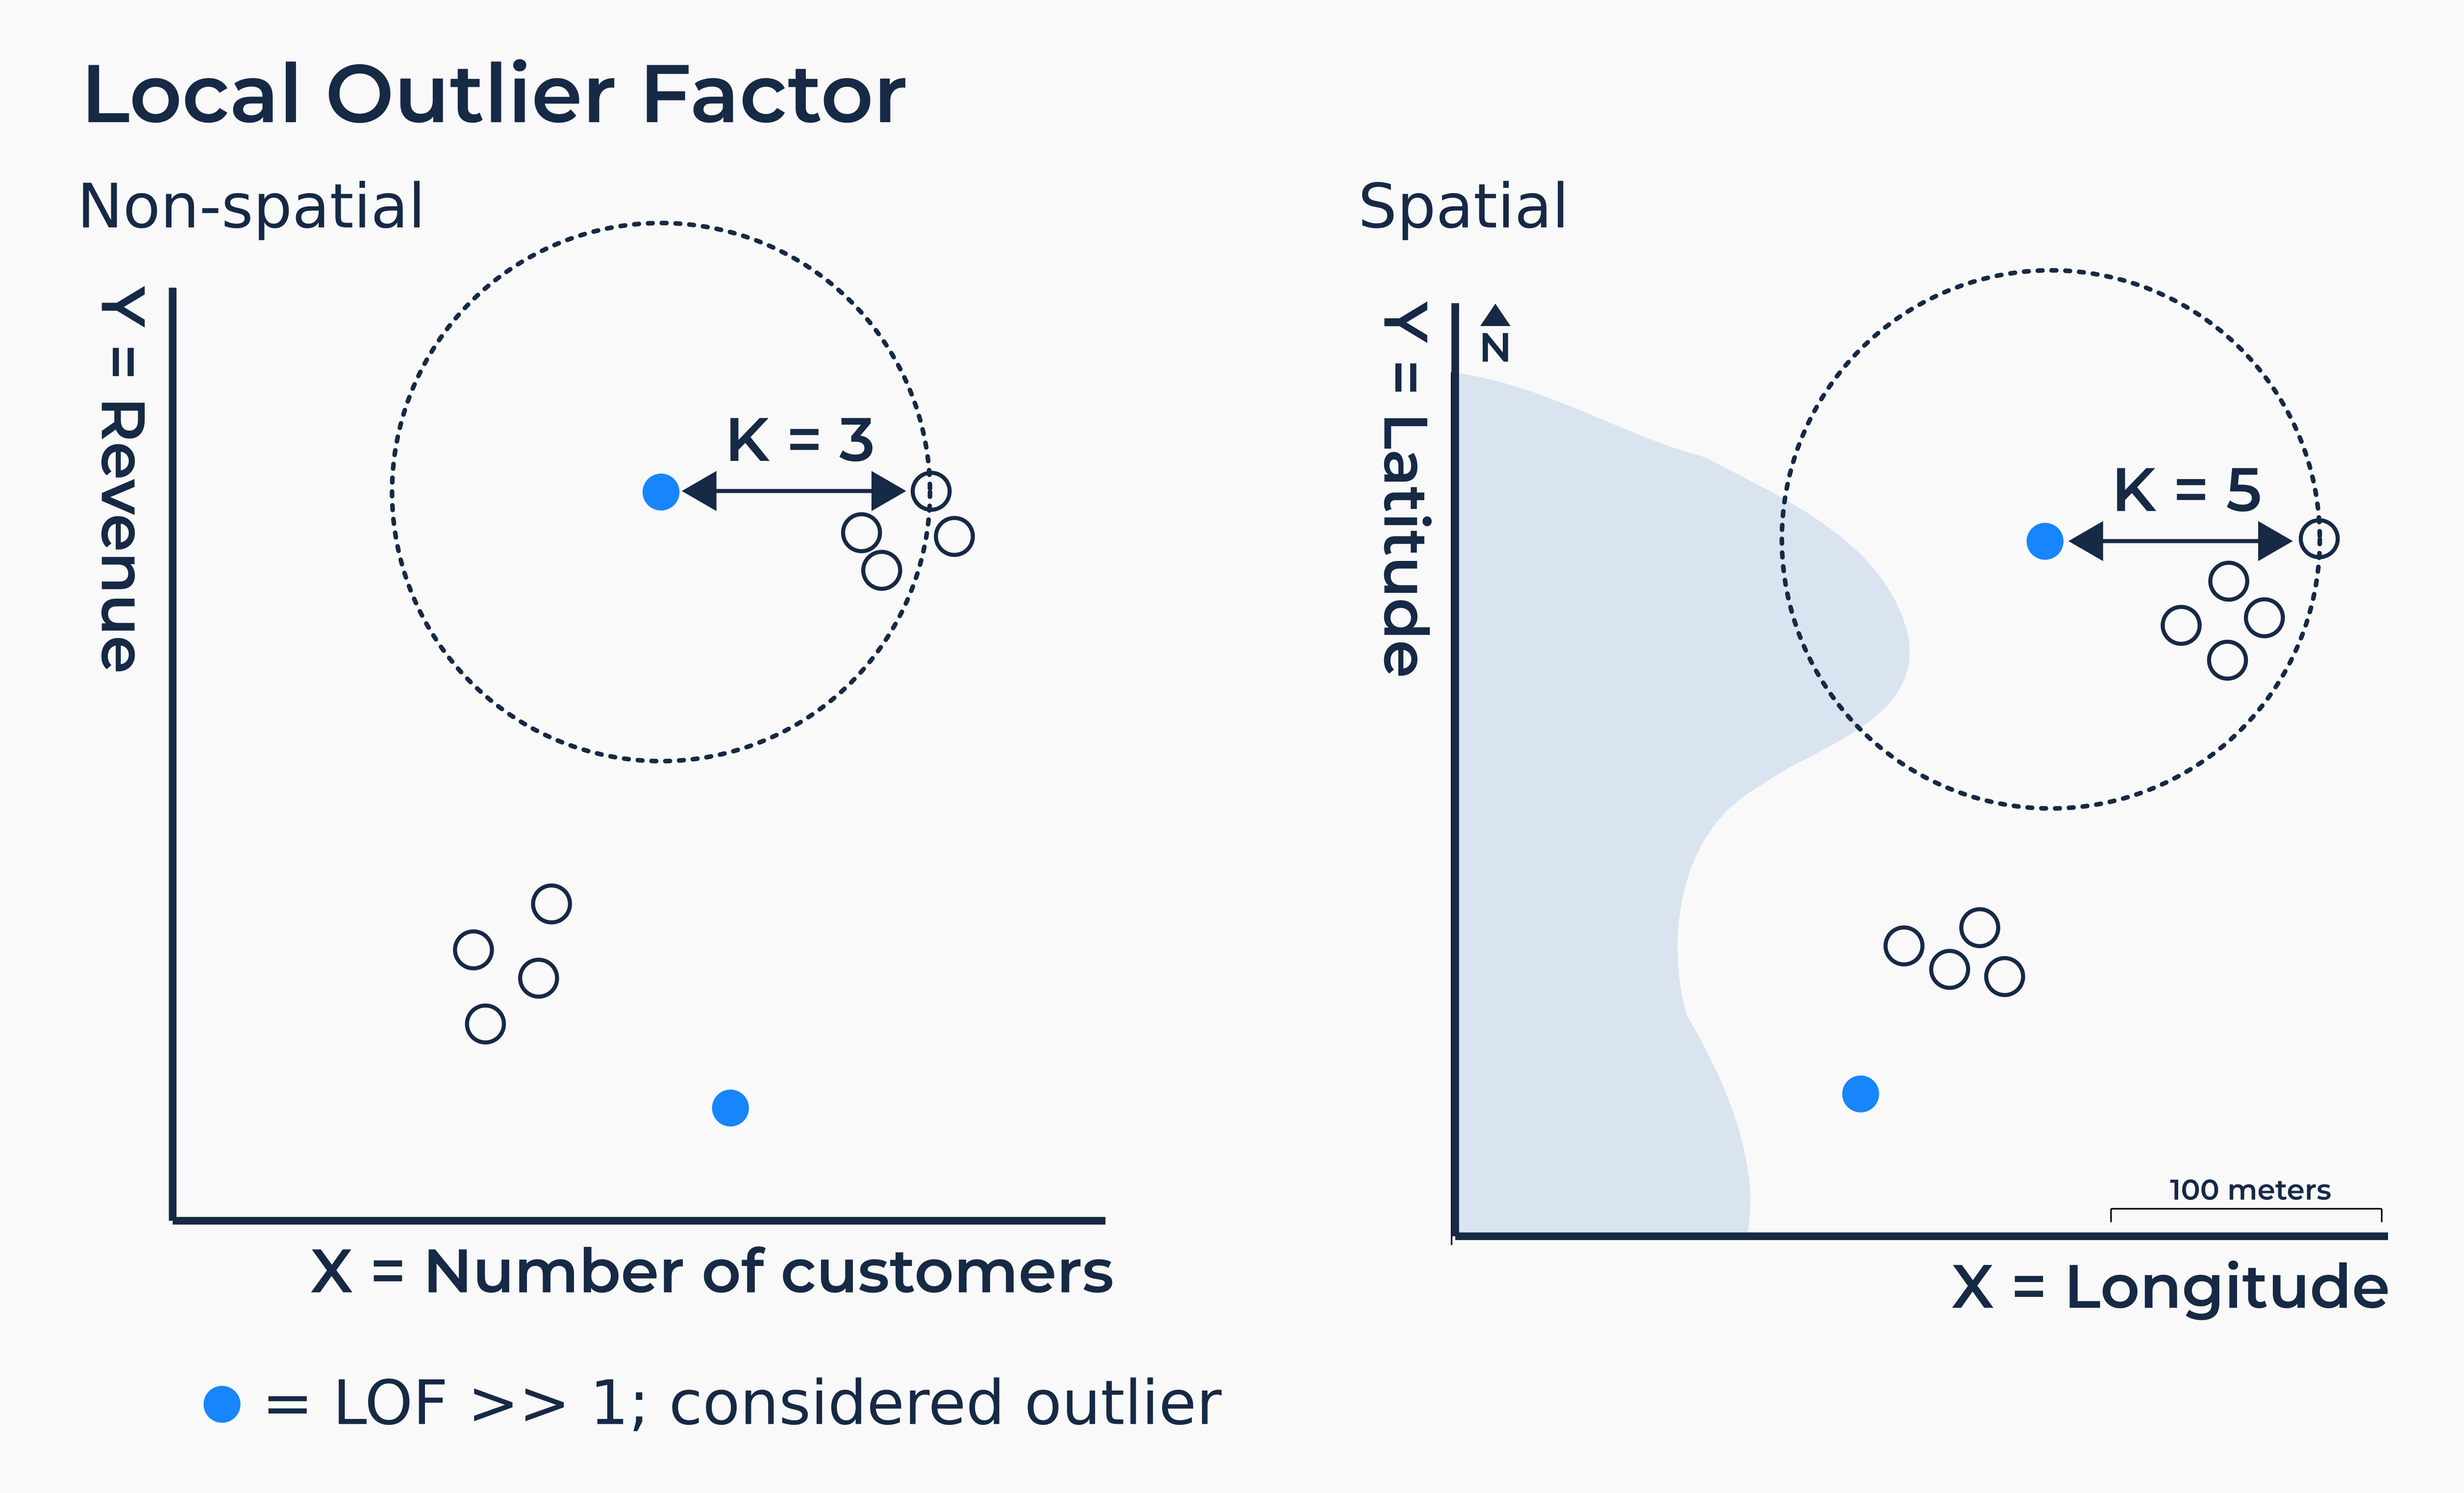
Local Outlier Factor (LOF) is an algorithm used for finding anomalous data points given their deviation in density with respect to their neighbors. If a point has a much lower density than the density of its neighbors then it has a high (>>1) LOF score and can be considered an outlier. For our clothing store example this might look like a store located on the edge of town where the majority are clustered in its core. However if all stores in a town were more sparsely located across it the LOF score would be lower (<<1) as its neighbors are not exhibiting any real clustering behavior. In calculating the LOF users must define k which specifies the k-distance which is the distance of each point to its kth neighbor. A k-value of 5 would take the k-distance as the distance from the point to its 5th nearest neighbor. Smaller k-values produce more localized results but are more sensitive to noise in the data.
Local Outlier Factor for Location Intelligence
In non-spatial forms of data science LOF is calculated by looking at the shape of data across two variables such as revenue and number of customers. This can be visualized as a graph with one variable on both the X and Y axis. This can easily be translated into a spatial calculation; X becomes longitude and Y becomes latitude.
Local Outlier Factor in Action: Clothing Stores in Washington D.C.
As mentioned earlier clothing stores could be expected to exhibit clear spatial clustering. When enough stores form together a shopping destination is formed. For this example let’s take a look at Washington D.C. According to OpenStreetMap (available directly via CARTO’s Data Observatory here) there are 168 clothing stores in Washington D.C. as well as numerous others in neighboring areas such as Bethesda and Alexandria.
#proCARTOtip for analysis like this it’s always a good idea to include locations not just in your study area but around it too. Most administrative boundaries like district lines don’t physically “exist” and don’t impact how customers experience physical space.
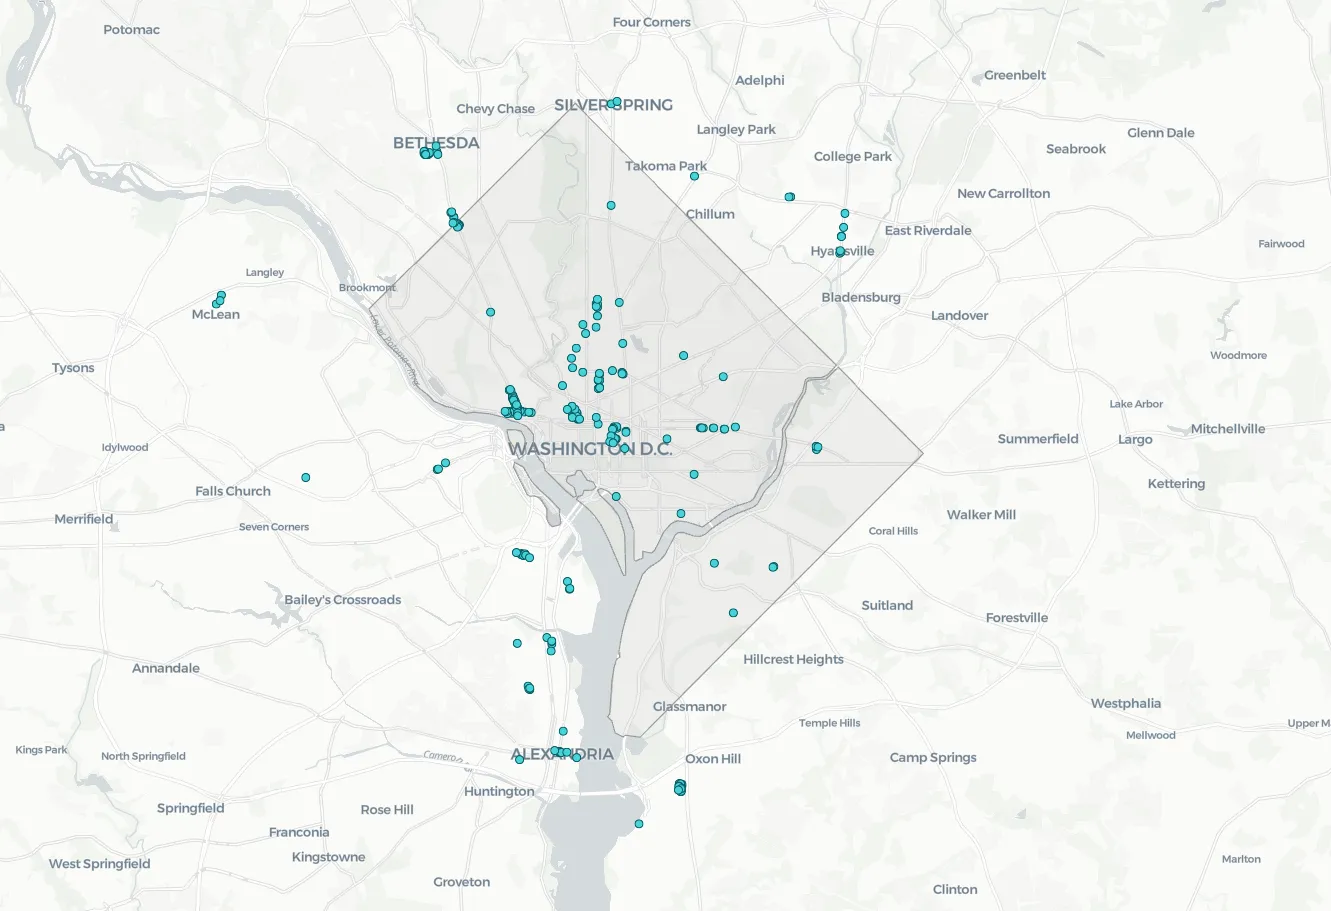
You can already see where some points look like clusters and outliers but there’s so much value in being able to quantify this - so we need LOF!
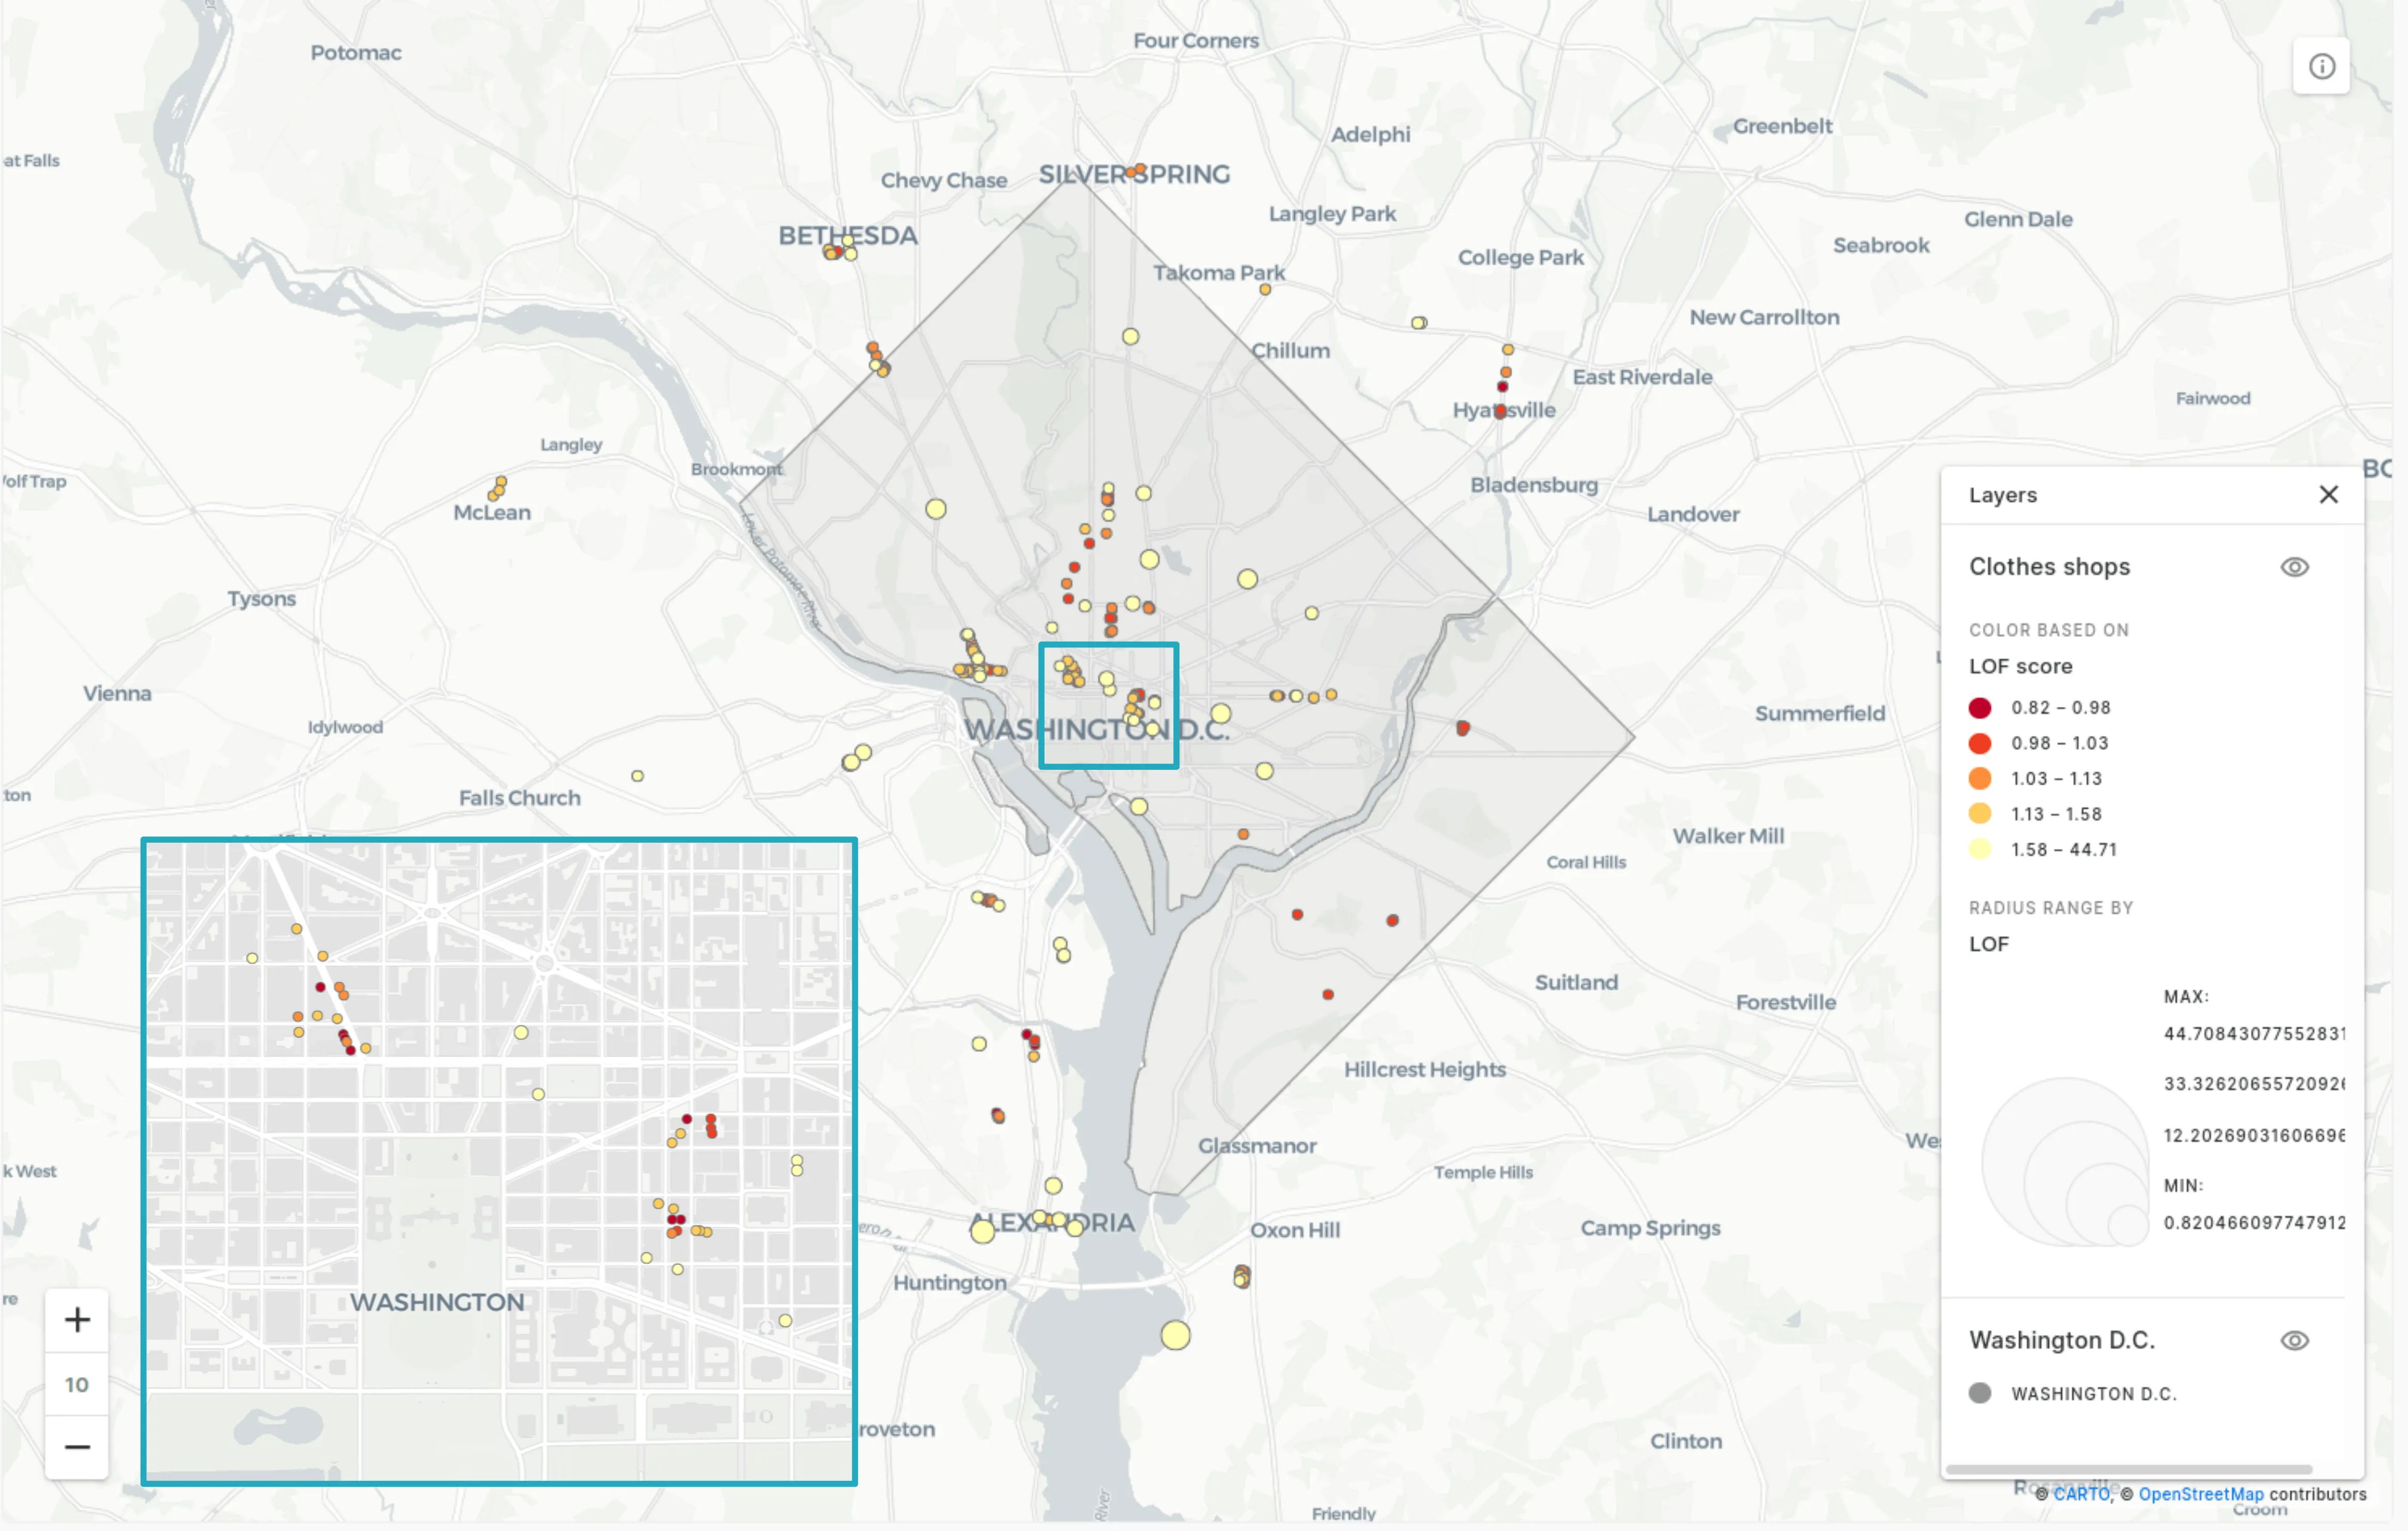
The map above (and this interactive map) shows the results of LOF with a k-number of 3 (keep reading to see the impact of this). Larger yellow circles exhibit a higher LOF score. So how can we interpret these results?
Firstly many of our lowest scoring points can be found in the three areas below - 11th and 1st Downtown Connecticut NW and Wisconsin and Mt NW. This means that these three areas are fairly homogenous in density. It’s also possible to identify “core” and “fringe” areas within these clusters. Stores on the edges of clusters or down side streets have higher LOF scores.
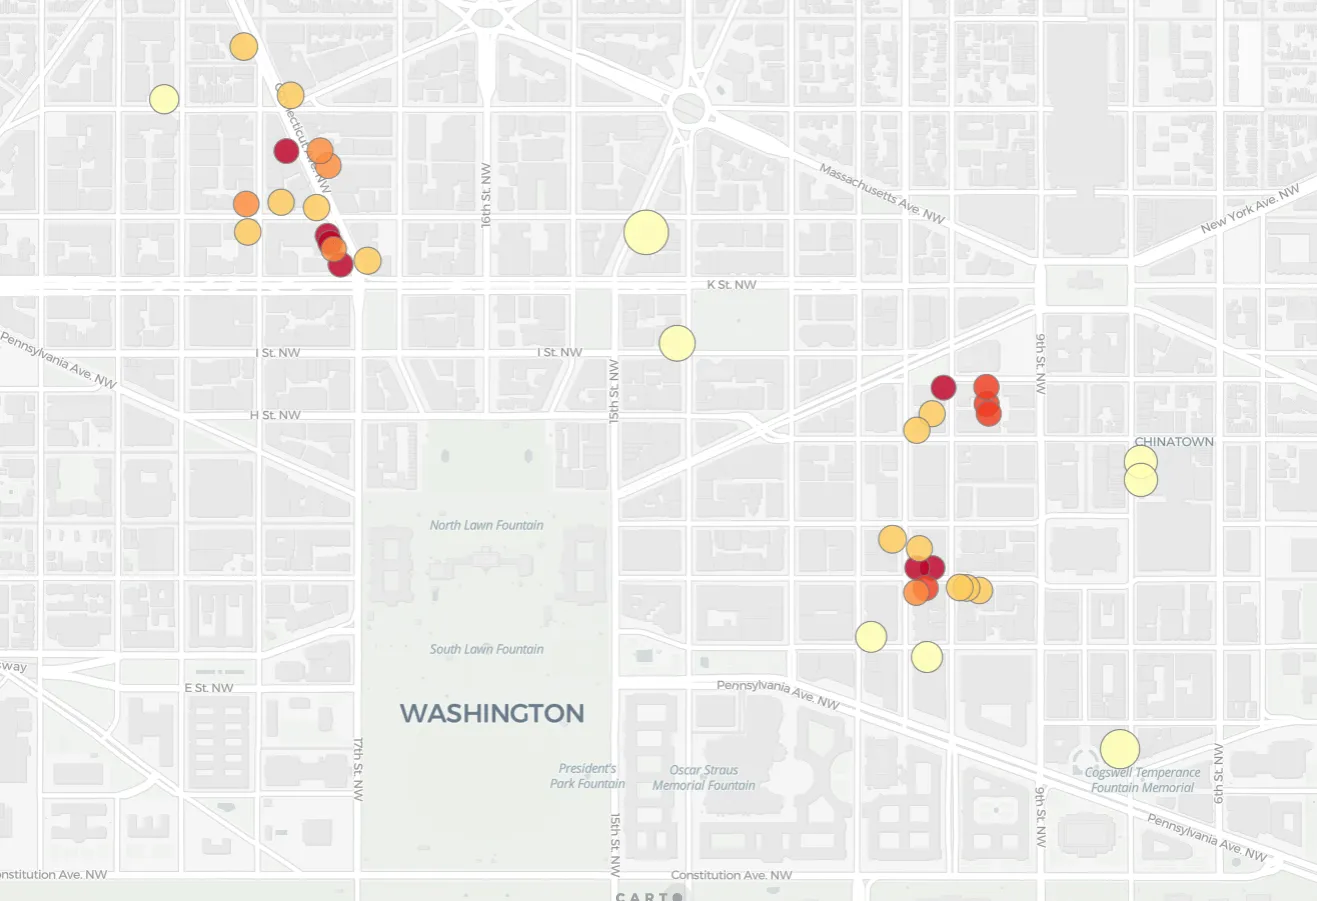
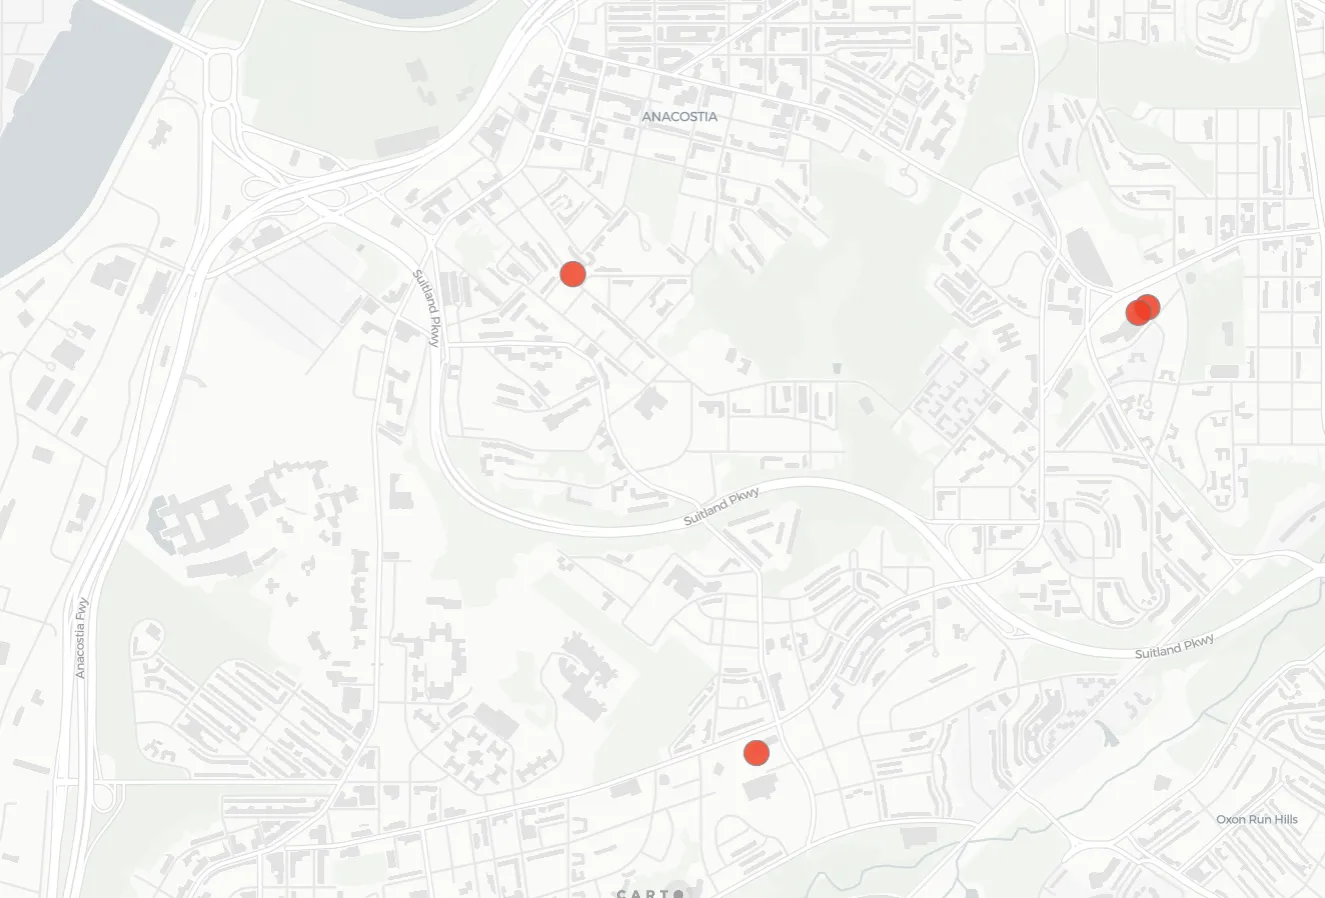
Other similarly low-scoring stores are those in locations where density is still homogenous but low.
Examples of this can be seen to the south east of the District in the more suburban areas of Douglas and Buena Vista. Interestingly it looks like a number of these stores are actually children’s clothing stores which are likely to exhibit different geographic trends to adult stores.
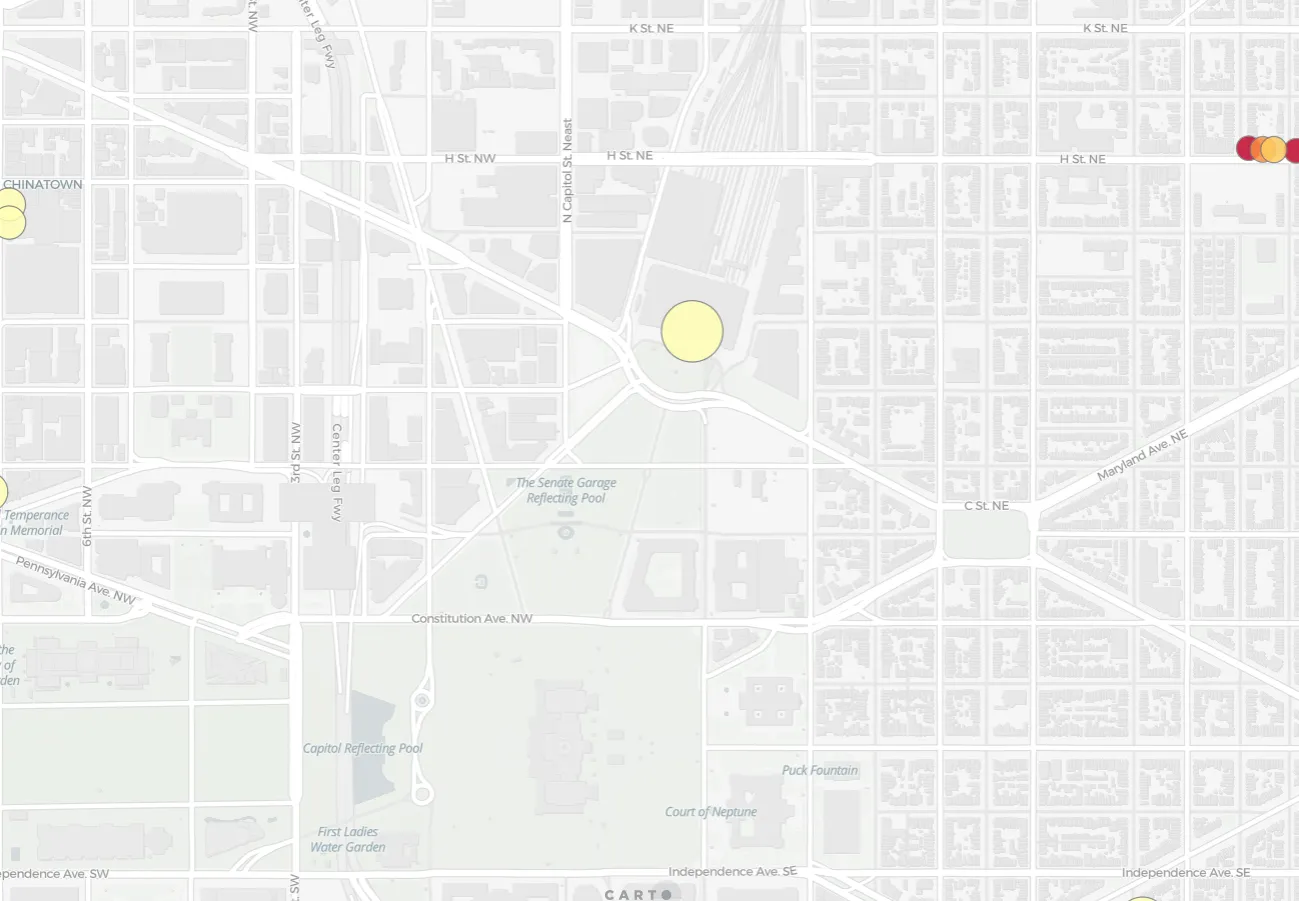
And what about the other end of the scale - the outlying stores?
The store with the highest LOF score of 15.3 is the store in the middle of the map below: Uniqlo in Washington Union Station. The closest nearby stores to it are around the cluster of 11th and 1st Downtown. There is also a smaller linear cluster to the north east along H St. NE. This high score means that the store is located in an area where the typical spatial behavior is a high density of stores but this store is relatively solitary. The strategy behind this store’s location is clearly not “destination shopping ” but rather to capitalize on the high levels of foot traffic at this busy central station. Not to mention people who forgot to pack socks for their trips.
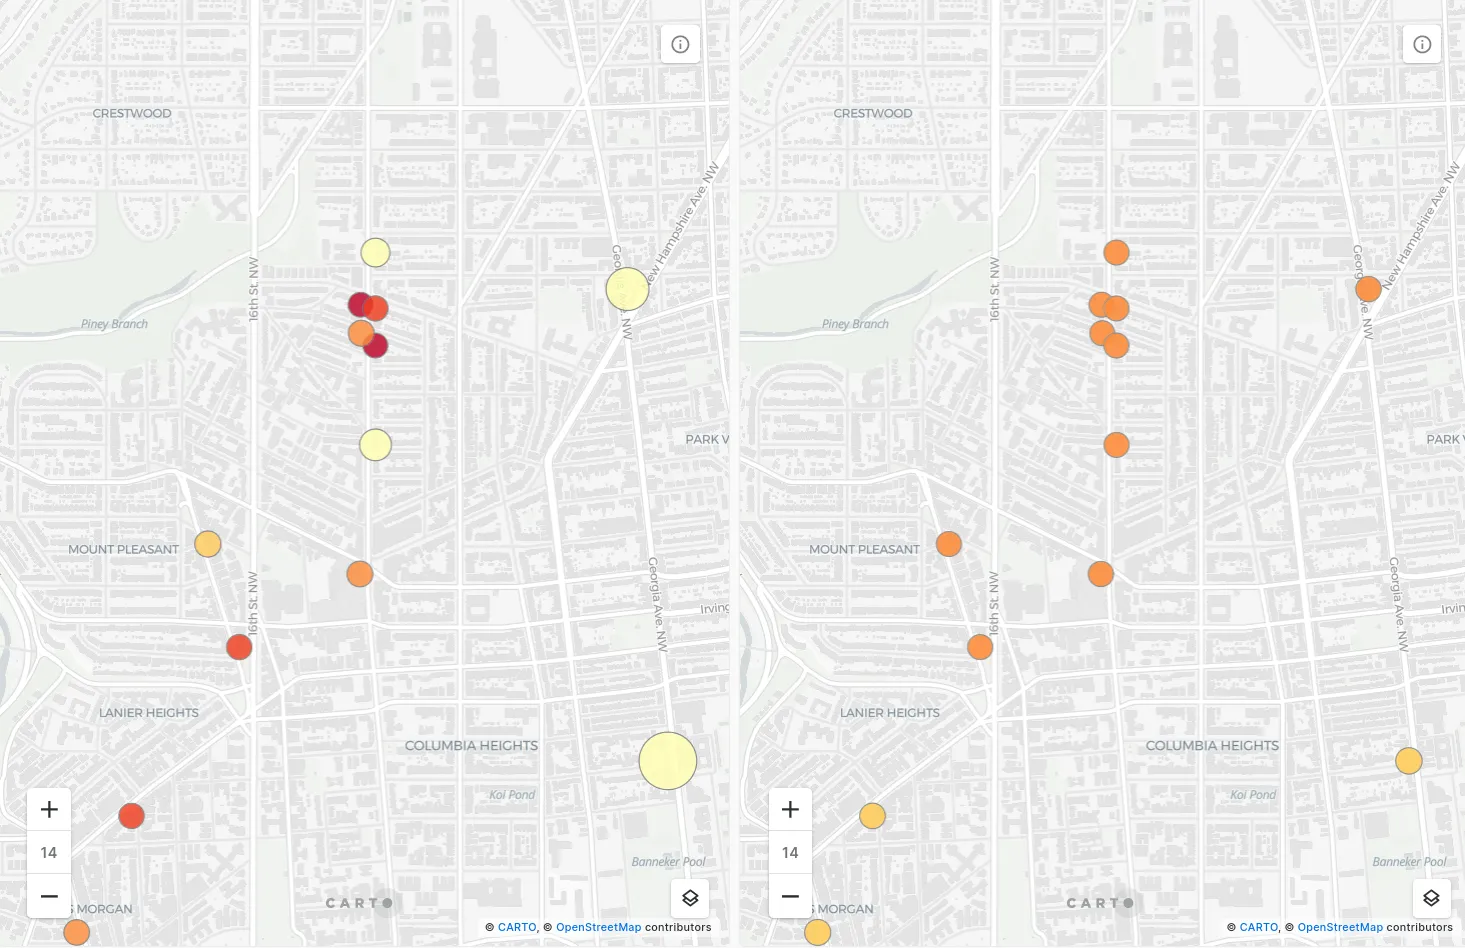
The Impact of K-numbers
As mentioned earlier smaller K-numbers make for much more localized analysis and results. This is exemplified in the maps below; the analysis on the left of the split screen is the result of a K-number of 3 whereas the map on the right is with a K-number of 10. The smaller K-number shows more localized variation including the cluster of 4 shops along 14th St NW. Conversely as the K-number of 10 takes into account stores from further away the result is that all of the stores in view have a more similar mid-range LOF value. This is because their results now consider both the 14th St NW cluster as well as more disparate locations across Mount Pleasant and Columbia Heights.
Behind the Code: How to LOF

CARTO’s cloud native capabilities means that running Local Outlier Factor requires only a straightforward piece of Spatial SQL from the statistics module of CARTO’s Analytics Toolbox. It also doesn’t require you to write the output data anywhere - it can just be run as a query from an array allowing for a seamless data-to-visualization workflow. The syntax is simply:
`carto-un`.statistics. LOF(myarray k-number)
We’ve included a fully worked example below which performs the following operations:
- Defines the study area as the District of Columbia
- Loads all OpenStreetMap clothing shops from the Big Query OpenStreetMap public data warehouse
- Structures this data as an array
- Runs local outlier factor with a k-number of 3
Explore the data - as well as the differences between the results when using different K-numbers - on the interactive map here.
/*01 Define a study area*/
with DC as (SELECT geom  do_label FROM `carto-data.ac_7xhfwyml.sub_carto_geography_usa_county_2019` where do_label = 'District of Columbia')
/*02 Load stores from OpenStreetMap*/
pt as (SELECT distinct st_astext(ST_Centroid(nodes.geometry)) as geomtxt  key  value  osm_id
FROM `bigquery-public-data.geo_openstreetmap.planet_features` AS nodes  DC
INNER JOIN UNNEST(all_tags) AS tags
WHERE ('shop'  'clothes') in (select (key value) from unnest(all_tags)) and key = "name" and st_distance( DC.geom  geometry) <5000)
/*04 Run Local Outlier Factor*/
SELECT *
FROM UNNEST((
    SELECT `carto-un`.carto.LOF(myarray  3)
    FROM (
/*03 Structure points as array*/
        SELECT ARRAY_AGG(STRUCT(format('%08x'  osm_id) geom)) myarray
    FROM (select *  st_geogfromtext(geomtxt) as geom from pt
                  )
    )
))
You can find out more about Local Outlier Factor analysis - as well as the wide range of other statistical techniques such as retailer hotspot analysis available from our Analytics Toolbox.
Are you a retailer wondering how you can use Location Intelligence for more data-driven decision-making? Download our Data-Driven Retail Site Selection Playbook here.