Simpler Data Science Workflows with CARTO + Databricks


In our continuous efforts to make sure CARTO works well with other technologies we’re always assessing how we can improve our customers’ workflows so that they can easily interact with CARTO from other applications and platforms they already use.
Databricks is a widely used platform for data engineering analytics data science and machine learning. It provides collaborative notebooks that support multiple languages and interactive visualizations. In our quest to empower Data Scientists with the best data and analysis we knew integrating our platform with Databricks was the way to go.
The CARTO platform can be integrated with Databricks notebooks through our Direct SQL Connection feature and CARTOframes our Python package. These options are complementary and your choice will depend on your specific use case.
In this blog post we’re going over both options to help you understand when you should choose one or the other.
Data Engineering
Sometimes we have data in our platform whose structure is optimized for a given use case but it is not well suited for other applications. We need to be able to transform the data but changing the structure is sometimes a challenge within relational databases. On the other hand this problem is really easy to solve using a platform like Databricks.
To be able to transform the data we first need to read the data from the CARTO database. In order to do that we must access the database using JDBC to read the CARTO dataset as a Spark dataframe as explained in our Help Center.
Some datasets or database schemas come in wide format so in this case we are going to perform a transformation that is not easy to do with a relational database engine. This transformation is called wide-to-long or sometimes melt. A wide-to-long transformation allows you to structure the database schema in a way that is easy to apply filter operations and make your schema more searchable.
We are going to connect to CARTO from Databricks using the direct connection explained in the above link.
remote_table = spark.read.format("jdbc")\
    .option("url"  "jdbc:postgresql://<ADDRESS_CERTIFICATE>:5432/cartodb") \
    .option("dbtable"  "corona_usa_wide") \
    .option("user"  "<YOUR_USERNAME>") \
    .option("password"  "<YOUR_API_KEY>") \
    .option("ssl"  True) \
    .option("sslmode"  "verify-full" ) \
    .option("sslcert"  "/databricks/driver/client.crt" ) \
    .option("sslkey"  "/databricks/driver/client.key.pk8" ) \
    .option("sslrootcert"  "/databricks/driver/server_ca.pem") \
    .load()
Once we have retrieved the table (we will use one that gives you the COVID-19 cases at the state level in the US) we want to use in the transformation we will have a dataframe like the below one:
remote_table.limit(5).toPandas()
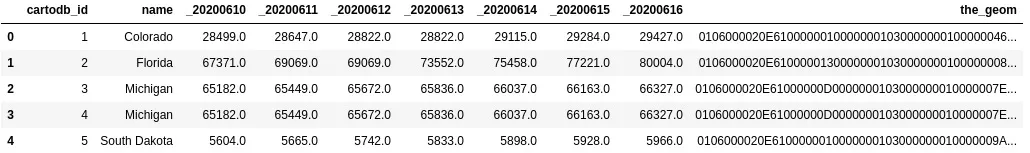
Here as you can see we have the dates of the dataset represented as columns instead of rows. Before doing the transformation we will split the dataframe into data and geometries to make life easier for us later we will join both dataframes.
data = remote_table.drop('the_geom')
geoms = remote_table.select('cartodb_id'  'the_geom')
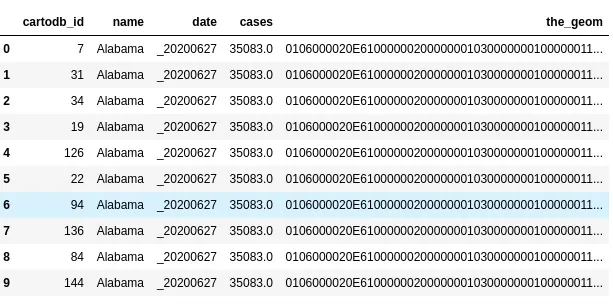
Now we have the data itself without the geometries we are going to apply the wide-to-long transformation and join the geometries which will result in a dataframe like the following:
data_columns = ['_20200610'  '_20200611'  '_20200612'  '_20200613'  '_20200614'  '_20200615'  '_20200616']
data_melted = melt(data  ['cartodb_id'  'name']  data_columns  'date'  'cases')
data_melted_with_geoms = data_melted.alias('data').join(geoms.alias('geoms')  F.col('data.cartodb_id') == F.col('geoms.cartodb_id')).select('data.cartodb_id'  'data.name'  'data.date'  'data.cases'  'geoms.the_geom').dropDuplicates().sort(['name'  'date'])
Finally you can save the changes made to CARTO using again the direct connection.
data_melted_with_geoms.write.format("jdbc")\
  .option("url"  "jdbc:postgresql://<ADDRESS_CERTIFICATE>.carto.com:5432/cartodb") \
  .option("dbtable"  "corona_usa_long") \
  .option("user"  "<YOUR_USERNAME>") \
  .option("password"  "<YOUR_API_KEY>") \
  .option("ssl"  True) \
  .option("sslmode"  "verify-full" ) \
  .option("sslcert"  "/databricks/driver/client.crt" ) \
  .option("sslkey"  "/databricks/driver/client.key.pk8" ) \
  .option("sslrootcert"  "/databricks/driver/server_ca.pem") \
  .save()
We recommend this approach (Direct SQL Connection) when scalability is an issue because you can distribute data and operations within your cluster.
Visualization
Our CARTOframes Python package allows you to perform spatial analysis enrich your datasets and create stunning visualizations right in your notebook. This package can be installed within your Databricks notebook as you would do with any other Python package using PyPI.
%sh pip install cartoframes
Once you have installed the package you can set up your credentials for accessing CARTO and you can easily access your datasets.
from cartoframes.auth import set_default_credentials
set_default_credentials(username='<YOUR_USERNAME>'  api_key='<YOUR_API_KEY>')
You can also create a GeoPandas dataframe from our platform and visualize it in a very easy way.
from cartoframes import read_carto
starbucks_locations = read_carto("starbucks_locations")
Map(Layer(starbucks_locations))
Then you can apply geoprocessing operations using for example the geocoding data services or you can enrich your datasets using the information from CARTO Data Observatory.
from cartoframes.data.services import Isolines
iso_service = Isolines()
starbucks_locations_isochrones  isochrones_metadata = iso_service.isochrones(starbucks_locations  [300]  mode='walk')
Map(Layer(starbucks_locations_isochrones))
We recommend using CARTOframes if your main goal is to visualize geospatial data or scalability is not an issue because you are not working with a big dataset.
How to get started
These features are available right now to all enterprise customers. To start using the Direct SQL Connection just go to the settings page in your dashboard and follow the instructions to set up a new connection. To get started with CARTOframes you can read the Quickstart guide. If you encounter any issues just reach out to your Customer Success Manager.
Want to connect CARTO to your existing stack?