

Doorda in CARTO: UK Demographics, Socio-economic Data, and More


You could say that understanding the composition of a city is key to understanding the nature and behaviors of its citizens. Or perhaps it's the other way around. But modern data streams have made the "chicken or the egg" debate seen here a moot point. With deep granular cross-category data you can have an understanding of a city and its citizens all at once.
Providing this insight is the key reason behind CARTO's new partnership with Doorda. Together we are excited to provide trusted business-ready data for the whole of the UK. Doorda produces unique datasets within broad interlinked categories by processing and consolidating from original sources such as HMRC Ordnance Survey Land Registry Local Authorities and Companies House.
Their data is available at both the postcode level and Output Area level. Output Areas (OA) are the UK's smallest census area with populations not exceeding 625 people or 250 households. There are 171 372 OAs in England and 10 036 in Wales. In Scotland similar regions are named Data Zones while in Northern Ireland they are referred to as SAs.
Making these consolidated datasets available in the CARTO Data Observatory allows clients to accelerate insight and innovation and to access a unique competitive advantage. Since Doorda has already standardized these thousands of datasets users will be able to focus immediately on analysis and decision-making while avoiding the repeated cost and risk of finding and preparing data.
Available datasets from Doorda now available in CARTO include:
- Sociodemographics
- Occupation Data
- Health Data
- Crime records
- Household Income and Household Spend in different product categories
- Property Data
Currently available data is from their most recent release - data from previous years is available upon request.
{% include icons/icon-bookmark.svg %} Download our free eBook: Becoming a Spatial Data Scientist
UK Datasets - Informed Spatial Analysis Across Use Cases
Broad datasets such as those provided by Doorda range from segmentation for targeted marketing to business risk analysis to health analysis for insurance models and actuarial purposes to retail location planning and much more..
In order to illustrate the power of the Doorda data when used in conjunction with CARTO technology we are going to perform a specific analysis using some of the datasets mentioned above. Our goal is to analyze the evolution of the residential property industry in the city of London for the last 20 years.
Analyzing Residential Property with Doorda Data
Recently government initiatives have aimed to increase the number of residential properties in town centers. The goal of this legislation is to reduce the impact of changes to high street whilst encouraging the use of disused commercial properties. But as prices rise it can be difficult to know if these policies have been successful.
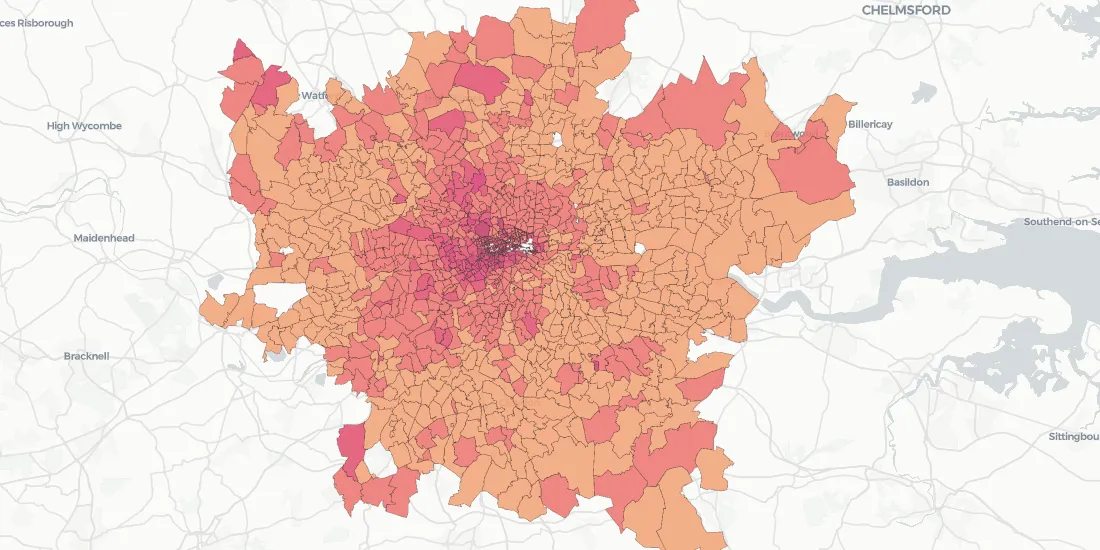
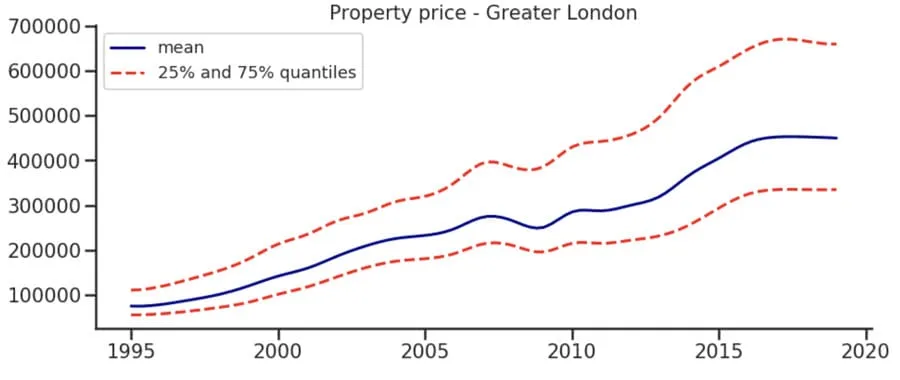
Residential property prices in London have been increasing steadily in the last 20 years as seen in the below graph and animated map:
In the UK while income has traditionally been one of the biggest drivers of property sales in recent years buying property is beyond the reach of most locals. This is due in large part to foreign speculators and landlords driving up prices while salaries have not increased rapidly enough to keep up with the increase in property prices. This divergence is probably the largest in the London area. With most people currently able to get a mortgage 5x times their net annual income in this area the property price to mortgage ratio (computed from 2012 2014 and 2016 averages) is consistently above 1 (and less than 2 only for postcode districts in some suburban areas especially in the North East).
Looking at the above map it's no wonder why first-time home buyers are being cut off from buying a home of their own.
UK Crime Data - Spatial Data Science Deep Dive
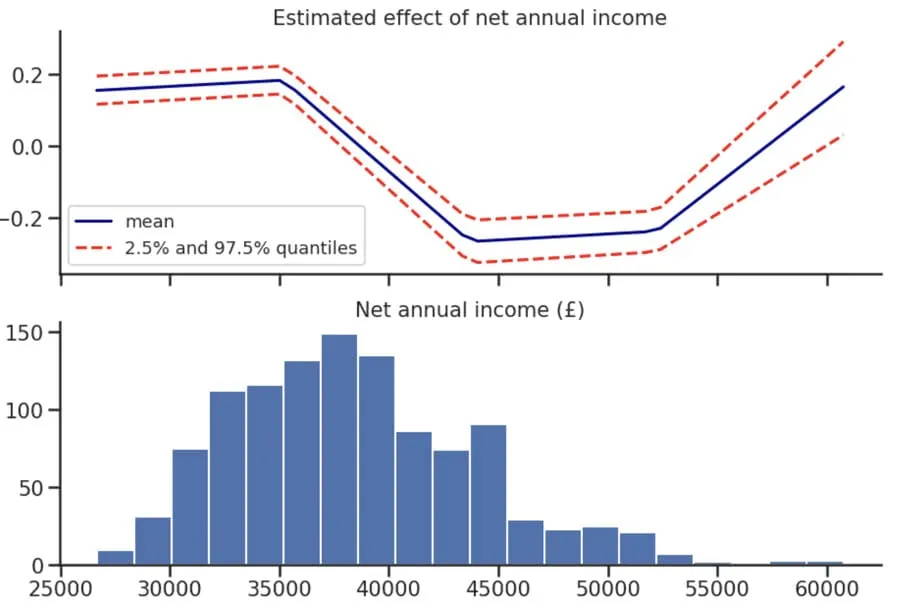
Geographical segregation based on salaries may also have a distinct macrosocial effect on crime. For example from reports of crime locations we can investigate the link between the net annual income and the rate of robberies as an indicator of social distress. Given the observed number of robberies in 2012 2014 and 2016 by postcode district ($$y_i%0$$ $$i = 1 \dots N%0$$) and the corresponding average net annual income ($$x_i%0$$) we fitted a Bayesian spatial model to estimate the relative risk of robbery.
The observed counts $$y_i%0$$ were assumed to be conditionally independent Poisson variables with mean $$E_i \ exp(\eta_i)%0$$ where $$E_i%0$$ is the exposure for postcode district $$i%0$$ here given by the total population. For the popular BYM model (Besag York and Mollié 1991) the log relative risk is then given by

where $$\mu%0$$ is the overall intercept and $$f%0$$ measures any possibly non-linear effect of the region-specific covariates. $$v%0$$ is a zero-mean Gaussian representing an unstructured random effect while $$u%0$$ is a spatial component saying that nearby regions are similar and is given by a first-order intrinsic Gaussian Markov random field model (Rue and Held 2005 Chapter 3). Here following Simpson et al. (2017) we used a different parameterization of the BYM model which makes parameters interpretable and facilitates the assignment of meaningful Penalized Complexity (PC) priors. The non-linear effect of the covariates was obtained by setting a random walk of order 2 prior on the coefficients and to help reduce spatial confounding a linear orthogonality constraint was imposed between the covariate and the IID and the spatial random effects.
As expected the dependence of the risk of robbery on the net annual income is non-linear decreasing for mid-income regions which amounts to the majority of the London area and increasing again for very rich districts.
We can also plot the mean of the estimated risk of robbery in Greater London for residential areas (with population larger than 100): as expected areas with larger risk are concentrated not only in central London but also in suburban areas in the South and North-East.
Learn more about CARTO's location data streams today and start incorporating data from Doorda and other high-quality data sets into your models and spatial analyses.


