

Black Friday Analysis: Why Retailers Should Pay Attention


Shopping in-store has steadily become less popular since online shopping experiences have improved and offered more convenience for consumers. As SafeGraph explored last year the shift to eCommerce was expedited between 2019 and 2020 due to COVID-19. This shift was highlighted when the biggest retail day of the year Black Friday broke the record for most online sales in its history.
Leading into this year’s Black Friday, there was much debate as to whether the move to online shopping would show the same growth or if rates would slow. Influences such as supply chain issues and a yearning to revert back to pre-pandemic traditions caused some to believe rates would slow. But many people have predicted levels would stay the same, if not increase due to the convenience of shopping online and ongoing concerns over COVID-19. In a poll amongst our employees, the vast majority expected growth rates for eCommerce to slow in 2021. So, we decided to use SafeGraph’s data, visualized in CARTO’s platform, to confirm, or deny, our assumptions.
In this blog (originally published on Safegraph’s website), we explore Black Friday trends in 2021 in four US cities as compared to 2019 and 2020. To examine trends in large and midsize cities, we chose Chicago, Los Angeles, Raleigh, and Buffalo. Using hot spot analysis and SafeGraph foot traffic data, we analyze different categories and brands of points of interest (POI), such as Walmart, and explain why this analysis is an important tool for retailers as they evaluate holiday sales performance.
Using Advanced Analytics to drive Brick & Mortar Retail Planning?
Download our free playbook for Retail Site SelectionHot Spot Analysis of 2021 Black Friday Shopping Activity
What is hot spot analysis?
Hot spot analysis, also known as heat mapping uses colors or shades to represent different values or value ranges. It presents these values and ranges as a continuous spectrum rather than as discrete cells constrained by geographical or political boundaries. In this way a heat map is useful for more precisely visualizing patterns of high (“hot spots”) and low concentrations of a variable. This made it the ideal visualization method for our analysis of Black Friday shopping activity.
What we did
To identify hot spots of Black Friday shopping activity in our four cities, we ran a Getis-Ord statistical analysis on the sum of all visits to POIs within each cell in SafeGraph Patterns. This allowed us to compare neighboring values and pinpoint clusters of activity. The Getis-Ord index gives us an idea of how similar the value of a cell (in this case, H3 cells representing number of visits) is with those around it. A high value means that that cell and its neighboring cells have a value above the average of the city.
First we calculated the quantile 90 of the Getis-Ord values in the cells. Then we computed the H3 zoom 7 cell to which each of the H3 zoom 9 cells belongs. We then conclude that an H3 zoom 7 cell is a hot spot if the majority of all the H3 zoom 9 cells it contains has a Getis-Ord index greater than the quantile 90 computed before. Zoom 9 cells let us find the smaller hot spots and then we locate the larger ones by finding where many small hot spots are clustered together.
Once we determined the hot spots of activity for each city, we moved on to identify the types of POIs most visited during this timeframe in each city.
POI Category Analysis of 2021 Black Friday Shopping Activity
Point of interest categorization
SafeGraph uses the North American Industry Classification System (NAICS) developed by the US Census Bureau to categorize points of interest. There are over 200 categories of POIs, but for the purpose of this analysis, we needed to identify the most compelling for a Black Friday analysis.
What we did
To select the most relevant POIs, we grouped them by category and ordered them by total number of visits using SafeGraph foot traffic data. Below is an example of our results for Chicago where:
- N = number of POIs of that category
- pctg = percentage of POIs of that category
- pctg_cum_sum = cumulative sum of percentages
- sum_visits: sum of raw_visit_counts for all POIs in each category
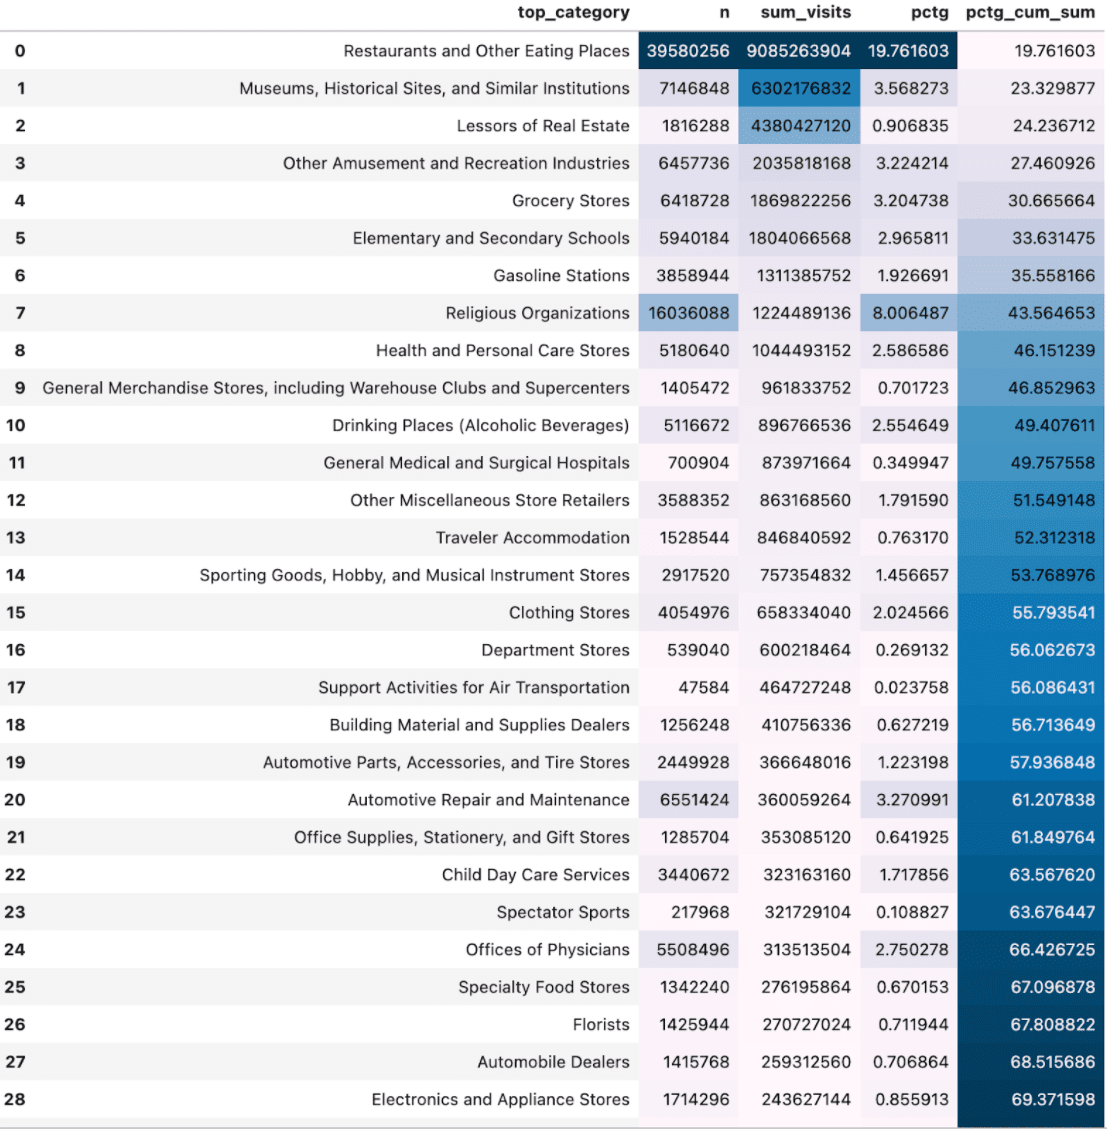
These results helped us determine the following categories as relevant to our POI analysis:
- 'Grocery Stores'
- 'Clothing Stores'
- 'Sporting Goods Hobby and Musical Instrument Stores'
- 'General Merchandise Stores including Warehouse Clubs and Supercenters'
- 'Department Stores'
- 'Electronics and Appliance Stores'
To analyze Black Friday foot traffic we look at POIs from only those six categories that fall within the hot spots we identified earlier.
Overall Black Friday Shopping Activity in 2019 2020 and 2021
As suspected the results of this analysis highlight the drastic shift away from shopping in-store during the peak of the pandemic. However, we have learned that trends in 2021 are rebounding, though not quite to the numbers in 2019.
The graph below shows the total visitors to POIs in each hot spot during the week of Black Friday. Each city shows a stark decline in the number of visitors from 2019 to 2020. Between 2020 and 2021 the total number of visitors increased in each city. The measured visitor count in Buffalo actually surpassed 2019 levels.
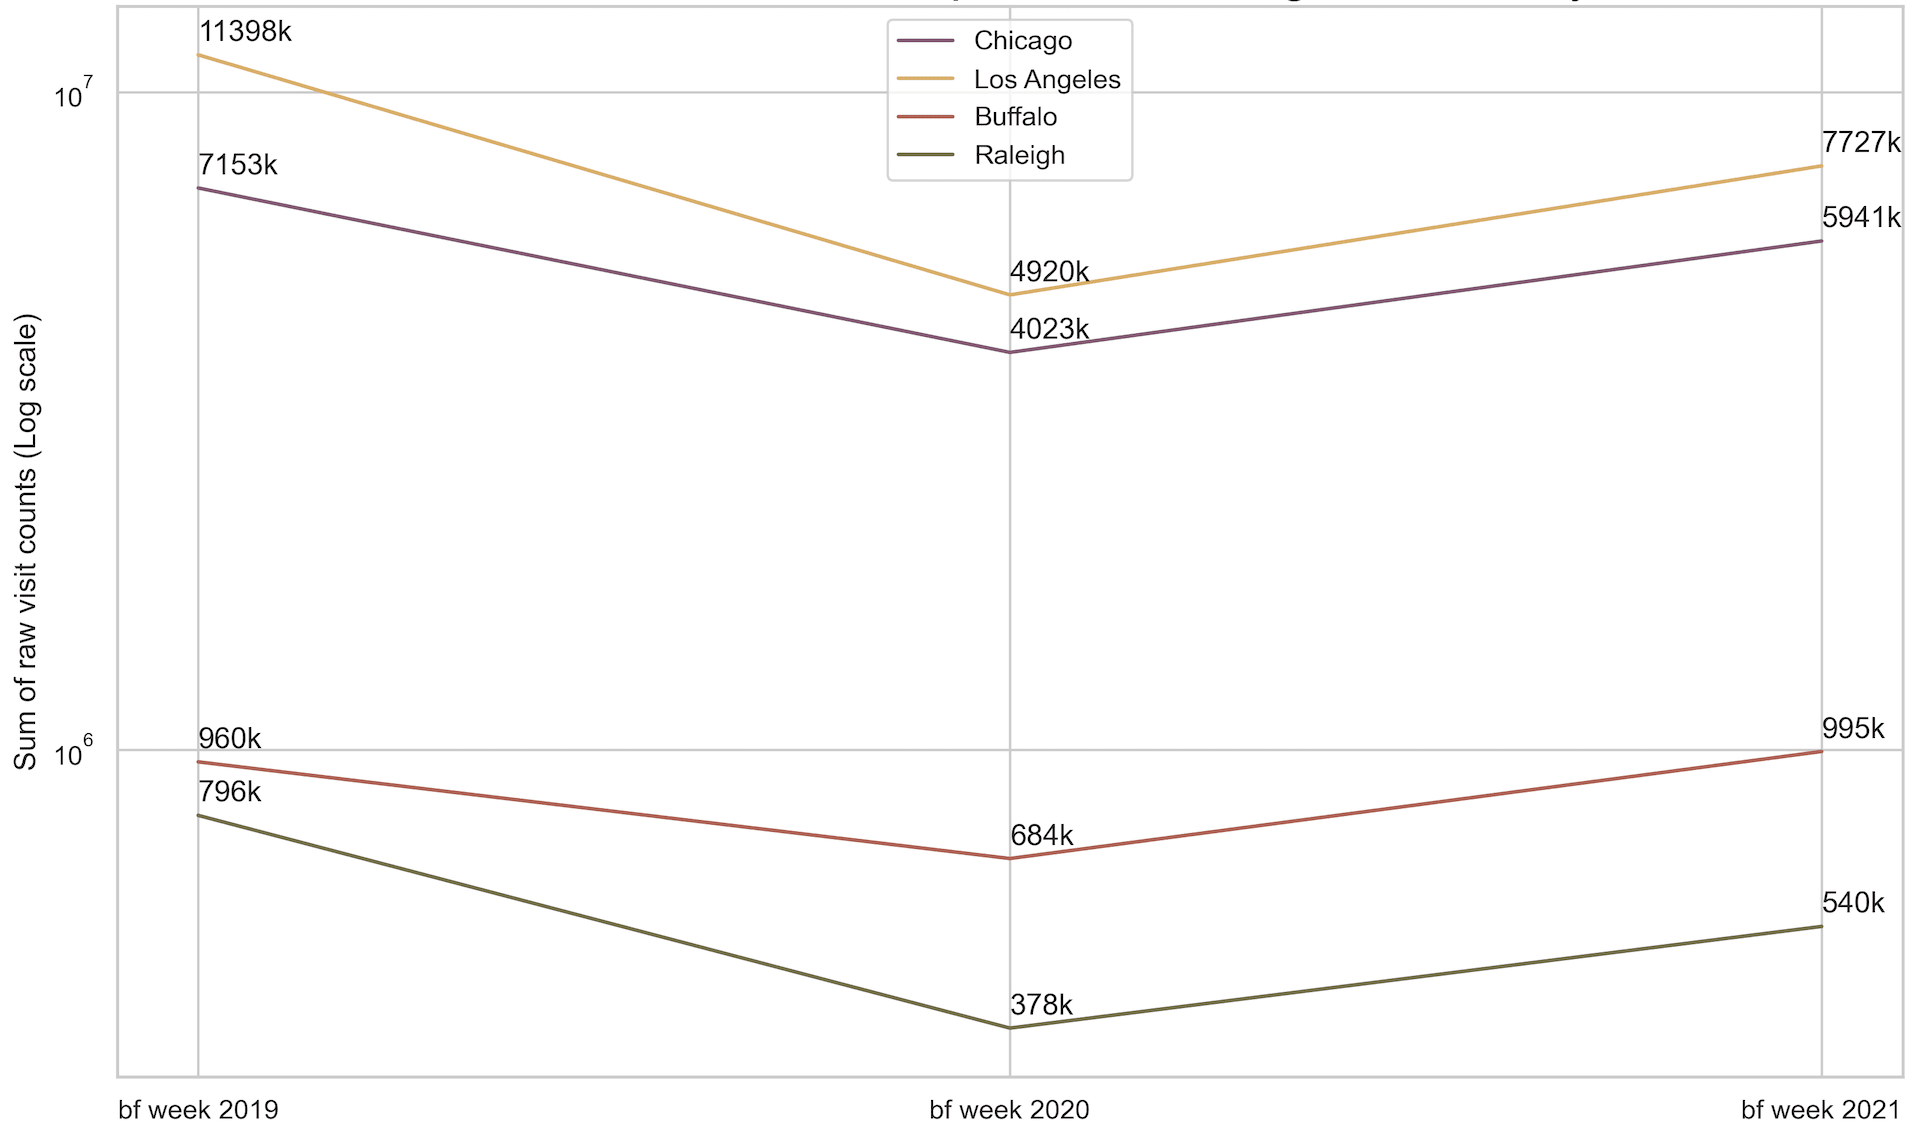
Total visitors measured in hot spot areas during Black Friday week
The average distance from home for people visiting the POIs in these hot spots is greater in larger cities like Chicago and Los Angeles and less in smaller cities like Buffalo and Raleigh. This may be attributed to larger cities being more popular and offering a larger variety or retailers spread throughout the city. During 2020 the average distance from home normalized between all four cities as seen below. In 2021 both larger cities once again experienced an increase in the average distance from home for visitors. Interestingly both smaller cities experienced a decrease during the same period of time.
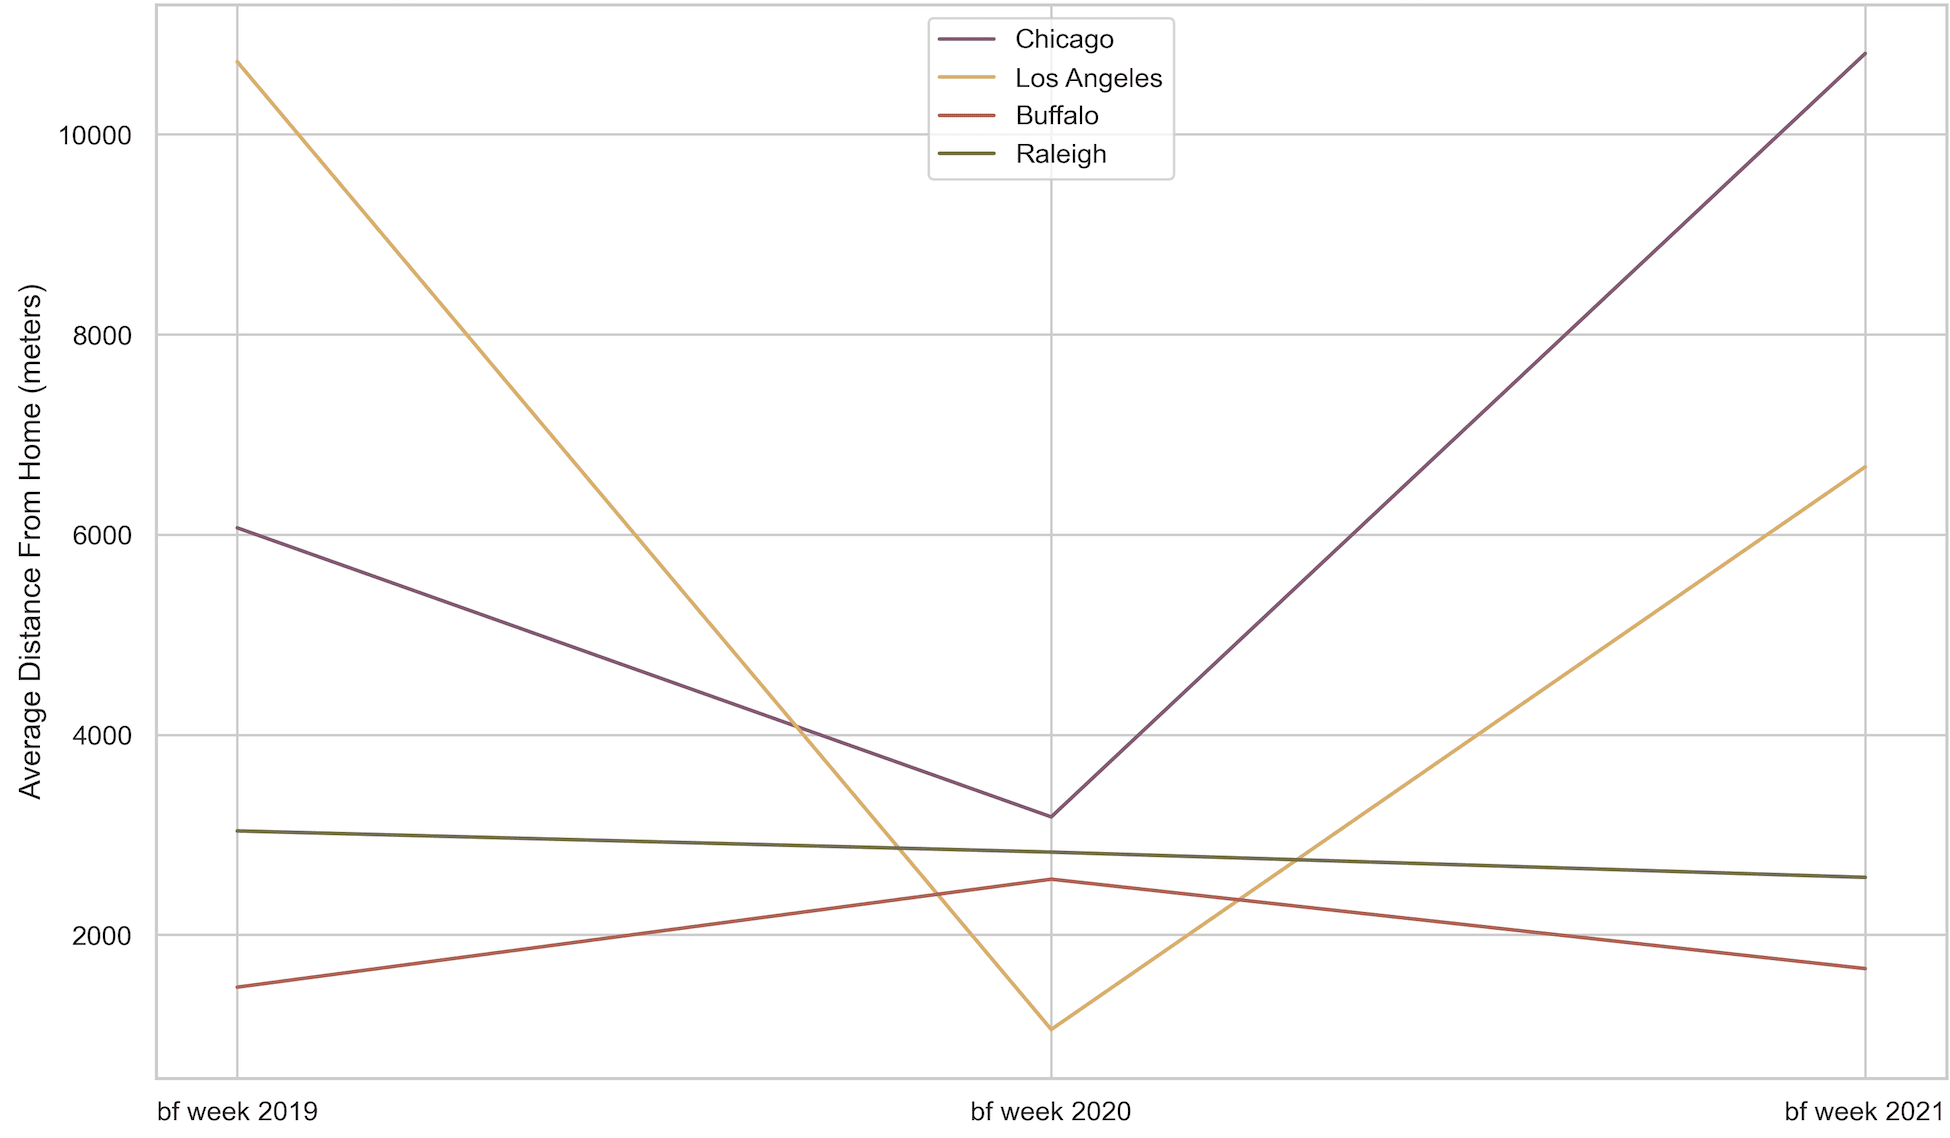
Average distance from home in hot spot areas during Black Friday week
The average time spent at POIs within hot spots has also increased since 2020 in Chicago, Los Angeles, and Raleigh although the trend looks different in each city. Buffalo, being the outlier, showed a decrease in dwell time at POIs between 2020 and 2021.
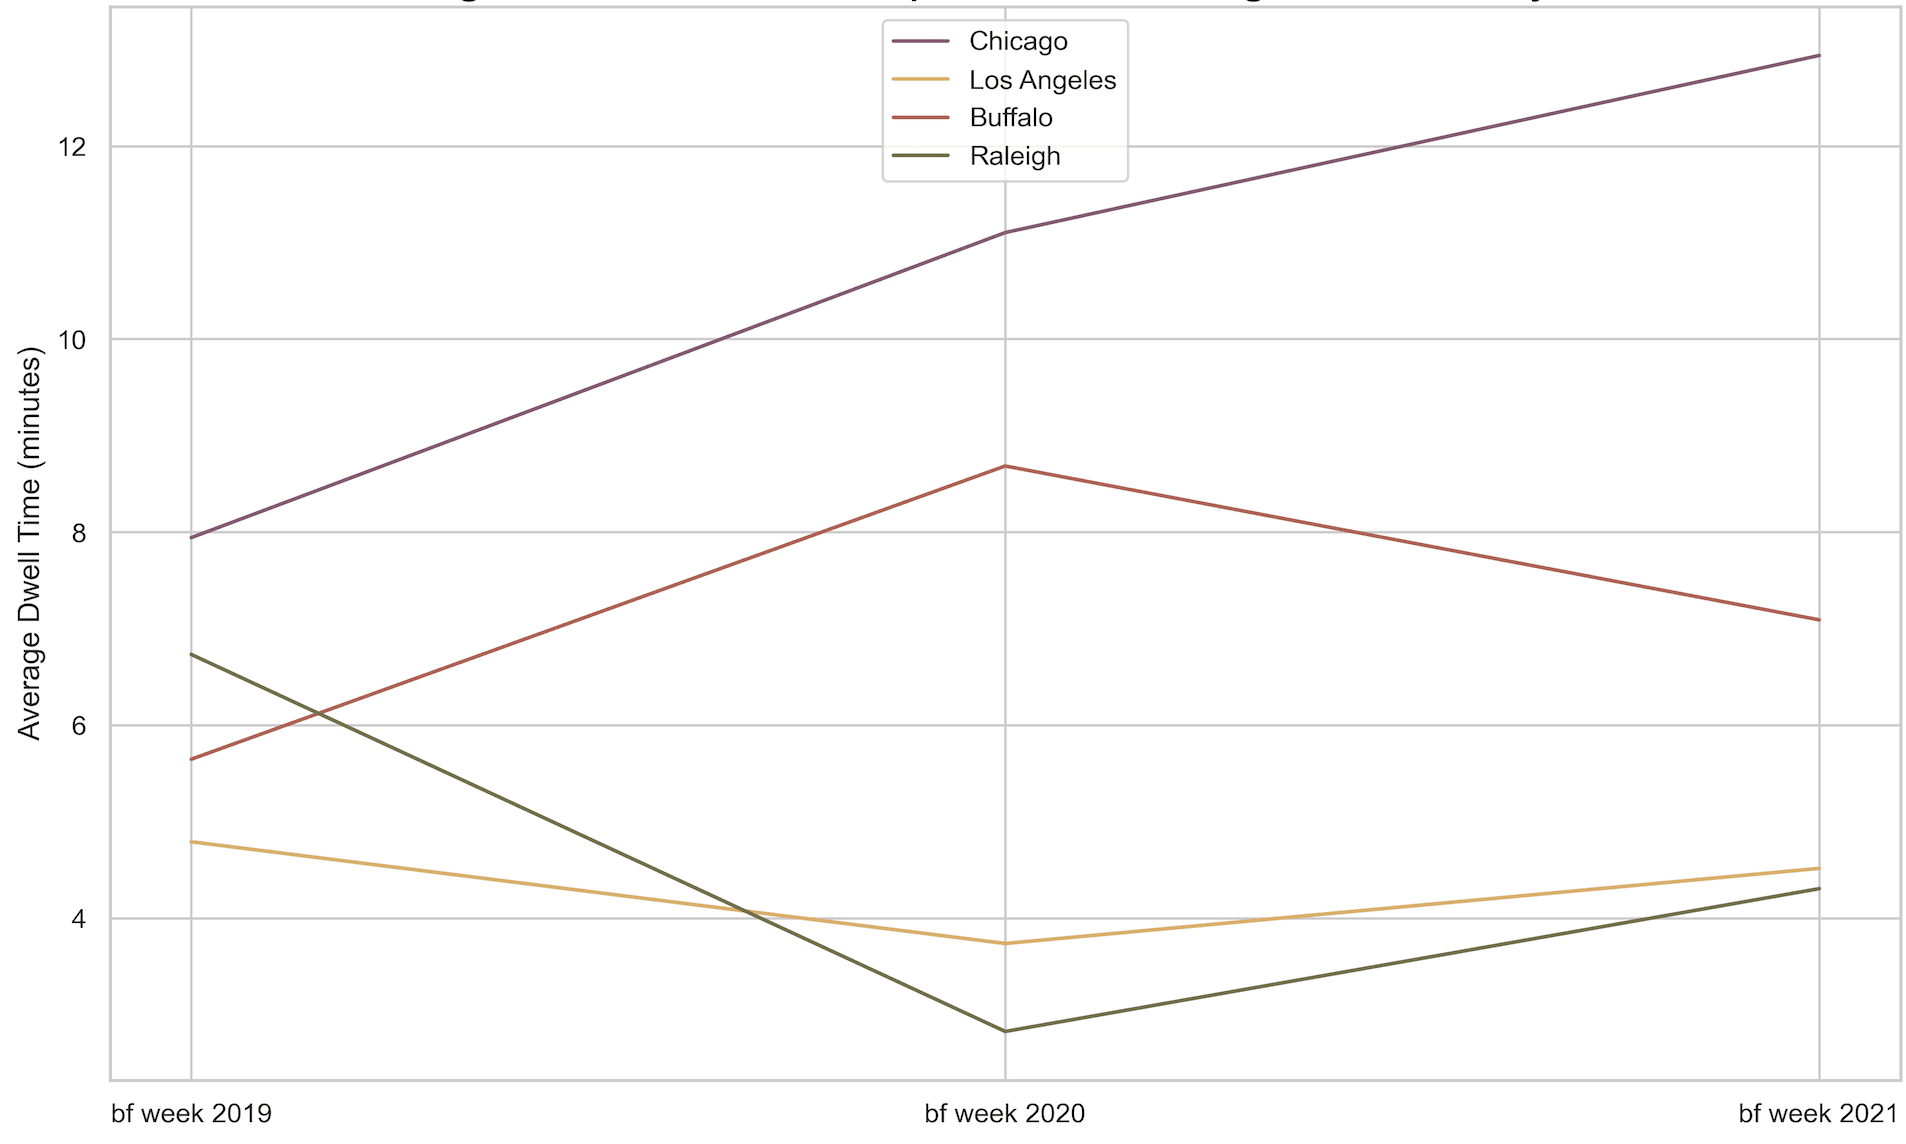
Average dwell time in hot spot areas during Black Friday week
Walmart Black Friday Shopping Activity in 2019 2020 and 2021
To see more specifically how Black Friday shopping activity differed across 2019 2020 and 2021, we looked at foot traffic to Walmarts in each of our four cities on those days. We did this by analyzing the visitor_home_cbgs column in SafeGraph Patterns to identify the home census block group of visitors to Walmarts on each year’s Black Friday.
Evolution of Walmart Visitors on Black Friday 2019-2021 - Chicago
Evolution of Walmart Visitors on Black Friday 2019-2021 - Los Angeles
Evolution of Walmart Visitors on Black Friday 2019-2021 - Raleigh
Evolution of Walmart Visitors on Black Friday 2019-2021 - Buffalo
In each city, we see that visits to Walmarts on Black Friday decreased in 2020 and increased in 2021 but not to the same pre-pandemic levels seen in 2019. We can also see that in 2020 and 2021 Walmart Black Friday shoppers did not travel as far from home as they did in 2019. The home census block groups of Black Friday shoppers were closer in proximity to the Walmarts visited in 2020 and 2021 than they were in 2019 echoing the results of our larger study including all brands within the chosen categories and hot spots.
Analyzing Black Friday’s Role in a Retailer’s Year
Looking at 2019 and 2020 data beyond just Black Friday consumer shopping trends emerge that can help retailers predict how the rest of the holiday shopping season will unfold. In 2019 and 2020 Black Friday was not the only time period with a significant spike in foot traffic to our six categories of retailers. The entire holiday season is a busy time for brands located in these hot spots but so are the summer months. While trends have changed in 2021 looking at the entire years of 2019 and 2020 can help us predict how the rest of the holiday shopping season will pan out and how 2022 will begin.
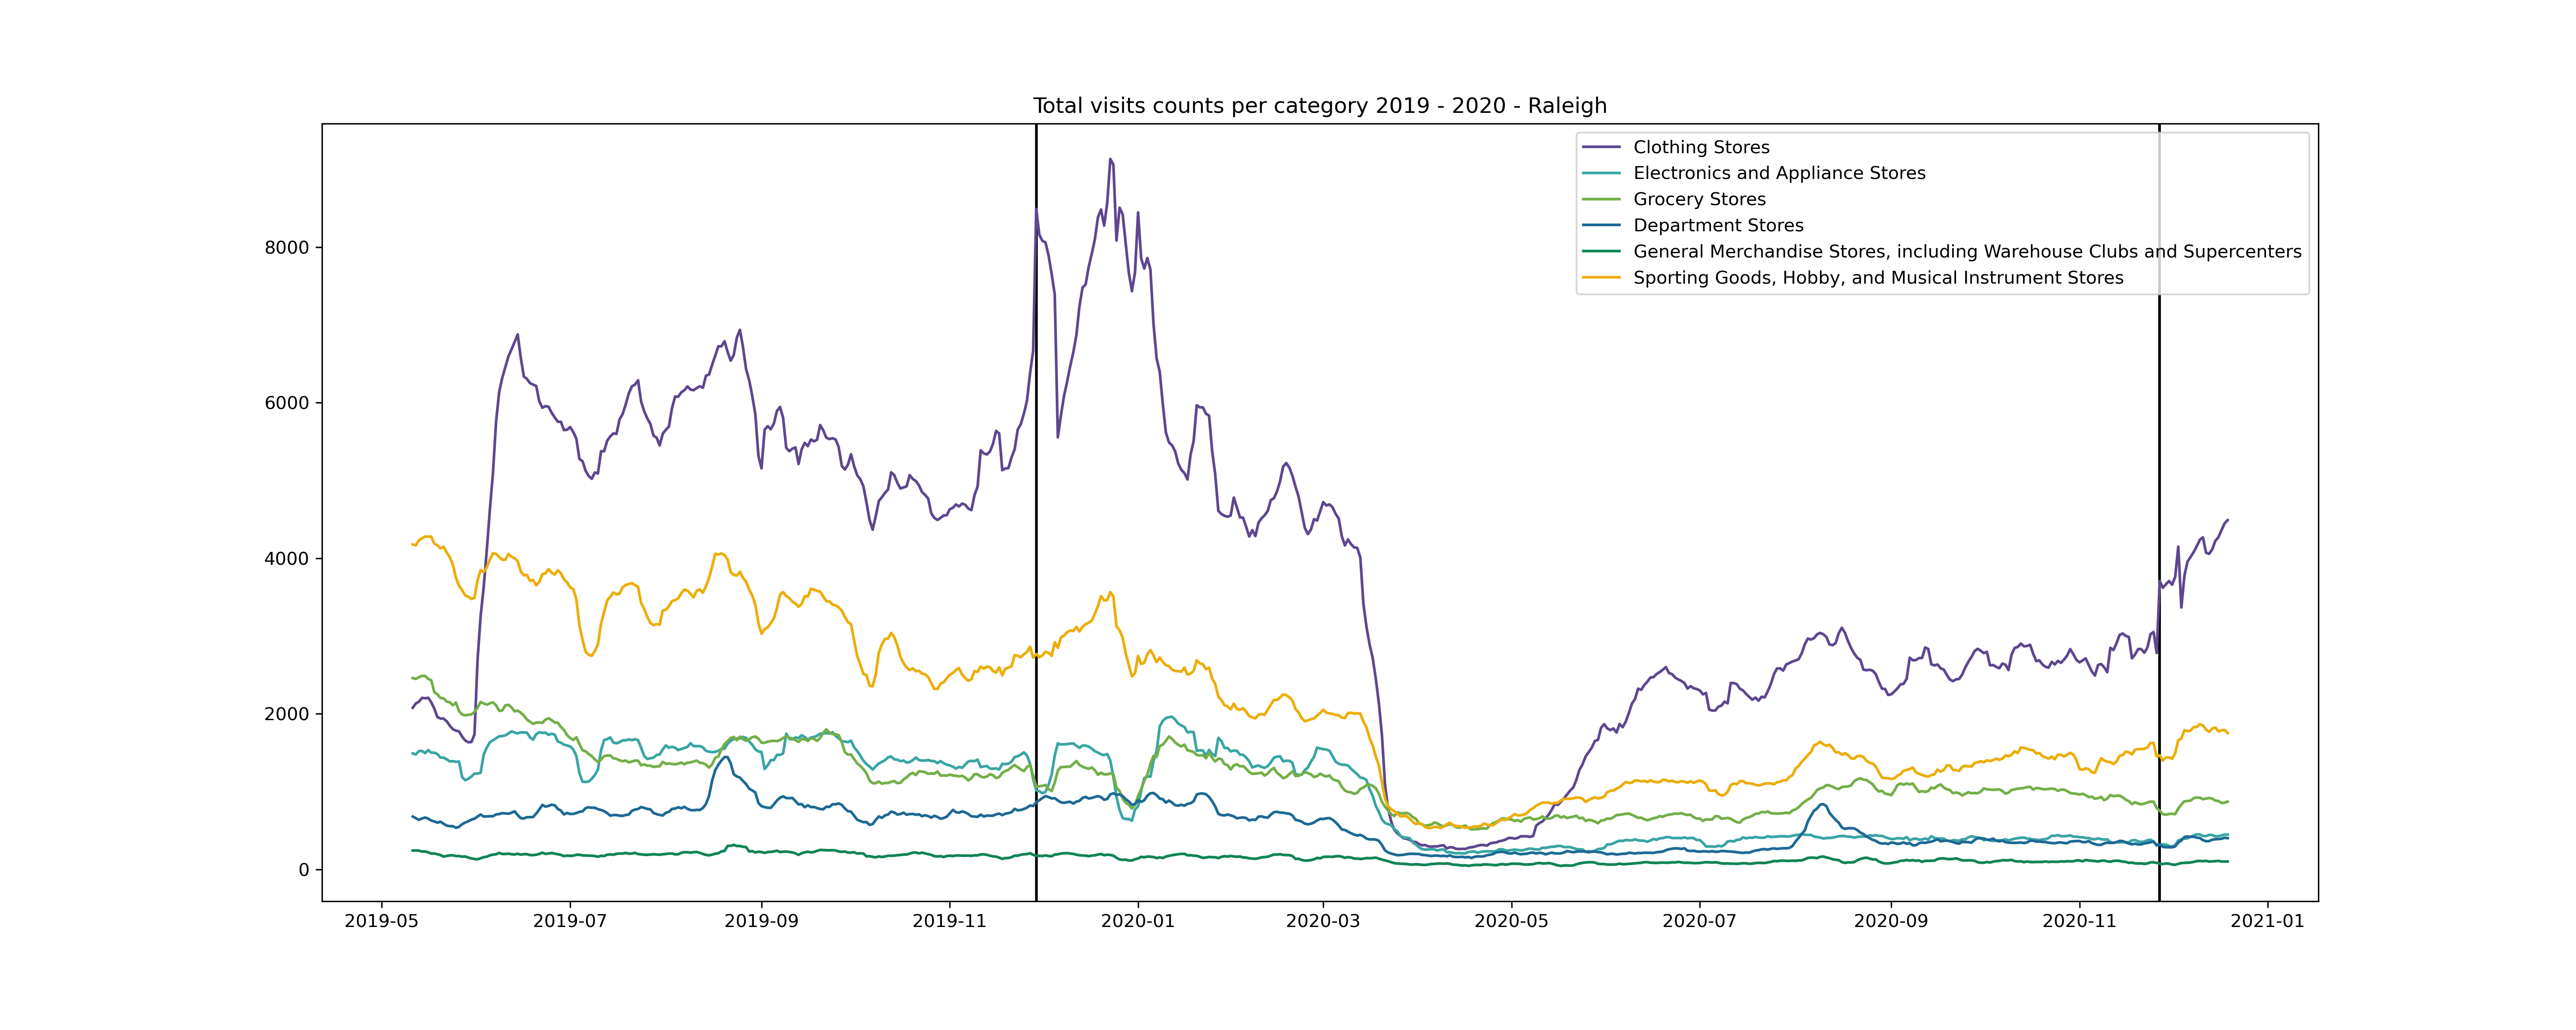
In Raleigh foot traffic increased during the summer and holiday season in 2019 to 2020. Clothing stores in Raleigh experienced the largest increase during those times and have begun to rebound the fastest.
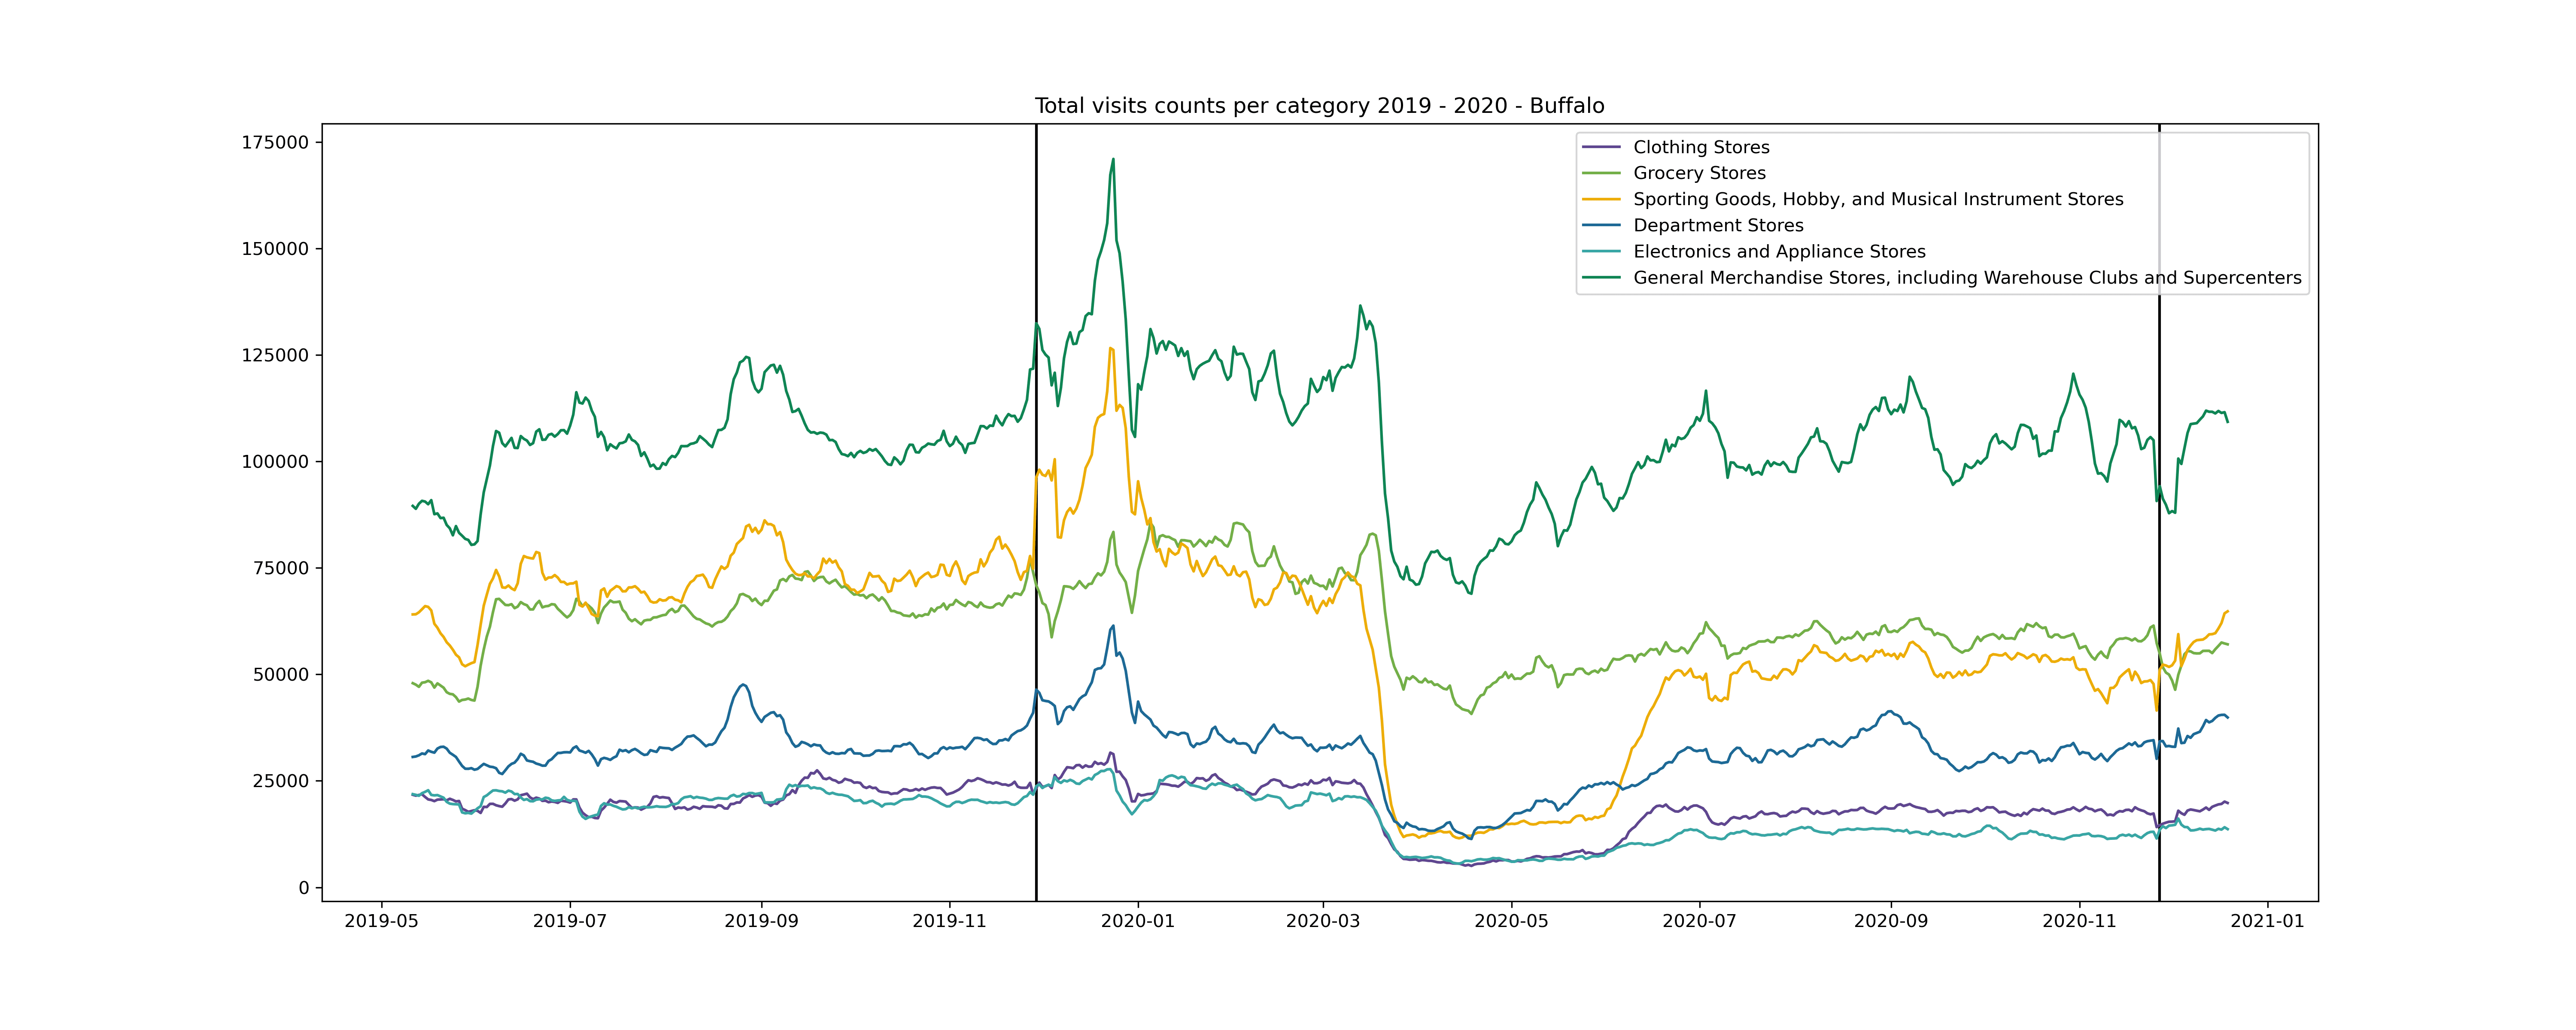
Buffalo has shown a spike in foot traffic for most categories during the holiday season but only at general merchandise sporting goods and department stores in the summer months.
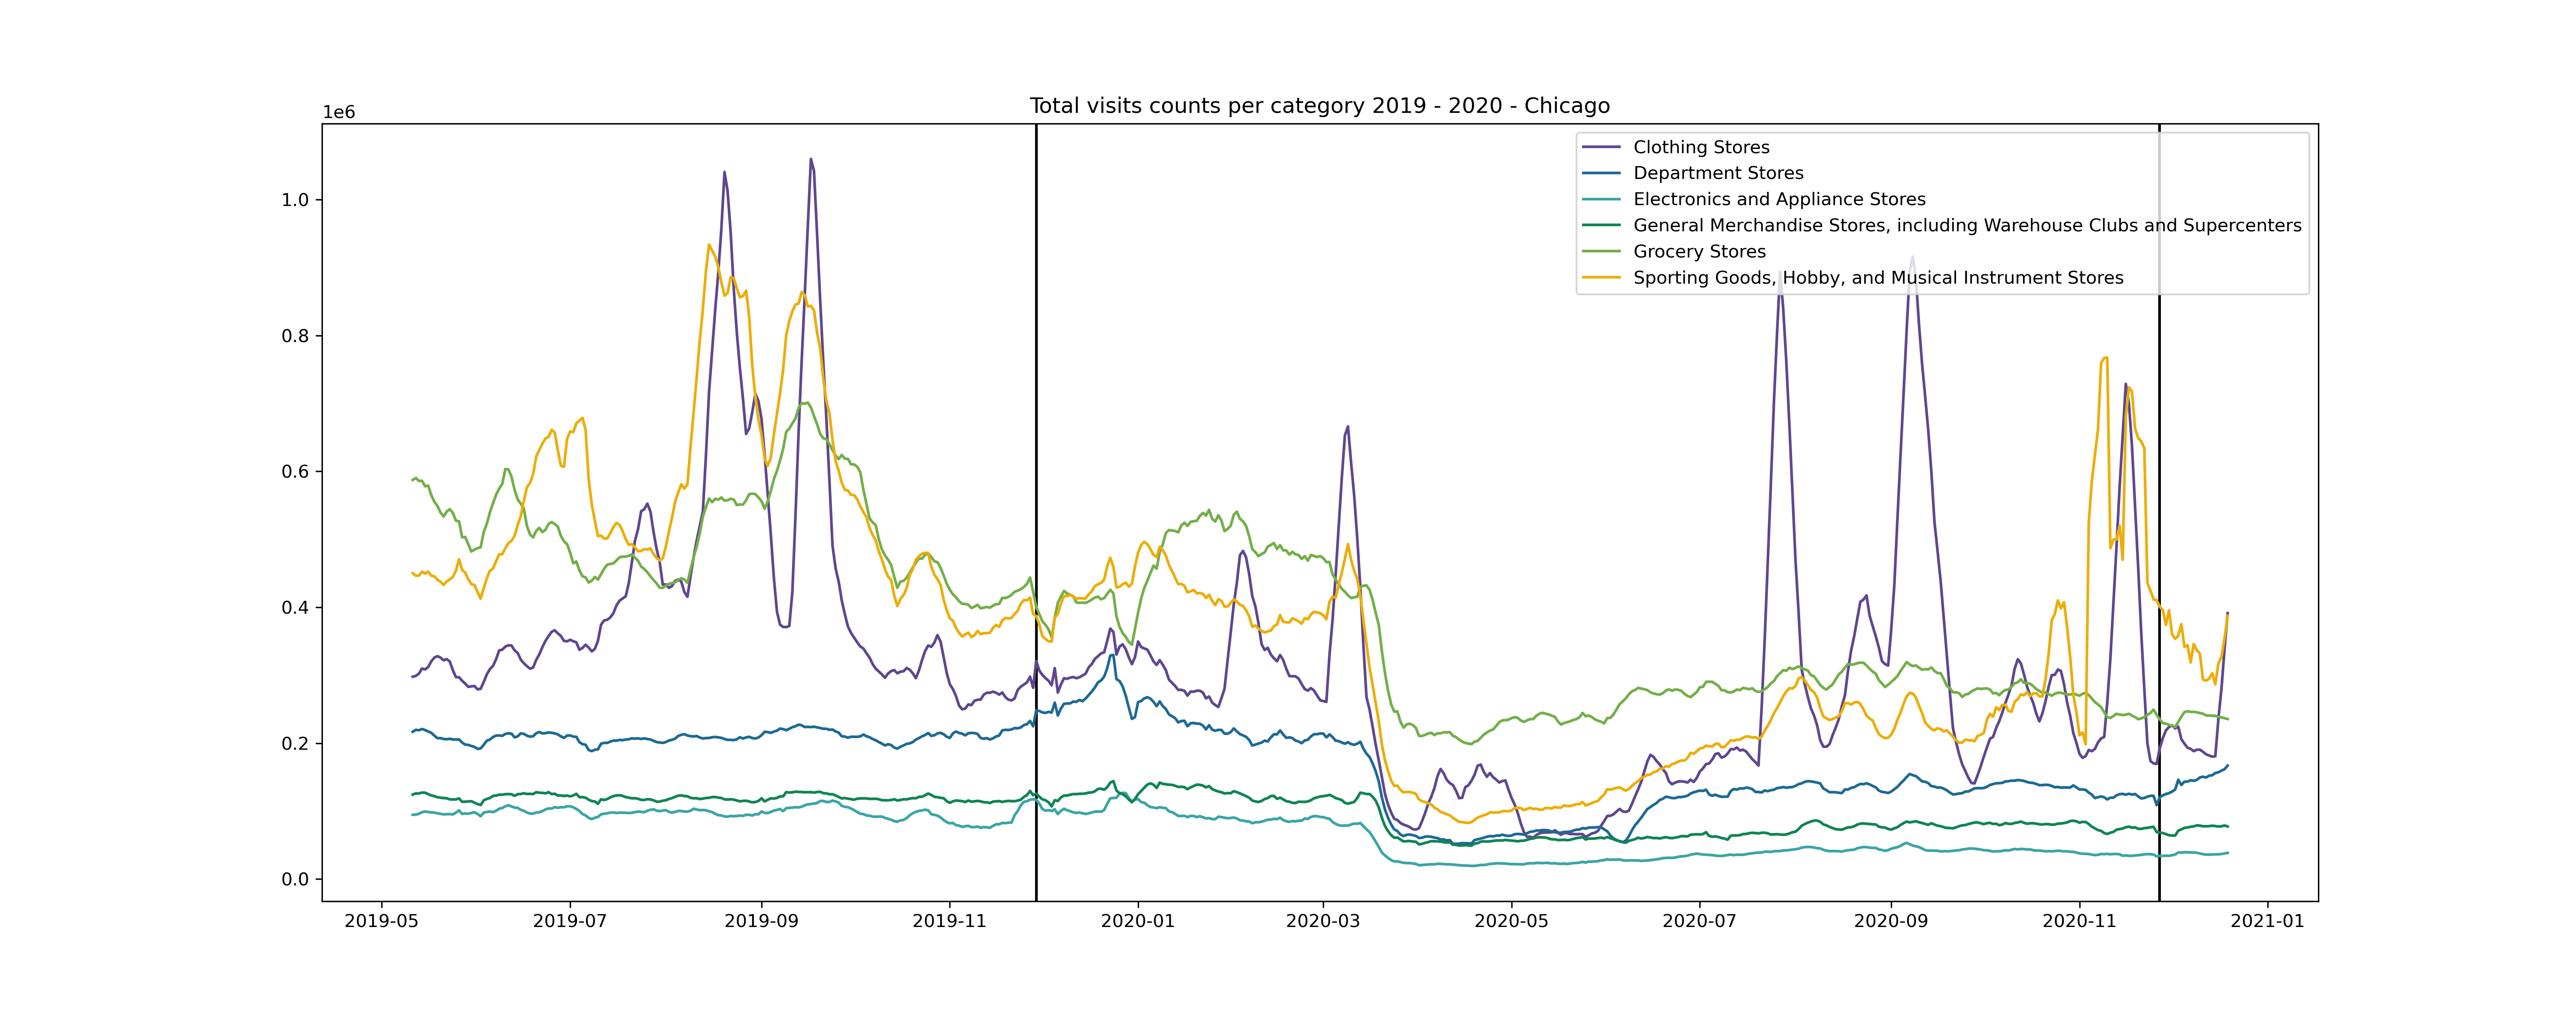
Looking at Chicago foot traffic through 2019 and 2020, spikes do occur at the holiday season but there is also a large spike over the summer months, especially for clothing stores.
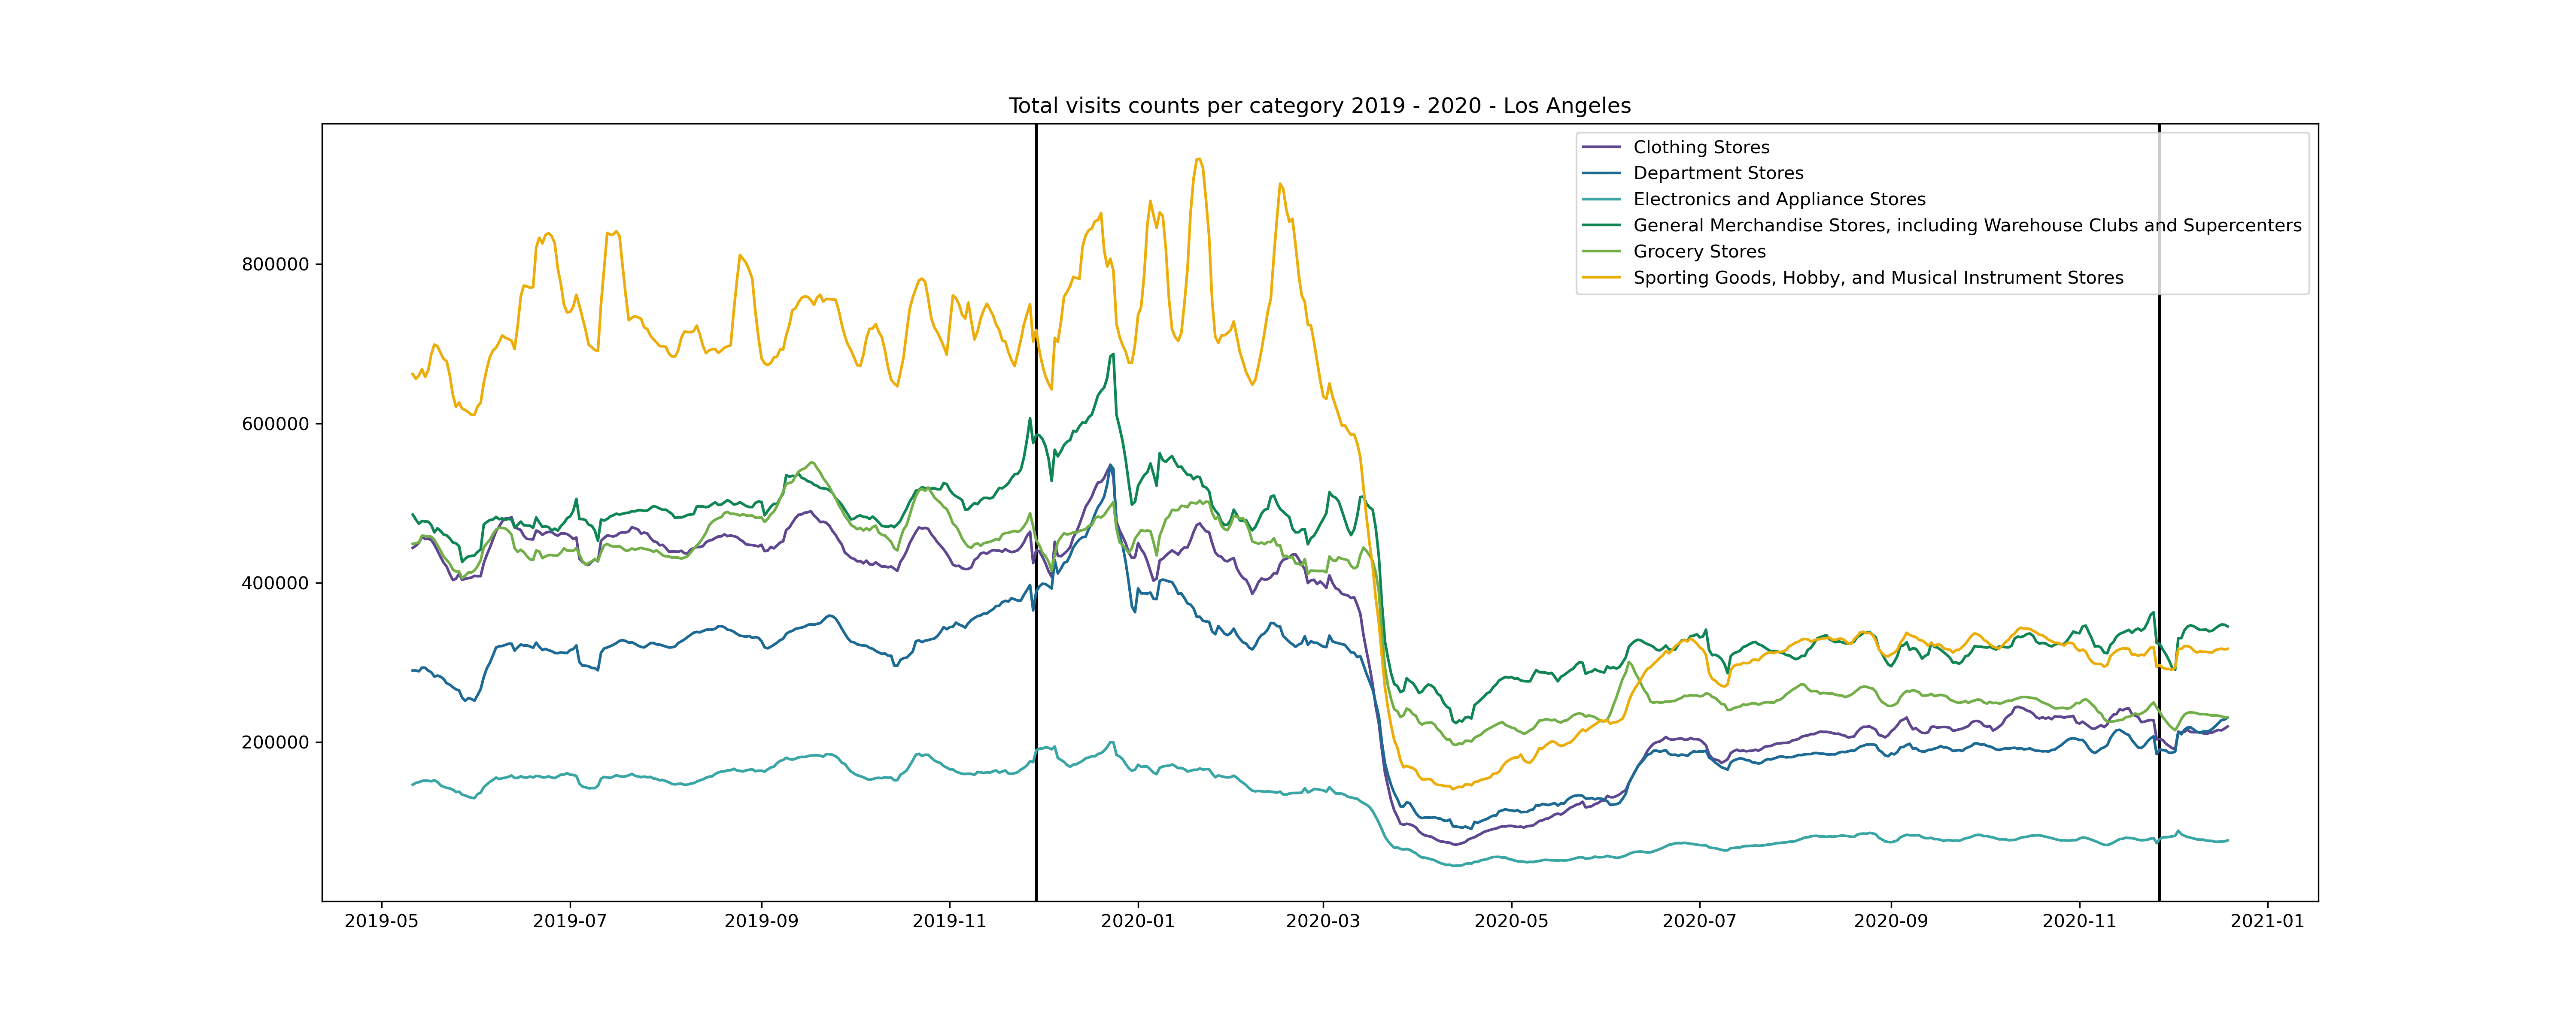
The holiday season in 2019 shows all POI categories in Los Angeles received a spike in foot traffic except electronics and sporting goods stores, however all categories appear to be slow to rebound through 2020.
Analyzing Black Friday foot traffic is critical to understanding one of the busiest shopping days of the year but it's important to remember it is part of a larger picture. Understanding how consumers behave on Black Friday year over year can be an indicator of how other major shopping seasons will go at other times of the year. For example if shoppers are not traveling as far on Black Friday in 2021 as they were in 2019 they probably won’t travel as far for 2022 summer or back-to-school sales as they did in 2019. Looking at 2019 and 2020 data can help retailers model consumer demand in coming months and adequately adjust their strategies in response.
Predicting Consumer Demand from Black Friday Trends
The trends identified by this Black Friday analysis largely illustrate a recovery period between 2020 and 2021. Although not as significant as in 2019 2021 proved people have participated in traditional Black Friday activities by going in-store to get the best holiday deals. However people do not seem to be traveling as far. In 2021 people are still shopping closer to home and this may have lasting effects on the retail industry.
The 2021 shift in consumer behavior should be a signal to retailers to adapt their overall business strategy particularly when it comes to trade areas. Trade area analysis can inform decisions on where to set up shops based on factors such as how many people in an area can easily get to a store how much disposable income they have and what they’re looking to buy. However creating trade areas on these factors alone will not provide the deeper insight we have gained by layering mobility data into this analysis. Mobility data takes all the guesswork out by telling retailers how their customers are moving throughout the day and week and exactly where they are coming from. Insights on consumer mobility are critical for retailers to drive site selection determine marketing strategies for in-store vs online inventory allocation during the holidays and much more.
Are these Black Friday trends here to stay? Only mobility data and time can tell. In the meantime watch our webinar with SafeGraph to see exactly how we performed this analysis. You can also access all of the code on GitHub here.
 | This project has received funding from the European Union's Horizon 2020 research and innovation programme under grant agreement No 960401. |


