Consulting Presentation Examples that Go Beyond PDF and PPT


Consultants face a growing demand to present solutions to clients that go beyond a powerpoint presentation or static PDF report.
With the rise in consulting’s adoption of digital professional services consulting firms are now packaging digital service offerings around disciplinary specialties and industry expertise.
While presenting these solutions to clients consultants must:
- Control budget spend for a large mix of clients
- Manage compatibility issues with client’s technical infrastructure
- Build data repositories to ensure accessibility to accurate up-to-date data
- Present their findings in a way that clients can interactive with
All of these challenges can be addressed using a Location Intelligence platform. The static inactive design of traditional formats like powerpoint presentations and PDF files leaves clients dependent on consultants to continue to provide analysis.
Instead Location Intelligence offers consultants a more interactive format that can reduce back and forth putting the power of analysis in the hands of the client. Here are two examples of consulting firms that ditched the powerpoint for a more interactive presentation of data and analysis.
Mapping Location Data for Network Optimization
The telecommunications data-as-a-service (TDaaS) market industry analysts predict will surpass $79 billion in 2020 and telco companies are turning to consulting firms to help build tools that take advantage of their data.
A consulting firm we work with was asked to develop and present a solution around network deployment and optimization for one of their telco clients.
The consulting firm needed to identify a specific geographic areas that would yield the highest returns on investment on newly deployed networks. They were analyzing an immense amount of location data:
- Telco data on current customers to determine hotspot locations
- Census data on specific geographic (population demographics areas with high traffic volume areas with high financial activity) to determine city-wide behaviors and trends
- Cell site data and coverage radius
- Nearby competitor data
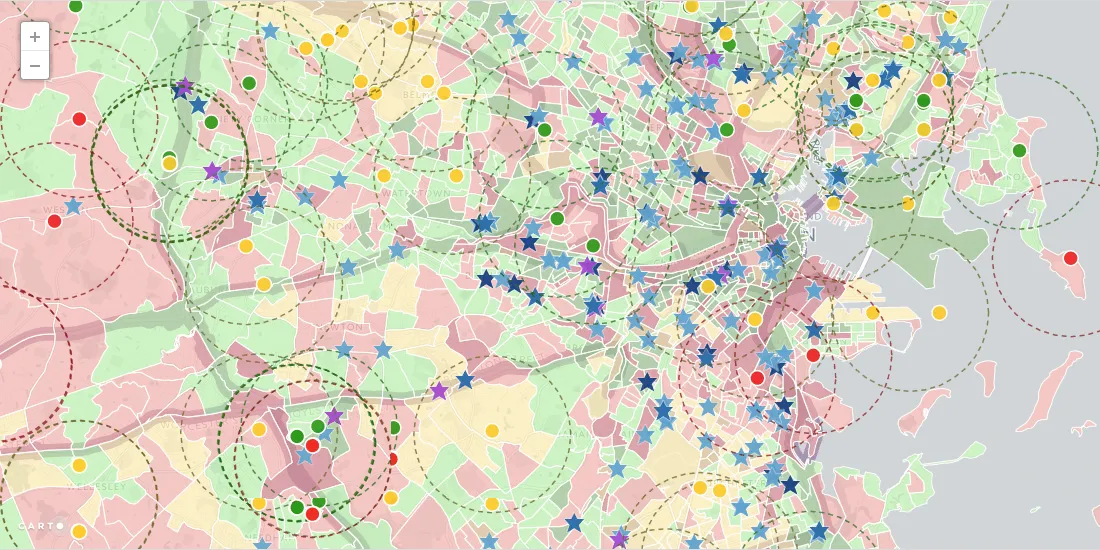
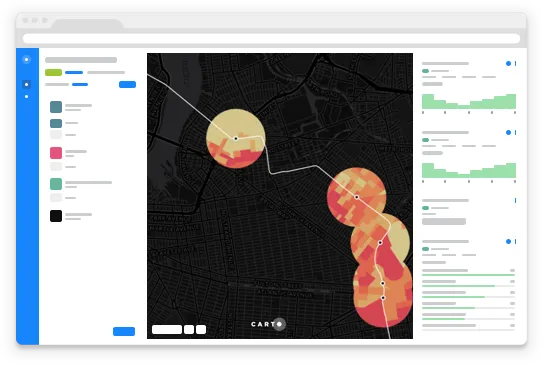
Visualizing and analyzing this amount of varied data in a spreadsheet or on a static map presents difficulties. If a consultant were to just present clients the image below in a powerpoint or PDF presentation for example it would be difficult if not impossible to determine how to implement these go-to-market strategies.
Rather the consulting firm used Location Intelligence to build a fully interactive tool that their client actually incorporated into their own analysis and business workflows. As new data points and layers are added the client can continue to use the tool to gain insight pose new questions and iterate.
While we can’t share the actual tool the four images below give you a sense of the type of analysis and exploration of data that a tool like this enables:
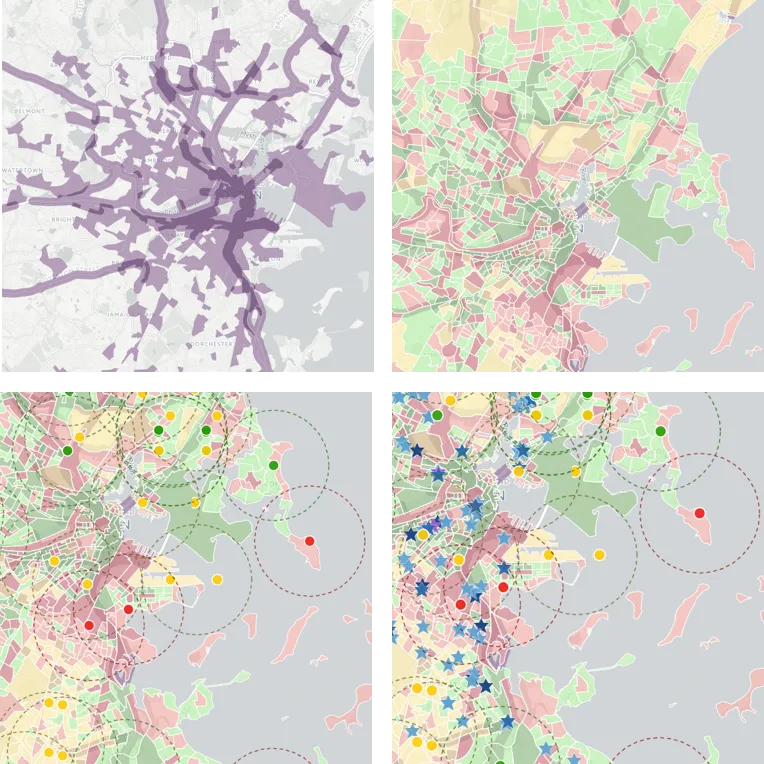
By building their telco client this Location Intelligence tool the consultancy firm was able to (1) create a central data repository that clients could easily access (2) facilitate custom analytics of importance to the client in the ordering of each layer and (3) leave behind a new tool for clients to maintain by importing new data when available.
Building Supply Chain Maps for Management Consulting
Management consultants work with businesses to improve operational performance. This type of work requires extensive research and analysis of existing organizational structure.
One of these types of analysis is supply chain analysis. To reduce shipping costs one consulting firm we work with built a Location Intelligence application with their client’s data to map distribution routes by product category customer segment and destination region.
In the example below the consulting firm mapped data from an international office supply retailer to show (1) point of origin and point of destination for order shipments for each distribution center and (2) shipment route by product category for each distribution center:
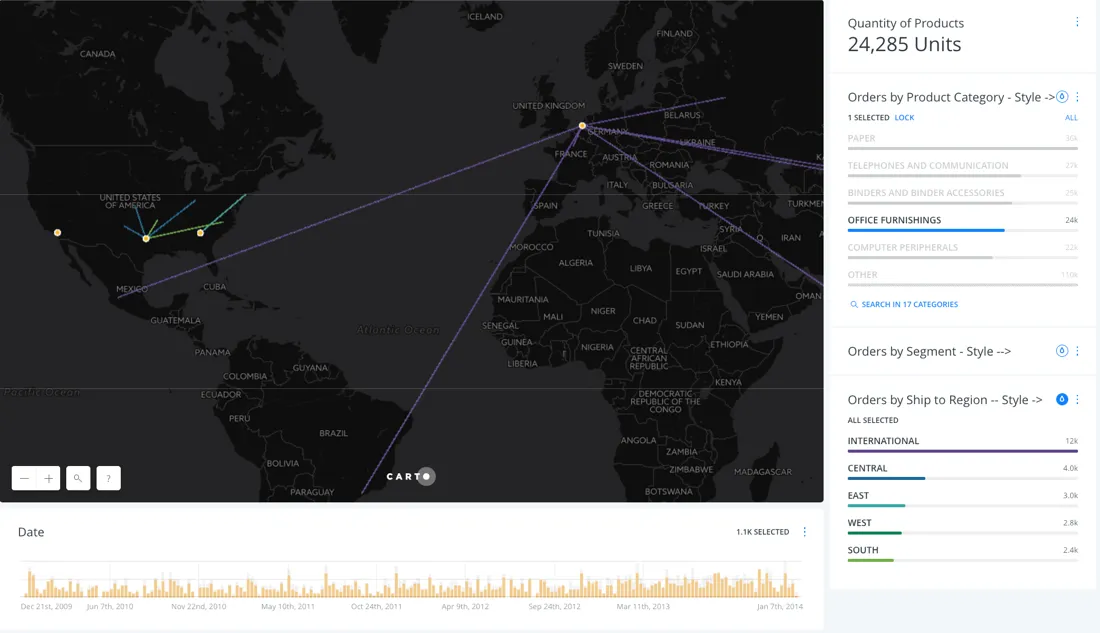
Immediately we can see at least two sub-optimal shipping routes for office furnishing are (1) sent from Holland to Mexico instead of from Dallas Texas to Mexico and (2) sent from Dallas Texas to Raleigh North Carolina instead of from Atlanta Georgia to Raleigh North Carolina.
Location Intelligence tools help deliver clients presentation full of clear actionable data-driven insights. But more important data visualization can be left behind for clients to maintain which can help consultants secure the client’s future business.
Start Consulting with Location Intelligence
Request a demonstration from one of our consultancy specialists today!