Data warehouses vs. GPU accelerated analytics for geospatial analysis


Analyzing and visualizing large amounts of geospatial data has sometimes seemed like a pipe dream to many analysts involved in GIS or geospatial analysis. Limitations on file sizes or infrastructure that supports spatial analysis at scale have always seemed to keep this just out of reach.
There have been many different advancements in the accessibility of data analysis on large scale (tens of millions to billions of rows) geospatial data: scaled performance in Python, advancement in tools like PostGIS, cloud data warehouses, spatial capabilities in Spark, and GPU accelerated analytics.
In this post, we will take a look at two of these approaches: GPU accelerated analytics and cloud data warehouses with spatial capabilities.
GPU analytics are powerful
If you have seen a map or dashboard powered by GPU accelerated databases or rendering, you know that these dashboards are fast and can display massive amounts of data. They can easily store, query, and visualize millions and billions of rows of data without significant need to prepare or transform the data.
If you are not familiar with GPUs, or graphics processing units, these are the same processing units that were meant to process video graphics. They are extremely powerful and can also be applied to accelerate other processes like databases or map tile rendering engines. NVIDIA is one of the leaders in applying this technology to machine learning, deep learning, and artificial intelligence, and companies like HEAVY.AI and Kinetica have applied the same GPU technology to geospatial databases and tiling services.
Traditional databases are generally powered by central processing units, or CPUs, the same processing units that run in most laptops and other computers. Both CPUs and GPUs can be scaled in a cloud computing environment, but GPUs can support 10s of thousands of cores where a CPU may have 8 to 30 cores (the more cores, the more tasks the unit can support).
However this doesn’t scale and is expensive
While GPU accelerated analytics provide fast analytics and visualization, these services have several drawbacks, the main being price and continuous running. Before we discuss the specifics, I’ll share an analogy that can help explain this in detail.
GPUs vs. data warehouses is like owning a car vs. taking an Uber
Imagine that you are deciding if you want to buy a car. You live in a city and you mostly get around with a mix of bike share, public transportation, and car share services like Uber.
Having a car would be very convenient, you can go anywhere you want whenever you want. However there are all the added costs (and time commitments) of owning a car: lease payment, insurance, parking, repairs, license plates, etc. You are paying for the car when you are using it and when it is parked for hours while you are sleeping.
With your other options, you can get the service that is appropriate for you at the time you need it, and you only pay for what you need on demand. In addition if you want better service, like an upgraded car or faster pick up, you can choose to have that added cost.
GPUs are like owning a car and cloud data warehouses are like using public transportation/bikes/ride share.
Access the ultimate guide to navigating the new geospatial landscape. Download the free report: Modernizing the Geospatial Analysis Stack today.
GPU services run around the clock, even when you aren’t using them
When you are using a GPU accelerated geospatial service, the GPUs need to be running around the clock, no matter if you are using it or not. As you scale and add more data or dashboards, you may need to add more GPUs to keep performance up, and these services are expensive. Take this example from a a webinar from HEAVY.AI that compares the compute resources for their GPU accelerated analytics platform compared to Snowflake with Tableau:
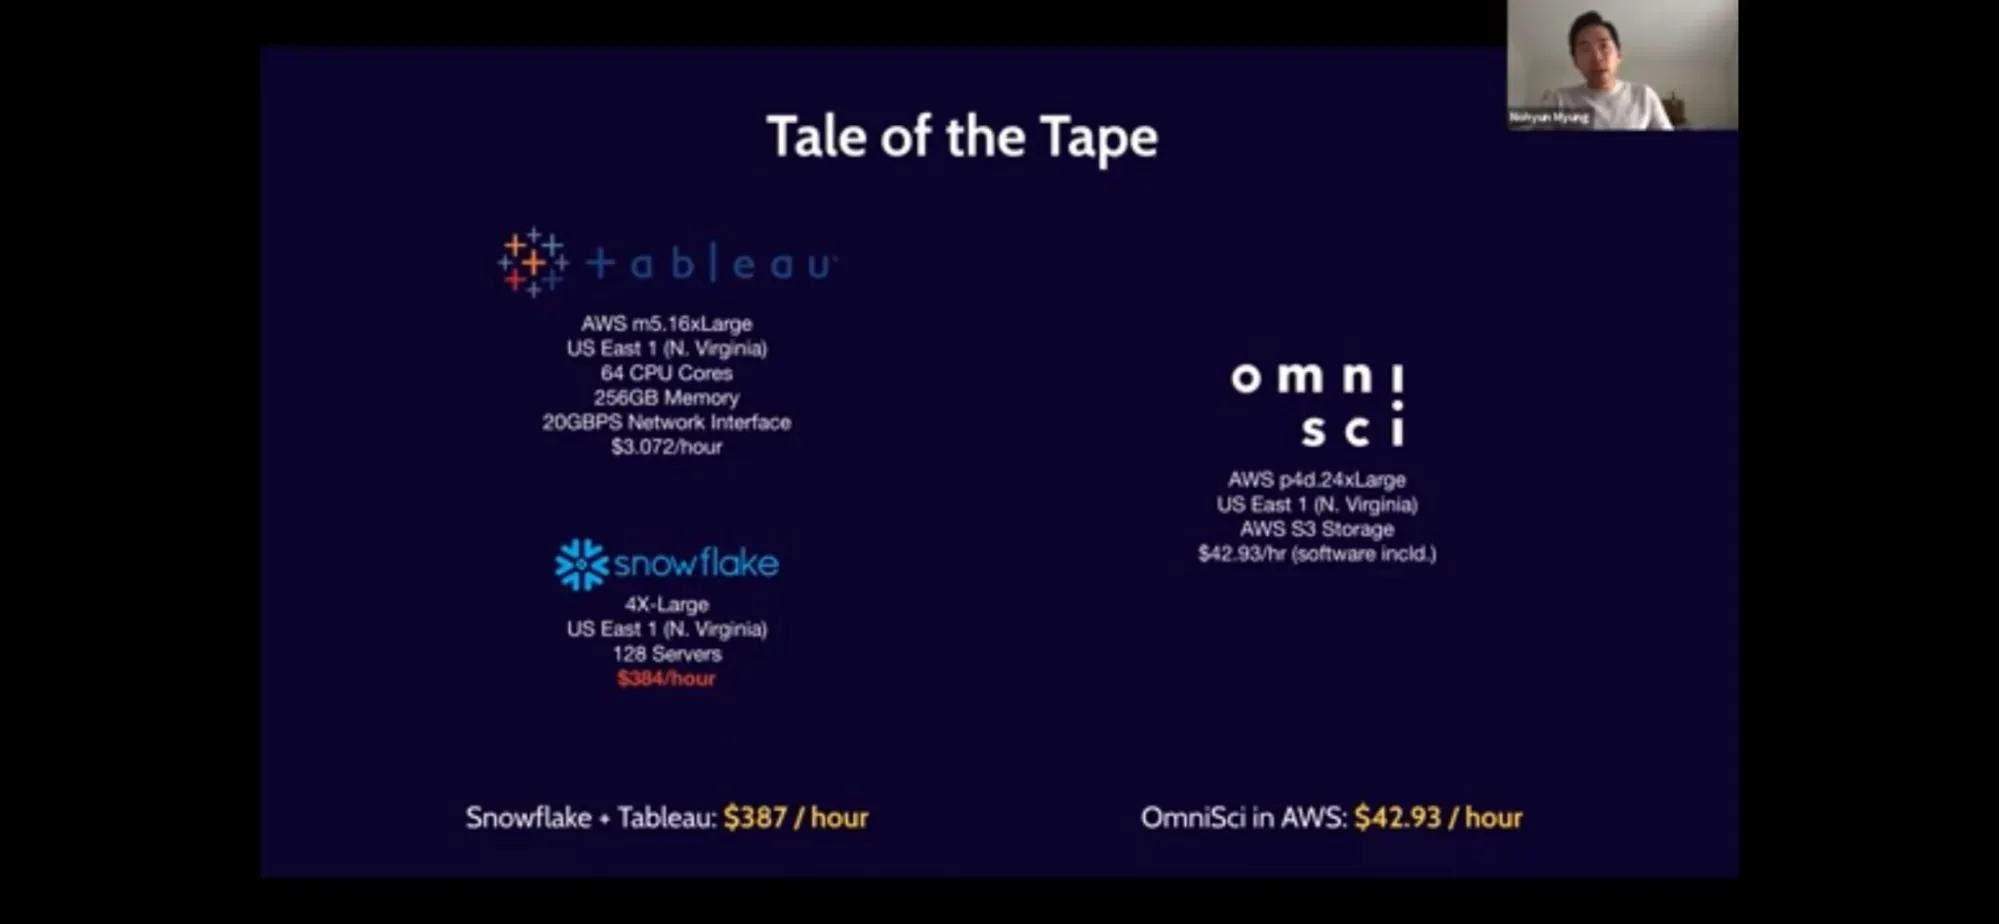
This comparison would make it seem as if using a GPU accelerated toolkit would be the best choice, however there are a few key points to call out:
- This is using the largest and most expensive (not in preview mode as of the publishing of this post) warehouse in Snowflake.
- The performance issues are tied to the geospatial visualization constraints of Tableau rather than limitations of Snowflake.
- The test case is designed for the GPU service since there is no transformation or aggregation of data, and the responsive queries that call back to the database are far more suitable for a GPU service.
- The combination of Tableau and Snowflake is suitable for pre-created aggregated and less frequent update schedules of non-geospatial data but Tableau does have a limitation on the number of geographic features that can be displayed on a map.
With that said let’s take a look at the costs for the cloud services running the GPU accelerated services. It is using the AWS EC2 p4d.24xlarge instance (which is one of the most powerful and expensive EC2 services AWS offers) that costs $42.93 an hour (the services is currently listed as lower on the AWS pricing page).
That translates to:
- $1 030.32/day
- $30 909.60/month (30 days)
- $376 066.80/year
Running GPU accelerated services is like owning a car
These estimates are also not accounting for licensing costs or other costs that may need to be accounted for. You could manually shut down and turn on the service as needed scale the service manually, or provision some autoscaling as needed. That said this extra layer of dev ops also requires time and cost. Finally, if you add other dashboards or services to this server, you may need to provision additional services as more queries against this service could cause performance issues.
Double costs if you already use a data warehouse
If you are already using a data warehouse and pushing data into a GPU accelerated platform, you are paying not only to store and query your data in your data warehouse, but also the GPU services on top of it. And for any data that lives solely within the GPU database, you lose the ability to integrate that data with other data in your data warehouse.
At CARTO we took a different approach
Data warehouses are increasing in adoption and scalability, and are a great solution for managing and analyzing large amounts of geospatial data. They provide low cost and highly efficient storage and serverless or scalable compute resources with no management. This means you can run your queries and use massive computing power only for the time you need it.
CARTO has focused our efforts on integrating natively into these cloud data warehouses (including BigQuery Snowflake Databricks and Redshift) not only for visualization using map tiles (which we will discuss below) but also spatial models and analytics routing networks and queries spatial indices geocoding and more. These processes run inside your data warehouse using simple SQL statements and harness the tools you are already using and the serverless power of the data warehouse to scale the analysis.
Quick aside on map tiles and representations/aggregations
Let’s be honest here for a second. No web maps are actually visualizing every point in a 7 billion point dataset. Transmitting that much information in a map tile would be too much data to render quickly, and layering that many features would be visually useless.This is why all web maps when dealing with data at these scales rely on tools that either select a comparable representation of this data or aggregate the data. You can learn more about the representation approach in this post. I also really like this article and supporting video about Datashader, which is a library in Python that provides static visualizations for multi-million point datasets. Both CARTO and GPU accelerated tools use these methods to render map data.
Most of the GPU accelerated tools also render map tiles in raster, or PNG tile format. A more modern approach is using vector tiles that allow for far more advanced visualizations and analysis using 3D, arcs, animations, and much more.
Visualizing wildfire risk for the 160K properties sold in Los Angeles in 2020.
CARTO cloud native platform provides a few key differentiations from GPU accelerated analytics tools, specifically related to map tile creation and visualization.
- CARTO creates vector map tiles using modern tools. Under the hood we use our own custom tiler designed for data warehouses to render these datasets without the limitations of file size upload.
- Our tiling system uses the built in serverless compute power of each data warehouse such as BigQuery Snowflake and AWS Redshift.
- You can scale to much larger datasets, in the billions of points, and create many tilesets with the same functions as many times as needed.
- Create tiles with ease in the CARTO Workspace or using SQL commands.
- You can use the tiles in the CARTO Builder in our developer tools like CARTO for React or Deck GL, or any application you already have built that supports TileJSON XYZ tiles or .mvt tiles.
- You can style your tiles with Deck GL, a modern styling language for geospatial data with many different options
In addition to tiling with standard geometry types, we have also released Spatial Index Tiles using H3 cells or Quadbins for BigQuery Redshift and Snowflake. These can render with just the index and perform aggregations automatically and provide massive storage saving performance in your data warehouse (more in a future post).
Comparing the two approaches
.webp)
Recently, I built two different maps to see how creating a tileset and a spatial index tileset in CARTO can compare to those in GPU accelerated instances using Google BigQuery and CARTO, specifically our Builder for visualizing the data and the Analytics Toolbox to create the tiles.
The dataset I used was the OpenStreetMap nodes dataset in BigQuery Public data which is a total of ~7.2 billion points. This is not an apples to apples comparison to the above HEAVY AI dashboard as it is 7.2 billion points of OSM nodes compared to ~11 billion ship path points in the AIS dataset, but the fundamental components like time to run and one time costs should not vary much.
The two versions sets I created are:
- Point aggregation (where points with aggregated counts are represented with a single point) and a tileset of all points once the map goes below zoom 17
- An H3 spatial index tileset aggregation with tiles aggregated in H3 hexagons at base resolution 10
The major compromise you are making in this approach is that you are losing the capability to dynamically filter every data point and re-render the map as you do in the HEAVY AI dashboard. With some smart SQL and selective counts you can achieve some of those filters within aggregated views.
The first map actually uses two tilesets, one with a point aggregation with views above zoom 17 and one that shows the raw data below 17. You can set this zoom based filtering in Builder and set up your tilesets to control for the zoom levels.
Here is the SQL for the point aggregations and simple tilesets respectively:
CALL `carto-un`.carto.CREATE_POINT_AGGREGATION_TILESET(
  R'''(
    select id  st_geogpoint(longitude  latitude) as geom from bigquery-public-data.geo_openstreetmap.planet_nodes
  )'''
  '`project.dataset.osm_nodes_points_17`'
  R'''
    {
      "zoom_min": 0
      "zoom_max": 17
      "aggregation_resolution": 7
      "max_tile_size_strategy": "drop_fraction_as_needed"
      "aggregation_placement": "cell-centroid"
      "properties": {
        "aggregated_total": {
          "formula": "COUNT(*)"
          "type": "Number"
        }
      }
    }
  ''');
CALL `carto-un`.carto.CREATE_TILESET(
  R'''(
        select id  all_tags  st_geogpoint(longitude  latitude) as geom from bigquery-public-data.geo_openstreetmap.planet_nodes
  )
  '''
  R'''`project.dataset.osm_nodes_tiles_17_and_down`'''
  STRUCT(
    "OSM Nodes" AS name
    "OSM nodes raw data for zooms 17 and below" AS description
    NULL AS legend
    17 AS zoom_min
    20 AS zoom_max
    "geom" AS geom_column_name
    NULL AS zoom_min_column
    NULL AS zoom_max_column
    1024 AS max_tile_size_kb
    "RAND() DESC" AS tile_feature_order
    true AS drop_duplicates
    R'''
      "custom_metadata": {
        "version": "1.0.0"
        "layer": "layer1"
      }
    ''' AS extra_metadata
  )
);
The H3 map uses a new functionality to make spatial index tilesets. Once you assign an H3 or Quadbin index to the data, you can actually create the tiles with just that data point, no need for a geometry which is far faster than the other tileset creation methods.
CALL `carto-un`.carto.CREATE_SPATIAL_INDEX_TILESET(
  'project.dataset.osm_nodes_10'
  'project.dataset.osm_nodes_tiles_10'
  R'''{
    "spatial_index_column": "h3:h3"
    "resolution": 10
    "resolution_min": 0
    "resolution_max": 6
    "aggregation_resolution": 4
    "properties": {
      "trip_total": {
        "formula": "COUNT(id)"
        "type": "Number"
      }
    }
  }'''
);
So how does the performance compare between these different tilesets?
Tileset Performance Comparison on BigQuery
| Data Processed | Time to Process | |
|---|---|---|
| Points | 434.24 GB | 2 hours 36 minutes |
| Simple Tileset | 542.81 GB | 1 hour 7 minutes |
| Tileset based on H3 Spatial Index | 1.51 TB | 12 minutes |
The point based tilesets could be improved if I had stored the geometry, but generally the spatial index tiles are going to be far faster overall.
The cost is where the real savings will come. If you were to run these queries once a month and store the appropriate data this would cost roughly $31 a month or $0.04 an hour, to store all the data and tiles for this use case, or a 1000% cost saving compared to a GPU accelerated instance!
As I mentioned If you need that dynamic filtering with immediate response on the fly, then the GPU solutions do provide a good functionality here, but for all other use cases creating appropriate aggregated tilesets tend to provide good functionality and cost savings. The key question to ask is what are the true cost of the insights you are producing, and do the speed and answers provide appropriate value for this use case and the infrastructure to support future use cases as well.
Customer Stories
If you would like to find out more about how are customers are leveraging this approach for advanced spatial analytics at scale, then check out our customers stories below. Want to try CARTO out for yourself? Why not Sign up for a 14-day free trial or schedule a demo with our experts.