

Mapping the Impact of Madrid's Line 5 Shutdown


Transit systems form a lifeline connecting residents and visitors to various locations across a city and when service is disrupted the effects are felt far and wide. This past summer for instance Metro de Madrid scheduled maintenance repairs along the Line 5 which suspended commuter service. Full service was restored on September 3 2017 but what impact did the Line 5's 62 day shutdown have upon the city of Madrid?
With available location data collected from IoT sensors and other smart devices used throughout Madrid we measured the emotional and economic impact of the Line 5 maintanance closure.
With support from our friends at LUCA we found that while the service disruption inconvenienced city residents commuters residing beyond Madrid's city limits were left without alternative modes of transportation. Subsequently the decrease in commuters traveling into Madrid for 62 days also reduced economic activity along the Line 5's 32 stops.
Let's see what how this kind of data could equip public sector leaders in Madrid with solutions for smarter more transparent decision making in their city.
Expanding smart city solutions to nearby suburbs
The Line 5 the city's fourth most popular line runs from the southwest of Madrid to the northeast and connects suburban hubs like Carabanchel and Ciudad Lineal to Spain's capital.
Unlike their city residents who could access alternate modes of transportation including shuttle bus services bike rentals or even other metro lines suburban commuters traveling from home to work had few if any alternatives.
But how can we measure the impact that this closure had upon riders who live beyond Madrid's m30 loop and are dependent on the Line 5?
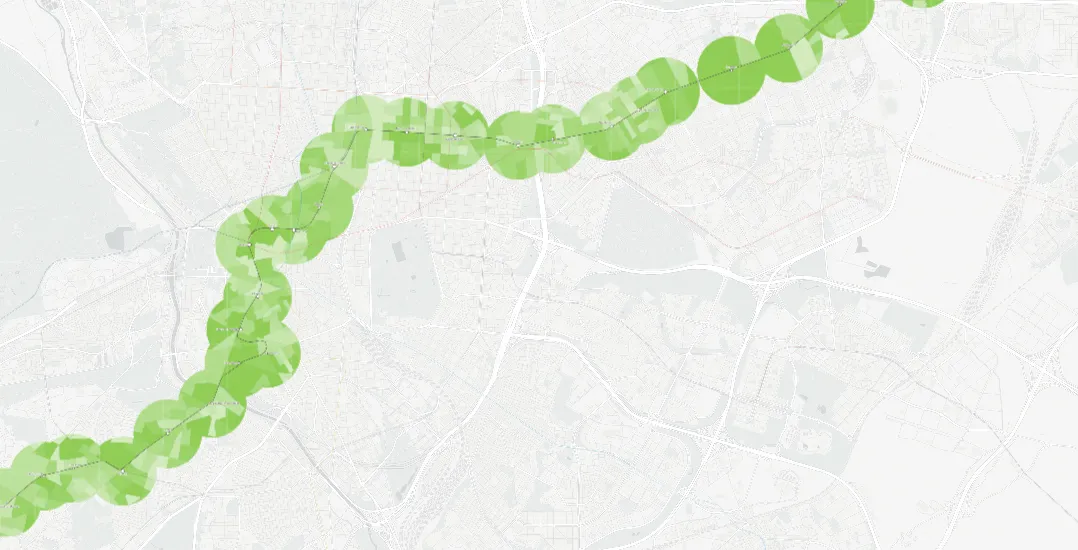
Emilio one of our UI Designers and Developers mapped the Line 5 and plotted each metro station along the route as seen in the image below:
To analyze commute patterns we first needed to identify the point of origin and point of departure of a typical Line 5 commute.
Open data from Atlas of Residence and Work Mobility in the Community of Madrid was used to gauge mobility patterns and this demographic data revealed that the majority of Line 5 riders reside in southwest suburbs but commute northeast each day for work.
The southwestern Carabanchel Line 5 station for example is the point of origin for the many riders commuting into the city while the northeastern Suanzes Line 5 station servicing the Julian Camarillo district the most popular work location is the point of departure for many riders.
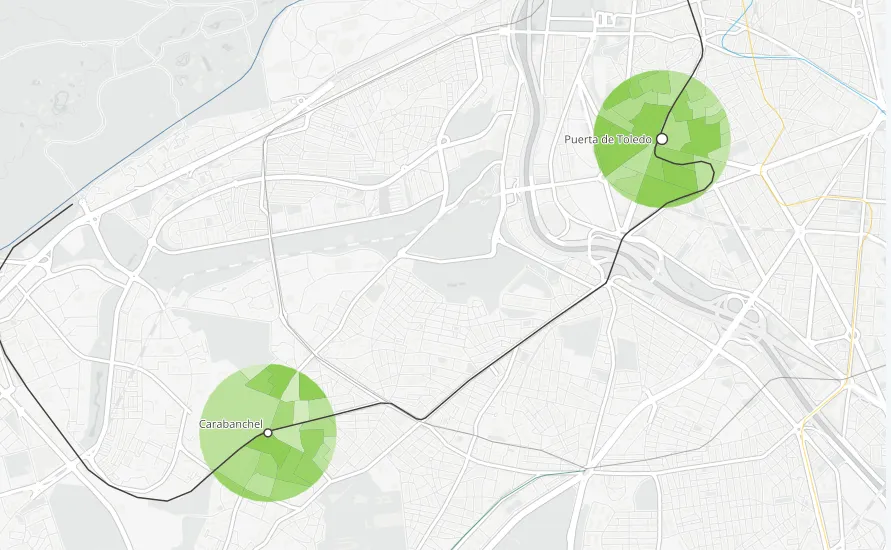
Emilio imported Line 5 demographic data and mobility data and in the image below you'll see the most common point of origin and most common point of destination for Line 5 riders:
This data visualization provides a solid statistical overview of Line 5 ridership but to understand the impact of a 62 day closure for residents living beyond Madrid's m30 loop we'll need a more granular view.
Making smart city's citizen-centric with Location Intelligence
For more granular insights into Line 5 mobility patterns we collaborated with our partners LUCA Telefónica's Big Data department and used their LUCA Transit platform.
We imported available anonymized and aggregated mobile event data. While we had mapped available open data LUCA's data allowed us to map group mobility patterns with location data from commuters' smart devices.
Now we could assign points of interest (in this case work and home location) by looking at the dynamic recurring locations of mobile phones (using Smart Steps technology) that provided mobility trends on almost 40% of the Spanish population.
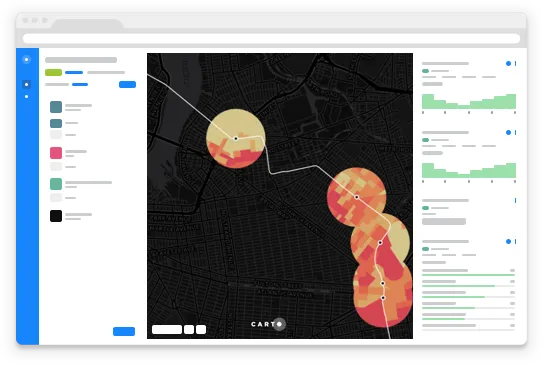
Emilio imported this data into the data visualization below:
Here are some of the interesting findings provided from this more granular view of Line 5 commuter trends:
- Carabanchel was the most affected Line 5 station for suburban commuters
- Suanzes which provides service to the Julian Camarillo district was the most affected Line 5 station for workers
- More than 50% of Line 5 ridership board metro stations beyond the m30 loop as their point of origins which is a sizable population impacted by service disruption
Harnessing location data for smart cities and suburbs
All in all it is clear that leveraging location data to optimize infrastructure and mobility decisions brings great value to governments who want to bring transparency to their decision-making.
Citizens want to live in smarter more efficient cities and Location Intelligence is an enabler for leaders who want to make data the cornerstone of their public service strategy.
Find out more about how you can use CARTO to optimize city services using location data at our upcoming webinar!
Harnessing the Power of Location Intelligence for Cities
[Webinar] Helping local government officials turn location data into smart city solutions


