

More Out of the Box Styling Power and Upgraded CartoCSS with 2.0


With the recent release of 2.0 you have probably noticed a our complete overhaul of styling features in CartoDB. In this post we are going to explore those features in detail. We'll look at the changes to the user-interface and some of the great new styling upgrades that come with this release. Some things to look for below include new point-and-click visualization support for new CartoCSS methods new the ability to add a third dimension to your polygons.
New user-interface for styling your maps
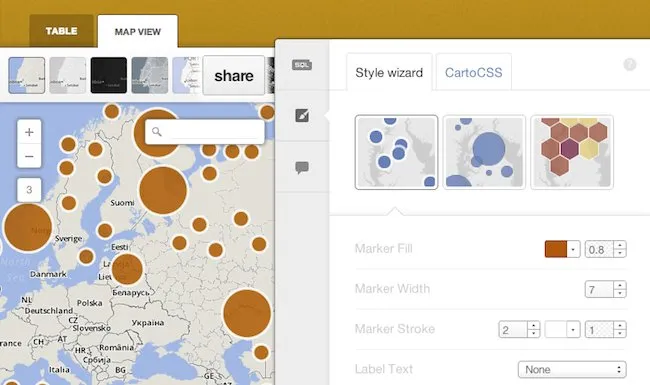
The styling interface on the maps tab from your dashboard has gotten a complete overhaul. Your ability to use some of our point-and-click styles is now more closely integrated with the CartoCSS editing window. We've also started to add more easy to use styles for you. Options include new density maps both hexagon and grid based and simple ways to add labels to any of your maps. Take a look through the color-ramps including in CartoDB 2.0 we have added a lot more options since the last version. This will let you really customize enhance and interpret your choropleth and density maps.
New infowindows basemaps and shared map features
We've included a much more flexible set of basemaps for you to select from in 2.0. One really interesting one is the ability to remove the basemap entirely a feature that can be really useful for infographics or non-geographic based visualizations. We've also made infowindows much more flexible and easy to use. You can now customize colors content and labels in your map infowindows using the new infowindow editor.
We've also given you a lot more control over how your shared maps look. That includes a simple interface to toggle on/off some of the core features. CartoDB tables all now have a Description that you can fill out (find it right below your table name). You can publish these with your maps to help share more information about the maps you are creating.
Updates in CartoCSS and advanced styling methods
Another thing that makes 2.0 even more exciting CartoDB now supports some new and exciting additions to CartoCSS. Now you are able to add in such things as buildings 3D visualizations new blending abilities the use of query results as variables in the style and a host of other neat stuff. The example above is even more interesting than just adding dimension it also uses a value returned by SQL to style the buildings with. The data here is a small set of polygons form Open Street Map without an estimate of building height I needed to make it up.
##_INIT_REPLACE_ME_PRE_##
SELECT the_geom_webmercator st_area(the_geom_webmercator)/400 as height
FROM osm_export_polygon
##_END_REPLACE_ME_PRE_##
In the above I simply created a ‘height' column by measuring the area of the polygon (and then making it a reasonably smaller value by dividing it by 400). Next I used the new CartoCSS capabilities based sizing building by the returned height value
##_INIT_REPLACE_ME_PRE_##
osm_export_polygon{
line-width: 8;
line-color: rgba(0 0 0 0.3);
building-fill:#aaaa77;
building-fill-opacity: 1;
building-height: '[height]';
}
##_END_REPLACE_ME_PRE_##
You can see it in the ‘[height]' portion of the above. There are many other neat features. One of my favorites is the ability to to color compositing. We have different tutorials that will help you explore some of those methods. Check them out over at CartoDB tutorials.


