What's New in CARTO - Q1 2023


During the first quarter of 2023 we have been working on some very exciting new features and enhancements to the CARTO platform to ensure our users have access to unparalleled spatial analysis and visualization capabilities natively in the cloud, extending Google BigQuery, Snowflake, Redshift and Databricks with a unique geospatial toolset.
In the past months we have extended the availability of CARTO Workflows to all of our supported data warehouse platforms, added support for SQL parameters and new cartographic enhancements in Builder maps, features for optimizing your tables for more performant geospatial analysis and much more. Let’s take a deeper look at the product releases we have delivered during the first three months of 2023, and outline how you can extract the most value from these great, new features. And remember to regularly check our What’s New page to keep up to date with our most recent developments.
CARTO Workflows, now available to all users
CARTO Workflows, our new tool to enable users to automate their data preparation and analysis pipelines with an intuitive drag-and-drop interface is now available to all users and with support to run on top of BigQuery, Snowflake, Redshift and PostgreSQL-based data warehouses. Workflows allow users to design, run & share analysis flows leveraging the scalability benefits of cloud platforms, without the need for any advanced SQL knowledge. During the last couple of months, during which we have kept Workflows in a beta phase, we have extended its support for all of the different data warehouses, enabled workflow sharing with the other users in an organization account, implemented enhancements on the components explorer and the canvas, and incorporated several new analysis components to make this tool even more versatile.
Support for SQL parameters in Builder maps
One of our favorite initiatives from this last quarter has been adding support for SQL parameters in Builder. SQL Parameters are placeholders in Builder that can be used on any SQL Query data source. After creating a new SQL Parameter, it can be added manually to one or more SQL Query data sources. Once added, the actual value for the parameter can be defined through a control UI in the right side panel 'Parameters' tab. Users can select values from the UI that will replace the placeholder in the SQL query and therefore modify the data retrieved from the query and visualized as a layer on the map. Currently we support two types of parameters, for text and dates respectively. This new feature provides much more flexibility on how users can interact with their data in maps and unlocks an extensive range of new use cases.
Dynamic aggregation of point layers into quadbin grids and more cartographic enhancements in Builder maps
Users of Builder can now dynamically aggregate their layers based on large volumes of point data into a grid based on the quadbin spatial index. This feature, implemented using pure SQL in our Maps API, brings significant improvements in performance, and allows aggregation operations on the data from the original point-based source.
Additionally, CARTO Builder now also supports adding labels to point layers, with a set of improved features such as the support for primary and secondary labels on each point, better typographic options and a label collision control mechanism.
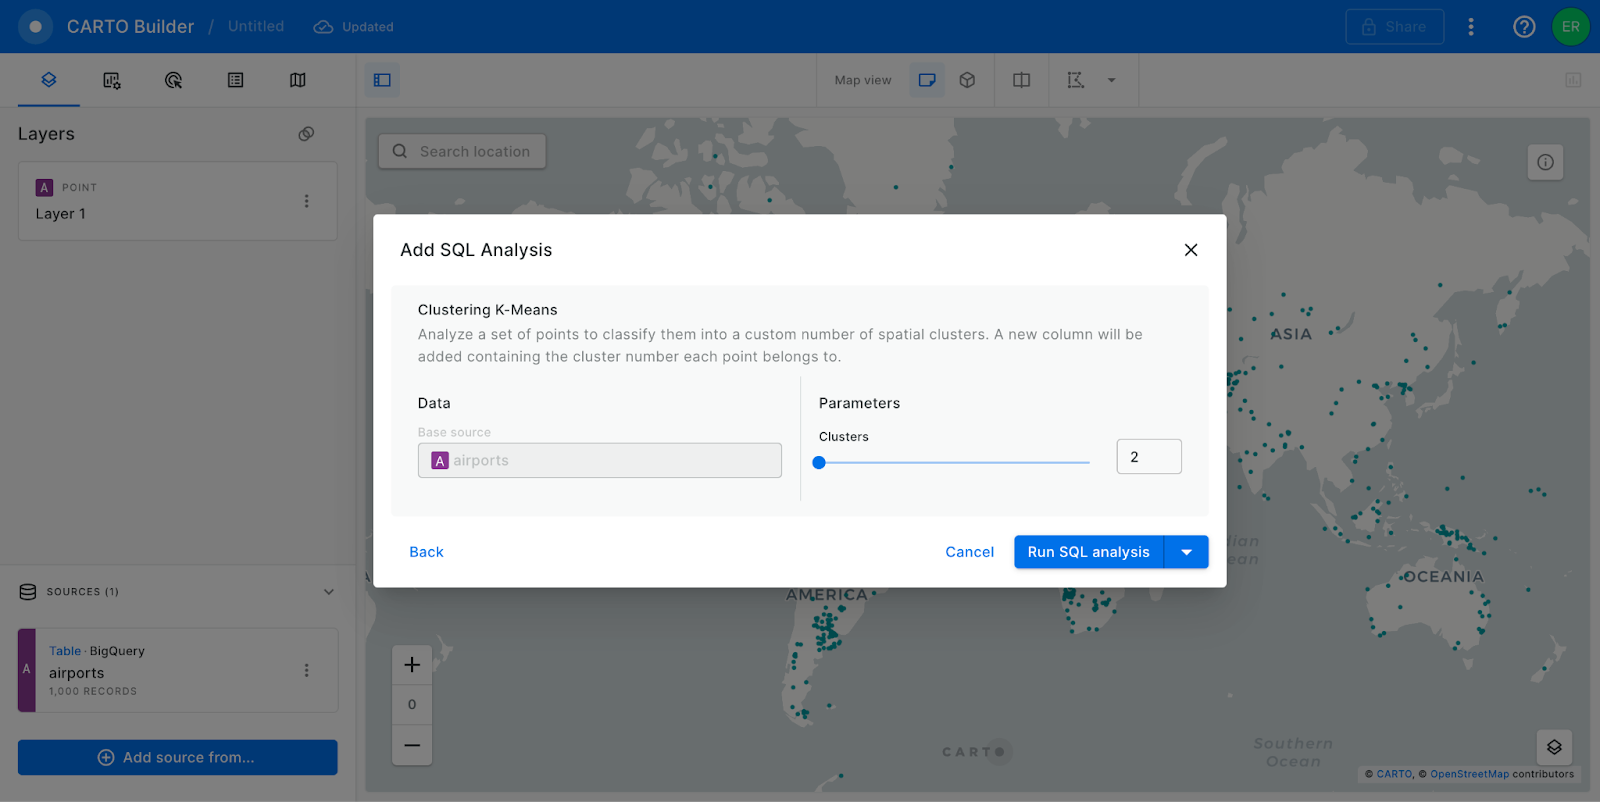
New SQL analyses in Builder available for Redshift and Snowflake connections
We have completed the available SQL analyses in Builder for data sources accessible via connections to Redshift and Snowflake with support for creating buffers, intersecting and aggregating data, and performing K-means clustering. Check out the list of analysis available for each data warehouse and further documentation about each of them here.
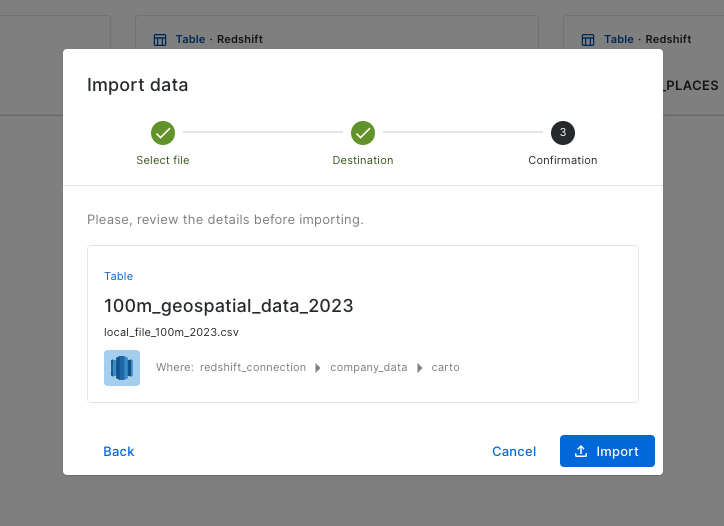
Support for importing geospatial files into Redshift
Additionally, users of AWS Redshift now have a new way to import geospatial files to their cluster by leveraging the CARTO Import API. With this new functionality, CARTO users working with Amazon Redshift will be able to quickly get their geospatial data ready for advanced analysis and visualization, from no-code tools like Builder or Workflows to geospatial development libraries such as CARTO for deck.gl.
Ensuring your data is always optimized for geospatial analysis
Our goal is to make CARTO the best solution for geospatial visualization and analysis of large scale datasets by leveraging the scalability of the leading cloud data warehouse platforms . However, dealing with such large datasets requires paying special attention to performance and optimization. Now, whenever CARTO detects that one of your tables could perform better according to our performance considerations, we show a warning in Data Explorer and Builder, so you can take action immediately. To understand in detail how these optimizations work, take a look at this guide.

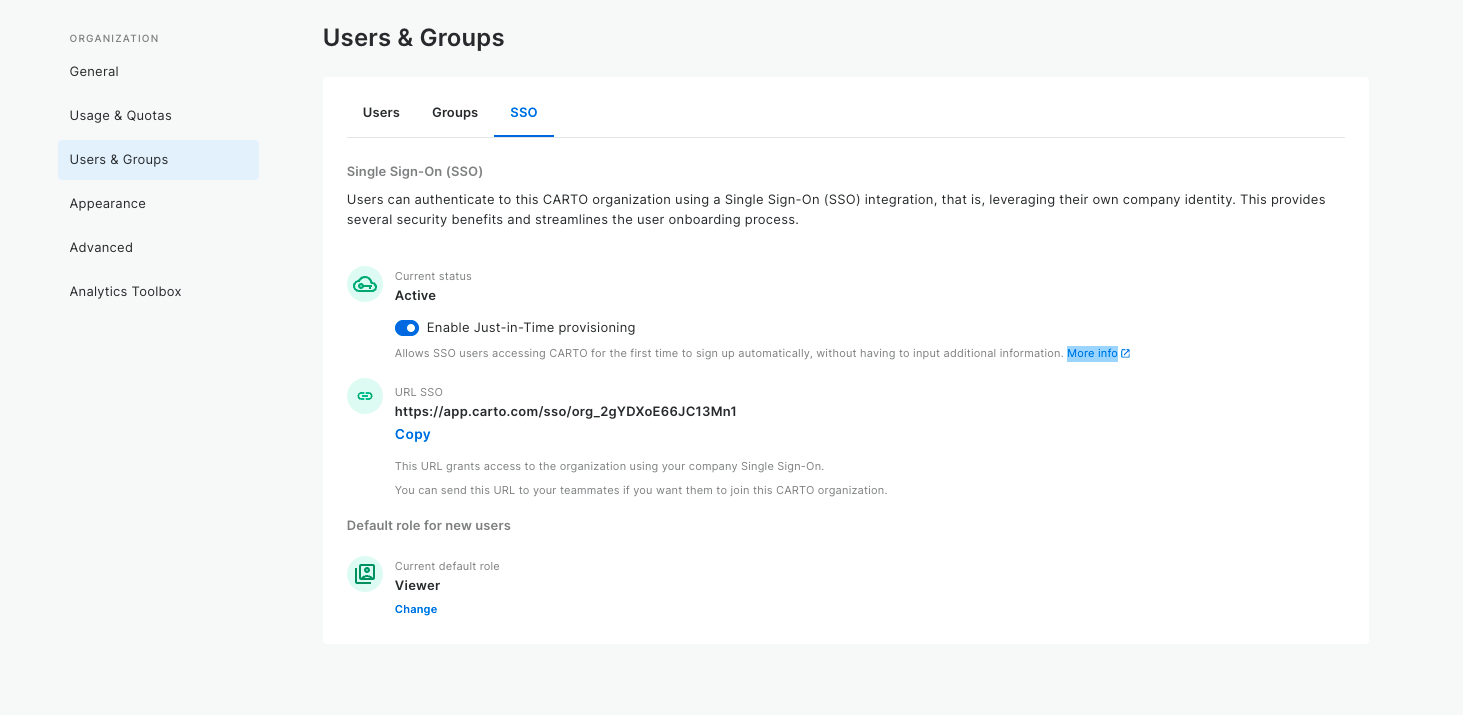
Configuring the default role for your new users and SSO just-in-time provisioning
This last quarter we have added new features for account administrators to manage new users more easily and predictably. First, admin can now choose which role should be applied to new users, and by default it will be set to “viewers” following the least-privilege principle. Find more information about how to manage roles in CARTO in our documentation.
Secondly, admin users of organizations that have their own SSO login can now decide whether new users will get additional questions when onboarding into CARTO or now. If it’s enabled, we will just provision their user as soon as they login, without any extra steps. This new feature has been detailed in the documentation about SSO at CARTO.
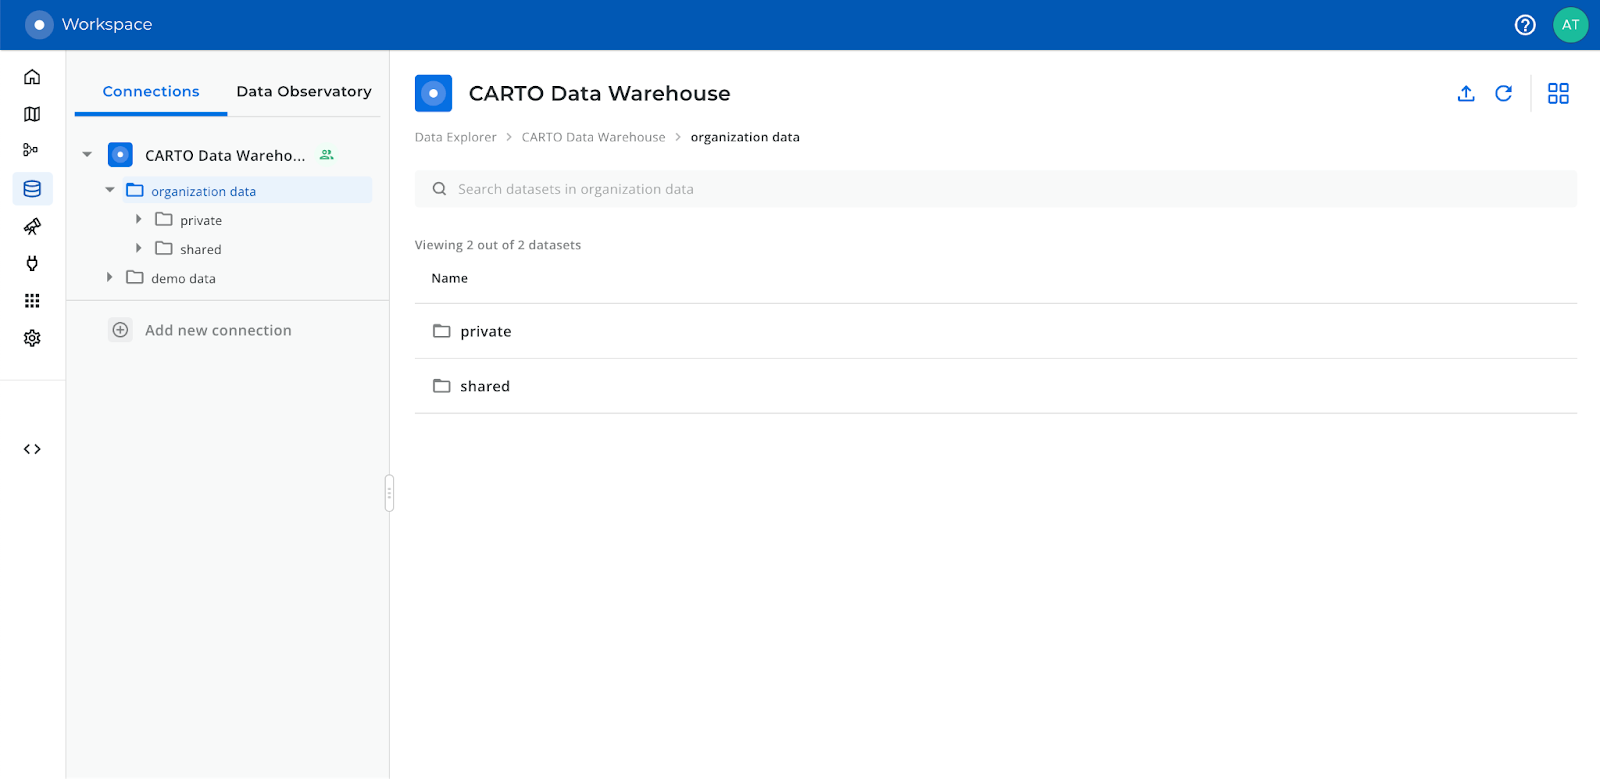
New space for private data available for every user in the CARTO Data Warehouse
Users leveraging the resources available in the CARTO Data Warehouse connection will see that they now have two datasets (represented as folders) inside their organization data: private and shared. The new "private" dataset is a unique dataset for each user, and all the tables and tilesets in this dataset will only be available to that specific user. Private datasets have a unique qualified name that identifies the user, extracted from their email.
Functions to create composite scores now available in the Analytics Toolbox for BigQuery
In March’s release of the Analytics Toolbox for BigQuery, we added a new set of functions in the statistics module to enable users to create composite scores. A composite score is an aggregation of multiple variables which aims to measure complex and multidimensional concepts which are difficult to define, and cannot be measured directly. Examples include innovation index, human development, environmental performance, and so on. To learn more about this functionality please check this guide and our SQL reference.
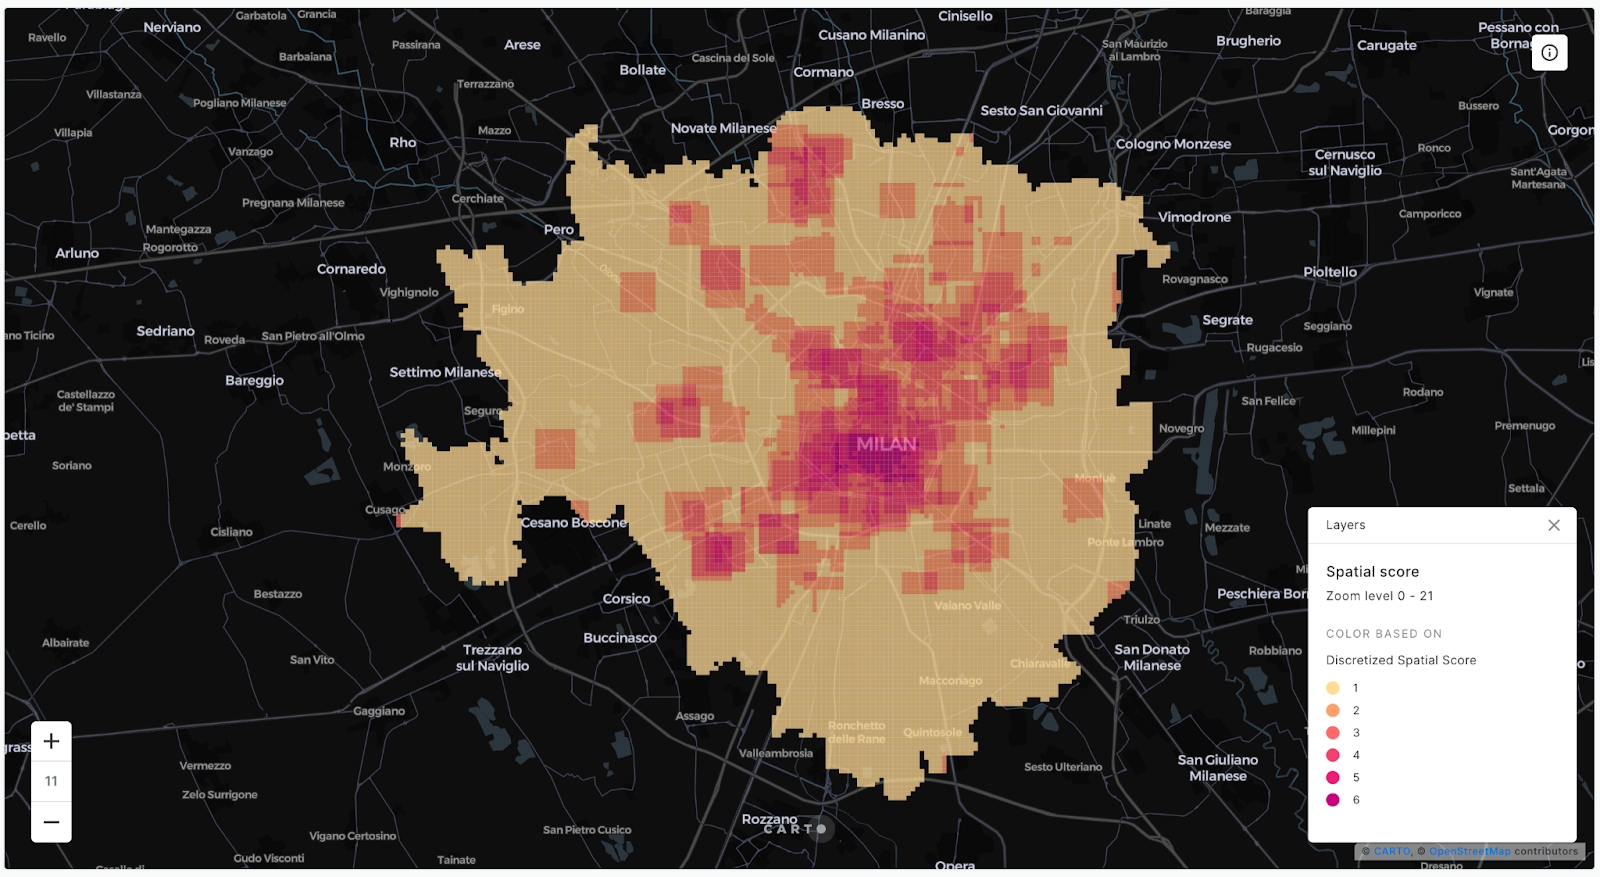
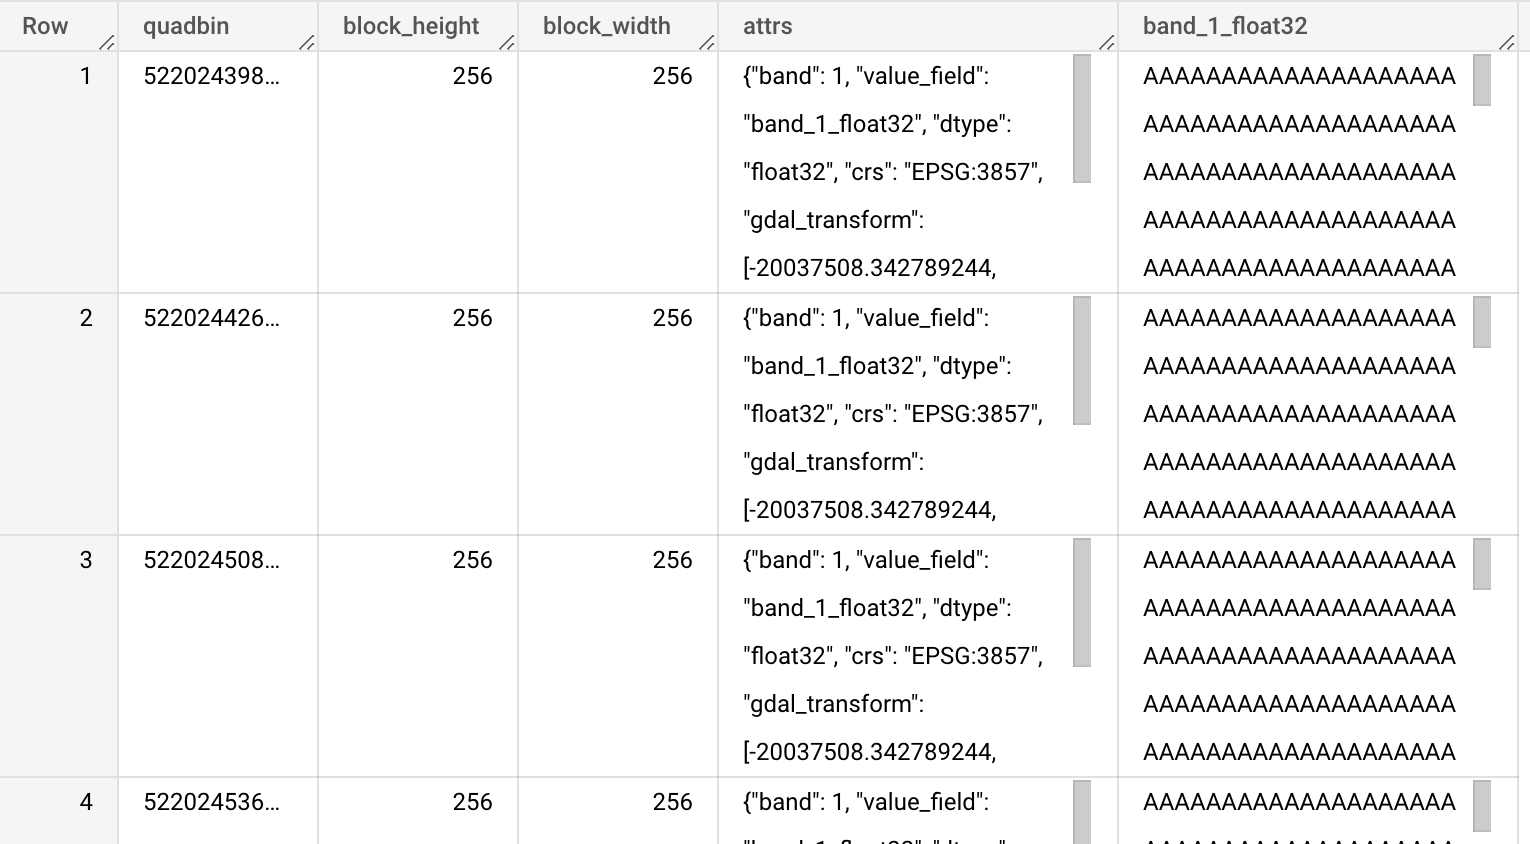
Raster support in BigQuery with a new module in the Analytics Toolbox
In the January release of the Analytics Toolbox for BigQuery, we have launched in beta our new raster module. This feature offers a set of functions to operate with raster data natively in BigQuery, benefiting from the processing speeds and scalability of this data warehouse.
Alongside the raster module in the Analytics Toolbox, we have also made our Raster Loader available, built in collaboration with Makepath. This publicly available Python library works as a tool for loading and optimizing GIS raster data into cloud-based data warehouses.
To learn more about this new module please check our product documentation. We have also published an example and a blogpost about this.
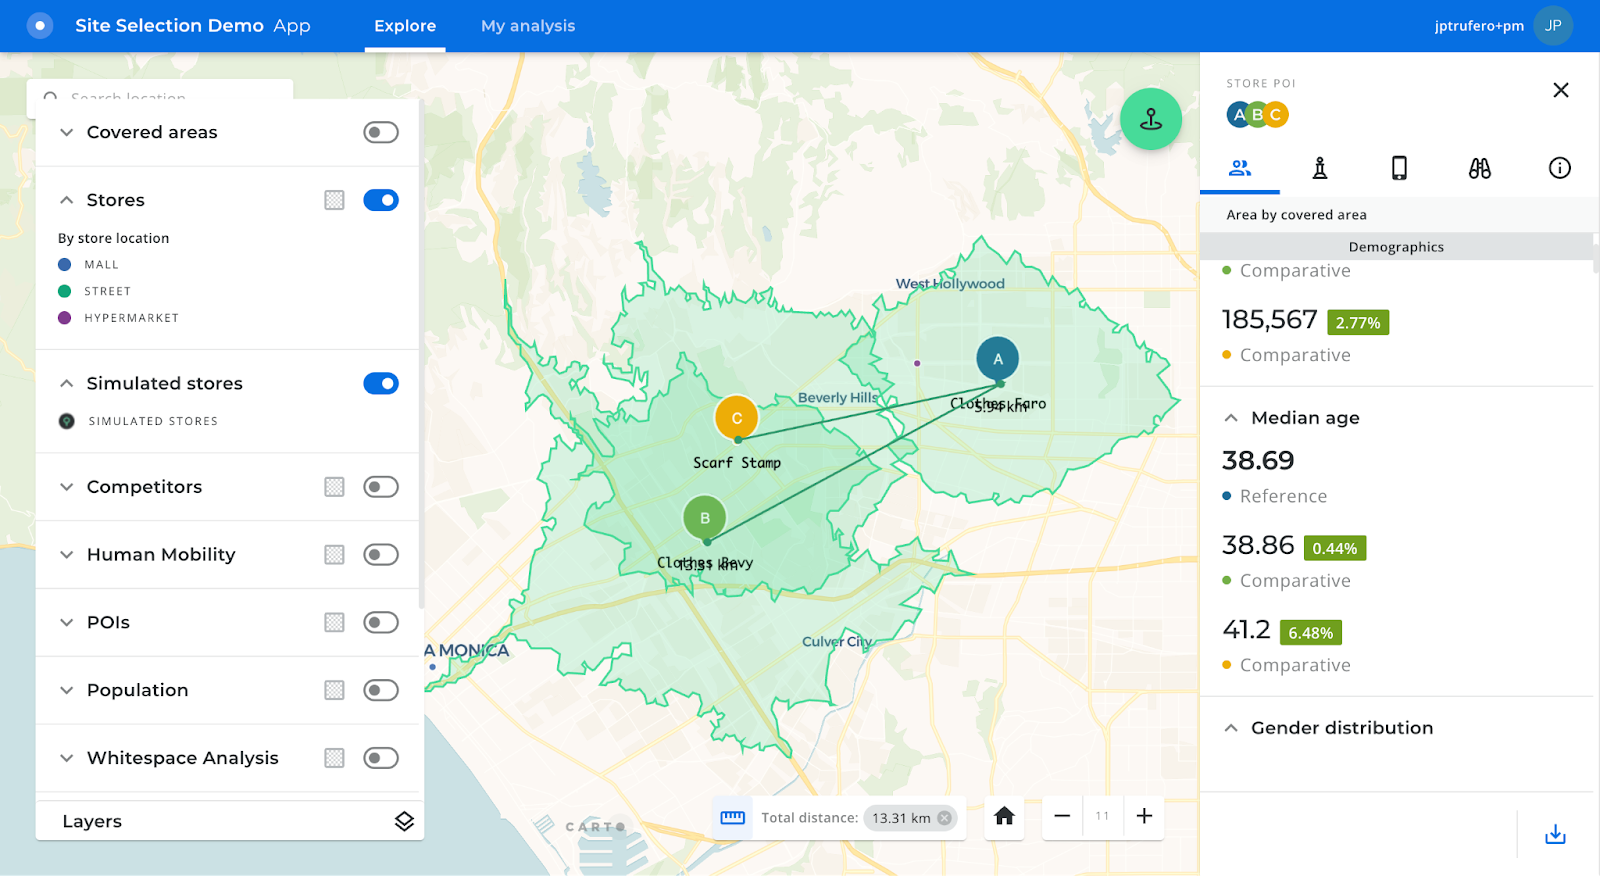
Richer insights and scalability improvements in the Site Selection app
Thanks to a new set of releases, users of our Site Selection application now have access to much richer insights, with a new comparative mode to analyze the trade areas of different stores against each other; and an expandable chart section giving access to more insights based on the available data. We have also added information about the overlapped area between trade areas of different stores (existing and simulated), as a first hint towards potential cannibalization. Benefiting from the scalability improvements of the platform, Twin Area and Whitespace analyses can now be launched at a national level, providing much more powerful insights with greater coverage. Finally, we also added a measurement tool to calculate the distance between existing stores, simulated locations and those of competitors.
We are really excited by this wave of enhancements to the CARTO platform and would like to thank our customers and partners for guiding us on this journey; and remember you can stay up to date on our most recent product releases by regularly checking our What’s New section.
If you would like to find out more about the enhancements we have developed and see the CARTO platform in action, why not sign up to our Quick-Start Training, taking place on Tuesday, April 25th @ 11AM EST (5PM CEST).