What's New in CARTO - Q3 2022


This month we celebrate the first anniversary since the General Availability launch of the cloud native CARTO platform. During the past 12 months we have continued to focus our investments in platform development based on direct user feedback and today we can offer unparalleled functionality for customers focused on cloud native spatial analytics at scale.
Since the announcement of CARTO’s Spatial Extension for BigQuery last October we have continued with our cloud native mission bringing advanced geospatial analysis and visualization capabilities on top of Snowflake Redshift and Databricks. You can see the result of this remarkable team effort summarized in our Q1-2022 and Q2-2022 product updates.
This quarter we have added exciting collaboration options new customization capabilities widgets and filters in Builder maps; geocoding and isolines procedures that can be executed natively in BigQuery in addition to geostatistics and new domain-specific functions in the Analytics Toolbox and much more!
Today I am pleased to highlight some of the main releases we have delivered in the past three months; if you would like more details then please refer to our product documentation. Furthermore we are excited to introduce a brand-new “What’s New” section of our documentation where you can keep fully up to date on new features improvements and fixes that we bring to the platform on a regular basis. So let's dive in and take a look at our main developments during Q3 2022!
Multiple editor users working on the same map
Editor users can now collaborate on the same map in an asynchronous mode thanks to our new collaboration options. When the map owner has enabled this feature editors can now request taking over the editing of a map. This is a long-awaited feature and we are excited to be able to empower users to work and collaborate more on their spatial analyses.
This functionality is currently under private beta please get in touch with your CARTO representative or via our Support team at support@carto.com so we can activate this feature in your account. We plan to release in general availability during the first half of Q4 2022.
New customization capabilities widgets filters and data refresh options in Builder
We continue to enhance Builder our flagship tool to create interactive maps on top of your cloud data warehouse of choice. This last quarter we have released custom icons as markers for point data in Builder maps. This feature lets you use one from our preset collection and also upload a custom icon in both .png or .svg formats. Different markers can also be defined by the values of a categorical column and can even be rotated based on a numeric value; this enables a host of different use-cases such as rotating an arrow based on azimuth for telecommunication antennas or visualizing the wind direction in weather maps.
We also incorporated a new type of widget the Range widget this feature allows users to filter data based on precise numeric ranges.
CARTO users now also have the option to filter their data based on specific dates and periods of time with the new date filter which queries the data table in their data warehouse directly.
CARTO maps now load faster thanks to improvements in our caching strategy. Additionally users and developers have finer control over the freshness of data in their private and public maps both while editing them but also by programming data refreshes when the map is published.
Spatial Index and Point Aggregation tilesets now available from Data Explorer
Our users can now generate both Spatial Index and Point Aggregation tilesets on their own data tables directly from the Data Explorer UI. This feature complements the existing workflow with the possibility of generating tilesets of large datasets based on spatial indexes (H3 and quadbin) and points by defining aggregations on the features of interest. The platform detects automatically if the table is based on spatial indexes or points and provides the new options in the same "Create Tileset" wizard.
Address geocoding and isoline calculation of your data natively in BigQuery
We are very excited to announce that users of Google BigQuery can now geocode their tables with address data and create trade areas around locations based on drive/walk time isolines natively from their data warehouse. Please check the SQL Reference of our Analytics Toolbox for BigQuery for more details and also refer to our examples on how to gecode your data and create isolines. Note that these functionalities are also enabled from the Data Explorer and Builder tools. For more details on isoline calculation read our recent blog post.
New analytical functions for Customer Segmentation and Cannibalization analyses for data scientists in CPG and Retail
This quarter we have released a new domain-specific module in the Analytics Toolbox for BigQuery to solve advanced geospatial analysis for the CPG / FMCG sector starting with customer segmentation. We now offer a set of procedures that allow users in that industry to solve this use-case end-to-end from the generation of trade areas to running multiple merchant segmentation scenarios based on a customisable set of spatial features.
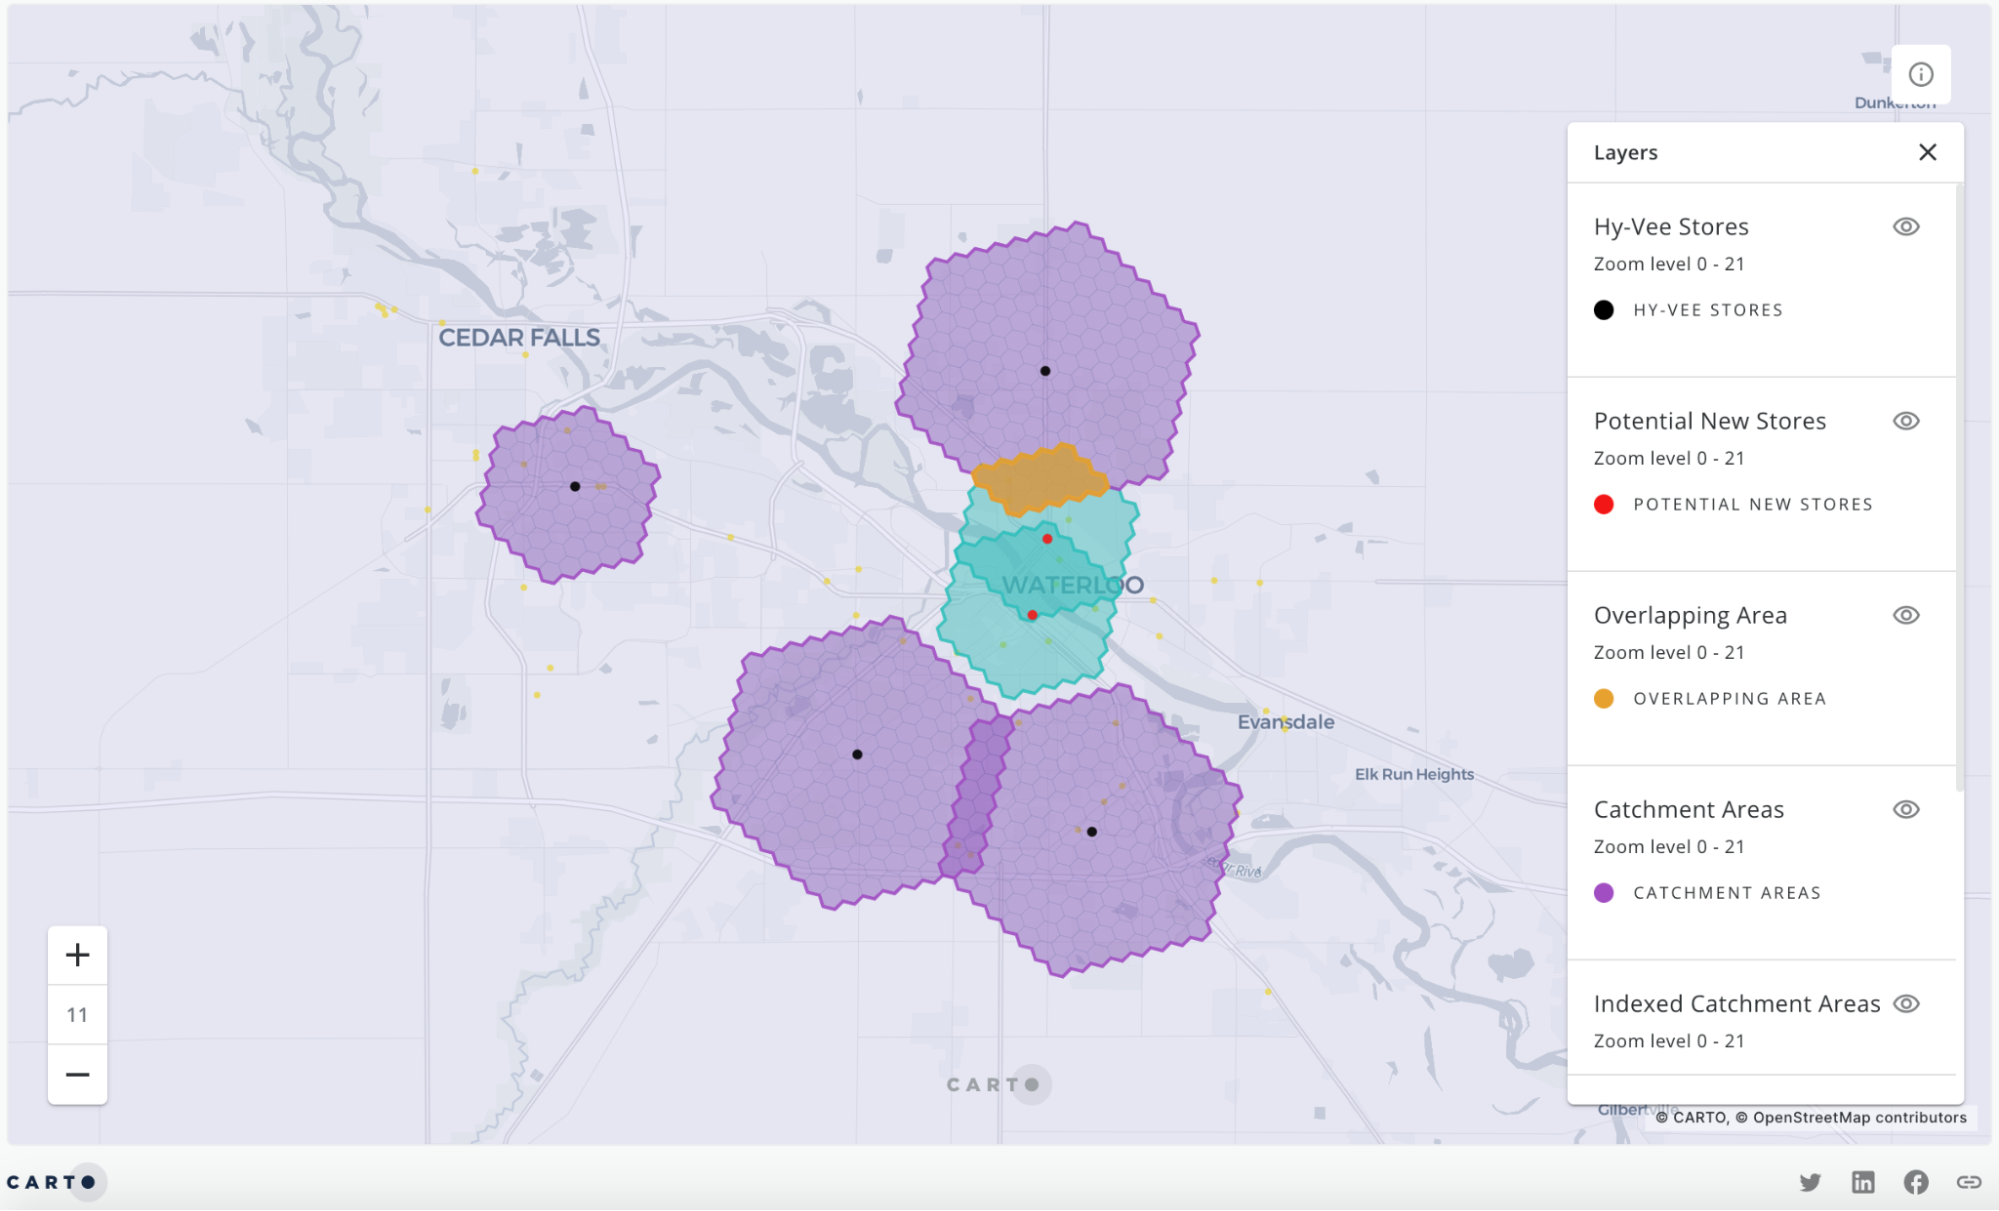
In addition retailers working with Google BigQuery and CARTO can now analyze the potential cannibalization caused by a set of new stores on their existing network based on the overlap of the different trade areas in terms geography but also in terms of any other spatial feature that the user wants to include in the analysis (e.g. population number of households). Check out our documentation and this example to learn more about how to run this analysis.
Advanced geostatistics and data enrichment functions for Redshift users
Users of Amazon Redshift can now access a new set of geostatistics functions to expand the spatial capabilities of their data warehouse with CARTO’s Analytics Toolbox. We have released Getis-ord Gi* Moran's I and p-value methods that run natively with your data hosted in Redshift. Additionally we have also released a set of data enrichment functions that can be found in the data module of the Analytics Toolbox.
We are really excited by this wave of enhancements to the CARTO platform and would like to thank our customers and partners for guiding us on this journey; and remember you can stay up to date on our most recent product releases by checking our What’s New section.
If you would like to find out more about the enhancements we have developed and see the CARTO platform in action why not sign up to our Quick-Start Training taking place on 4th November.