

Understanding the Impact of Tree Equity in Chicago


The Healthy Regions + Policy Lab (or HeRoP) at the University of Chicago integrates innovative GIScience public health and statistical approaches to explore understand and promote healthy regions and policies. As a part of their Spatial Data Science for Good initiative their goal is to put evidence-based research in the hands of decision makers to help advise on health and equity related issues in the City of Chicago.
As a part of this mission HeRoP was tasked with examining the impact that varying degrees of tree cover had on the health and social outcomes of their community. In partnership with Bloomberg Philanthropies Vital Strategies and the Chicago Department of Public Health HeRoP wanted to create a solution that would allow them to better measure and understand air quality at the neighborhood level as it relates to tree coverage. They also wanted to examine environmental drivers associated with air quality in different regions and how that impacts socially vulnerable communities.
Getting Started
HeRoP knew that in order to create an effective and impactful analysis they needed a flexible solution that would allow them to:
- Integrate a wide range of disparate data sources into one central platform
- Break down complex geospatial insights into a user friendly interface so that non technical stakeholders could understand and interact with the findings
- Create transparency around the data and analysis powering their tree equity research
To do so they turned to Builder, CARTO’s data mapping and visualization software to create their Tree Equity application. The ability to aggregate, analyze, and visualize multiple first and third party data sets within a central platform was a key feature for the lab.
Building the Solution
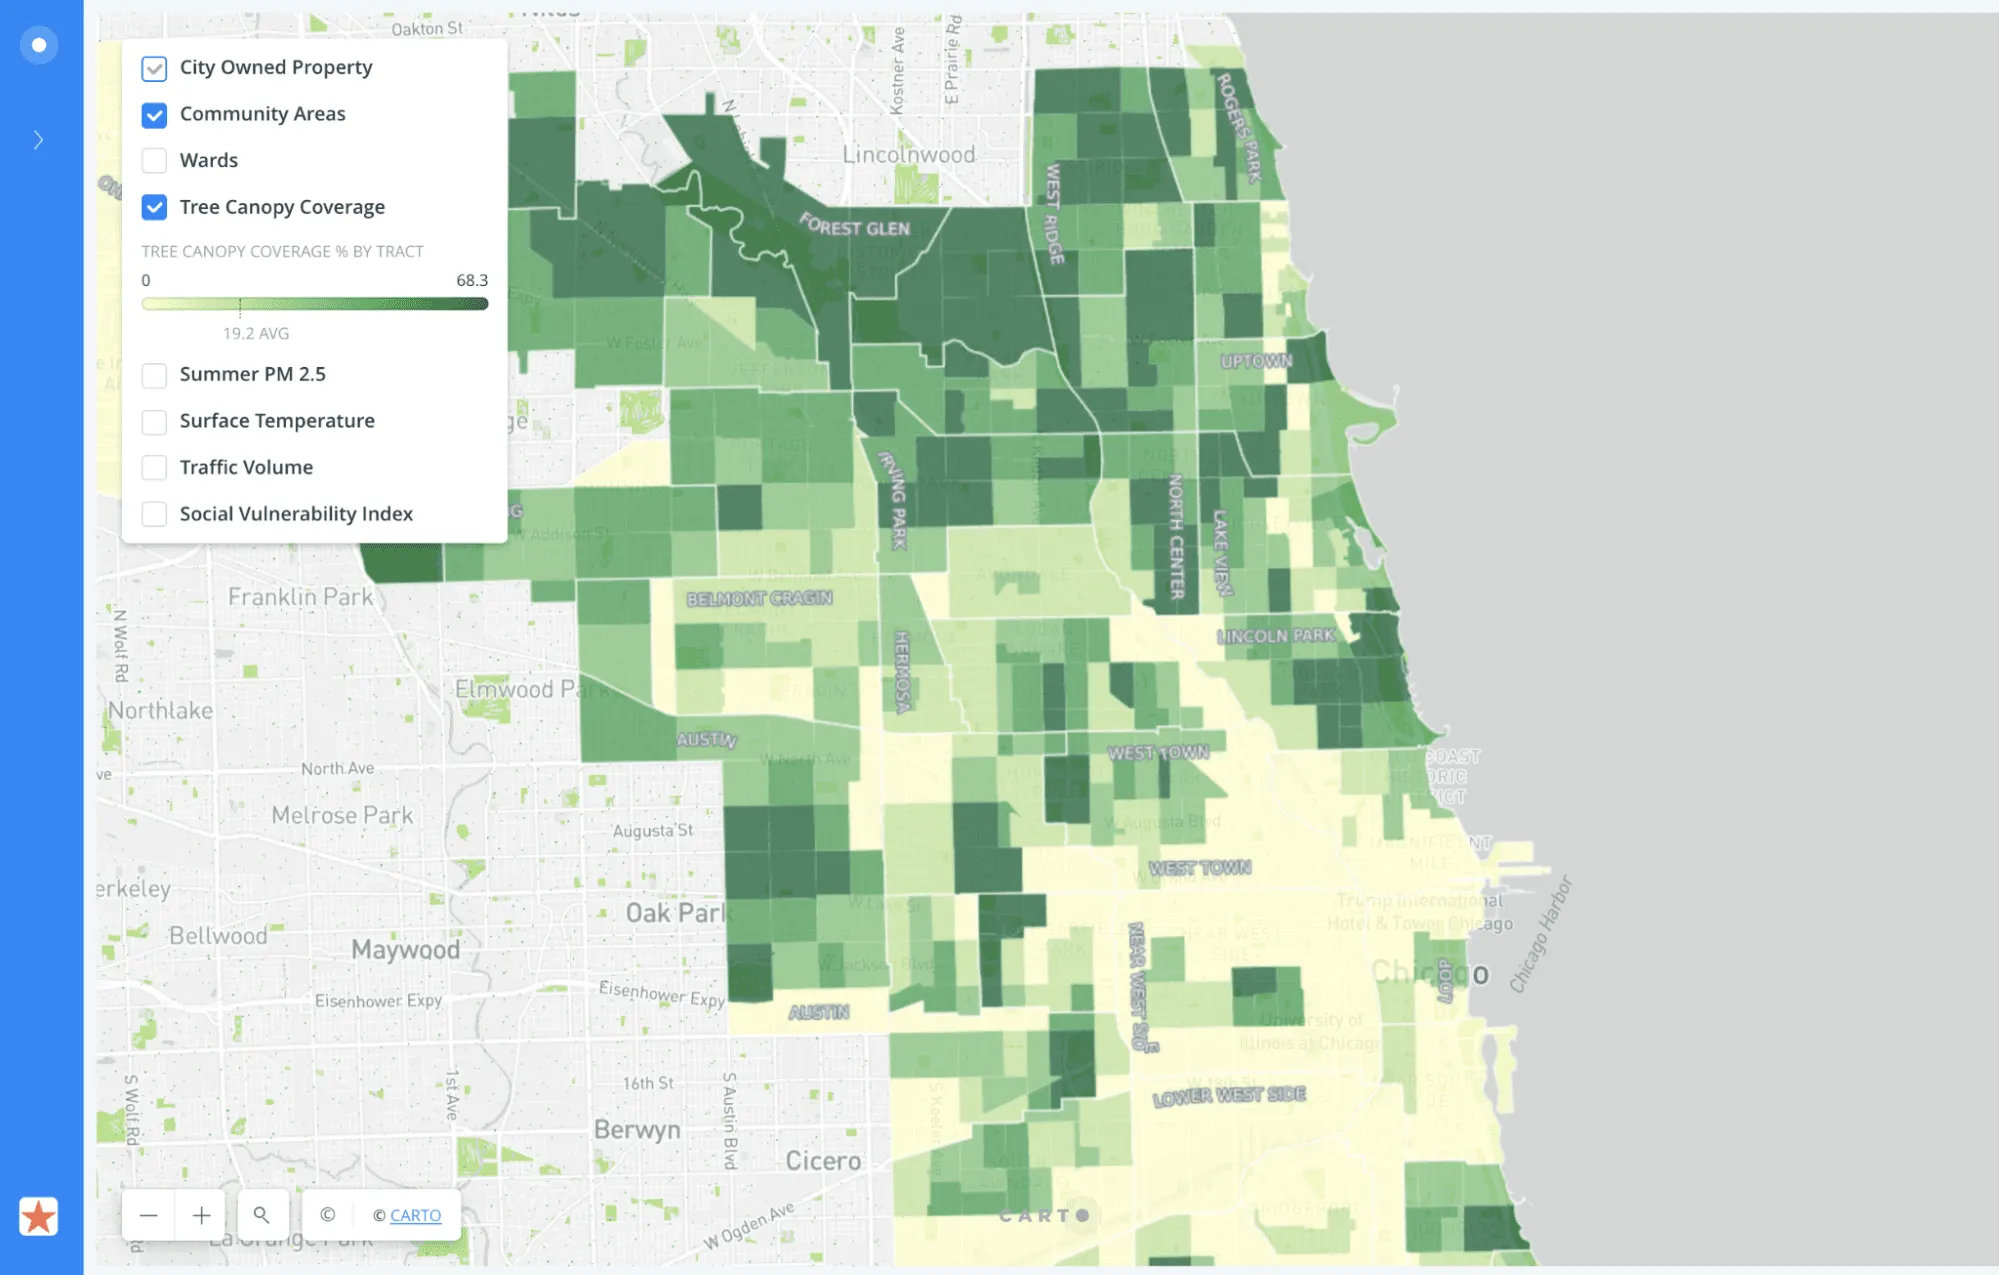
Using CARTO they ingested and integrated external data ranging from housing transportation, and hardship insights from the CDC to surface temperature data from NASA. With all of the data in a central place they could analyze natural factors like tree coverage against health and social factors such as traffic volume social vulnerability economic hardship and asthma.
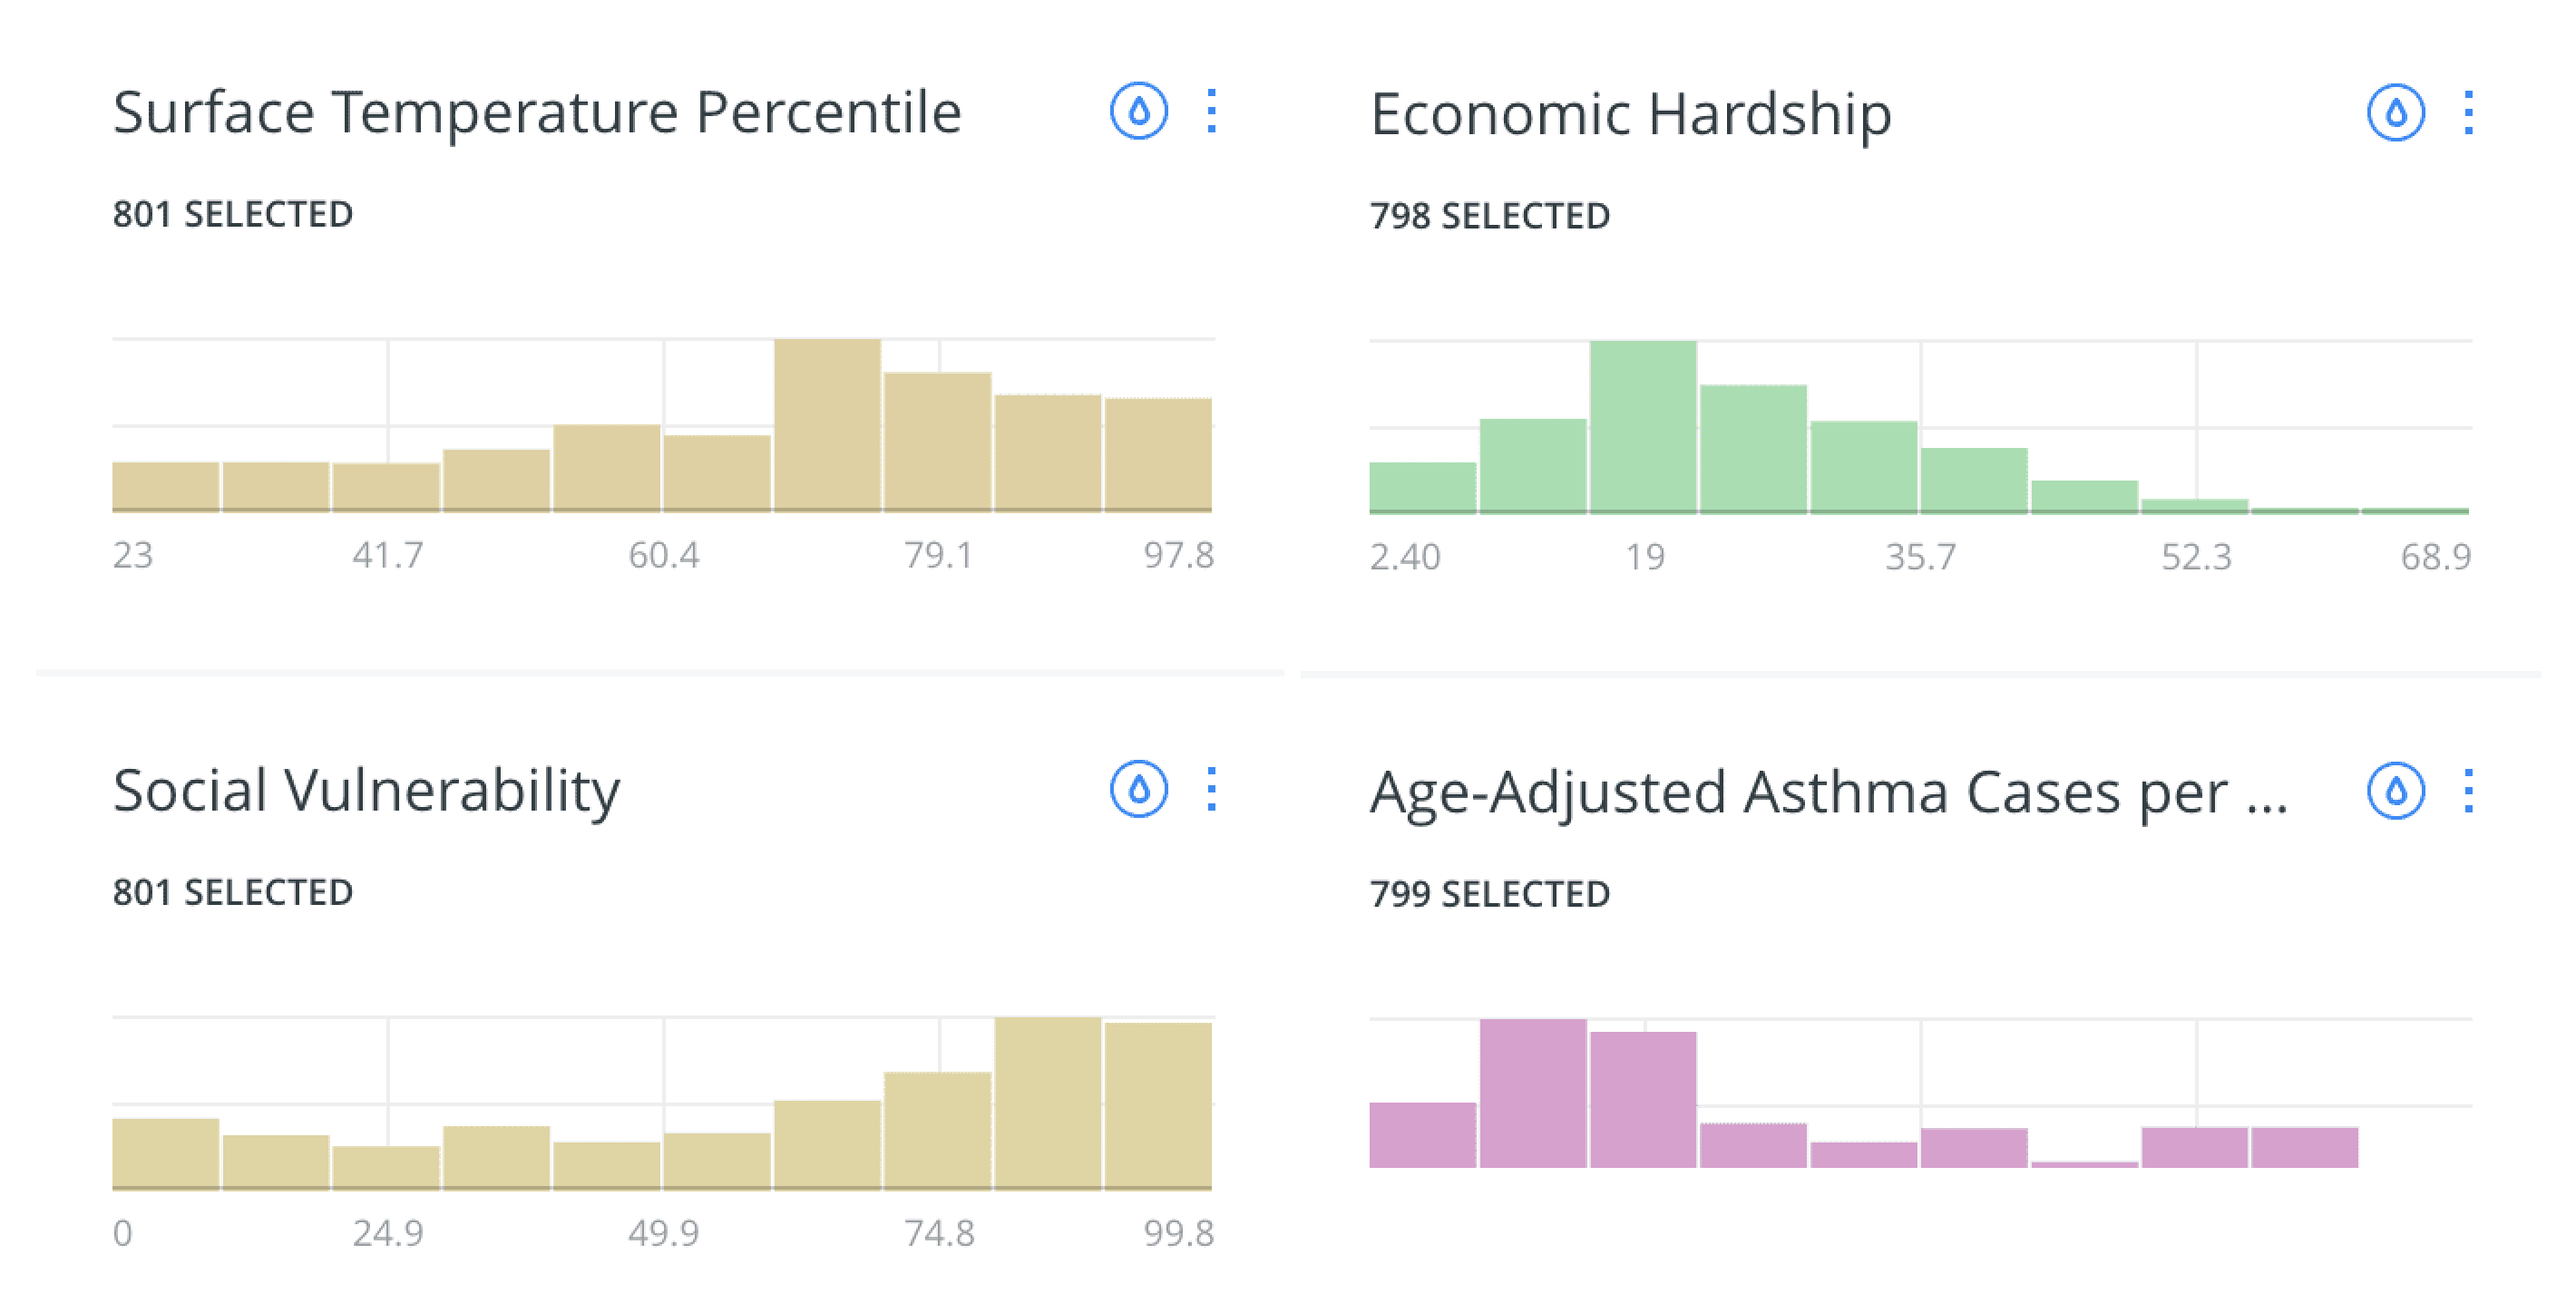
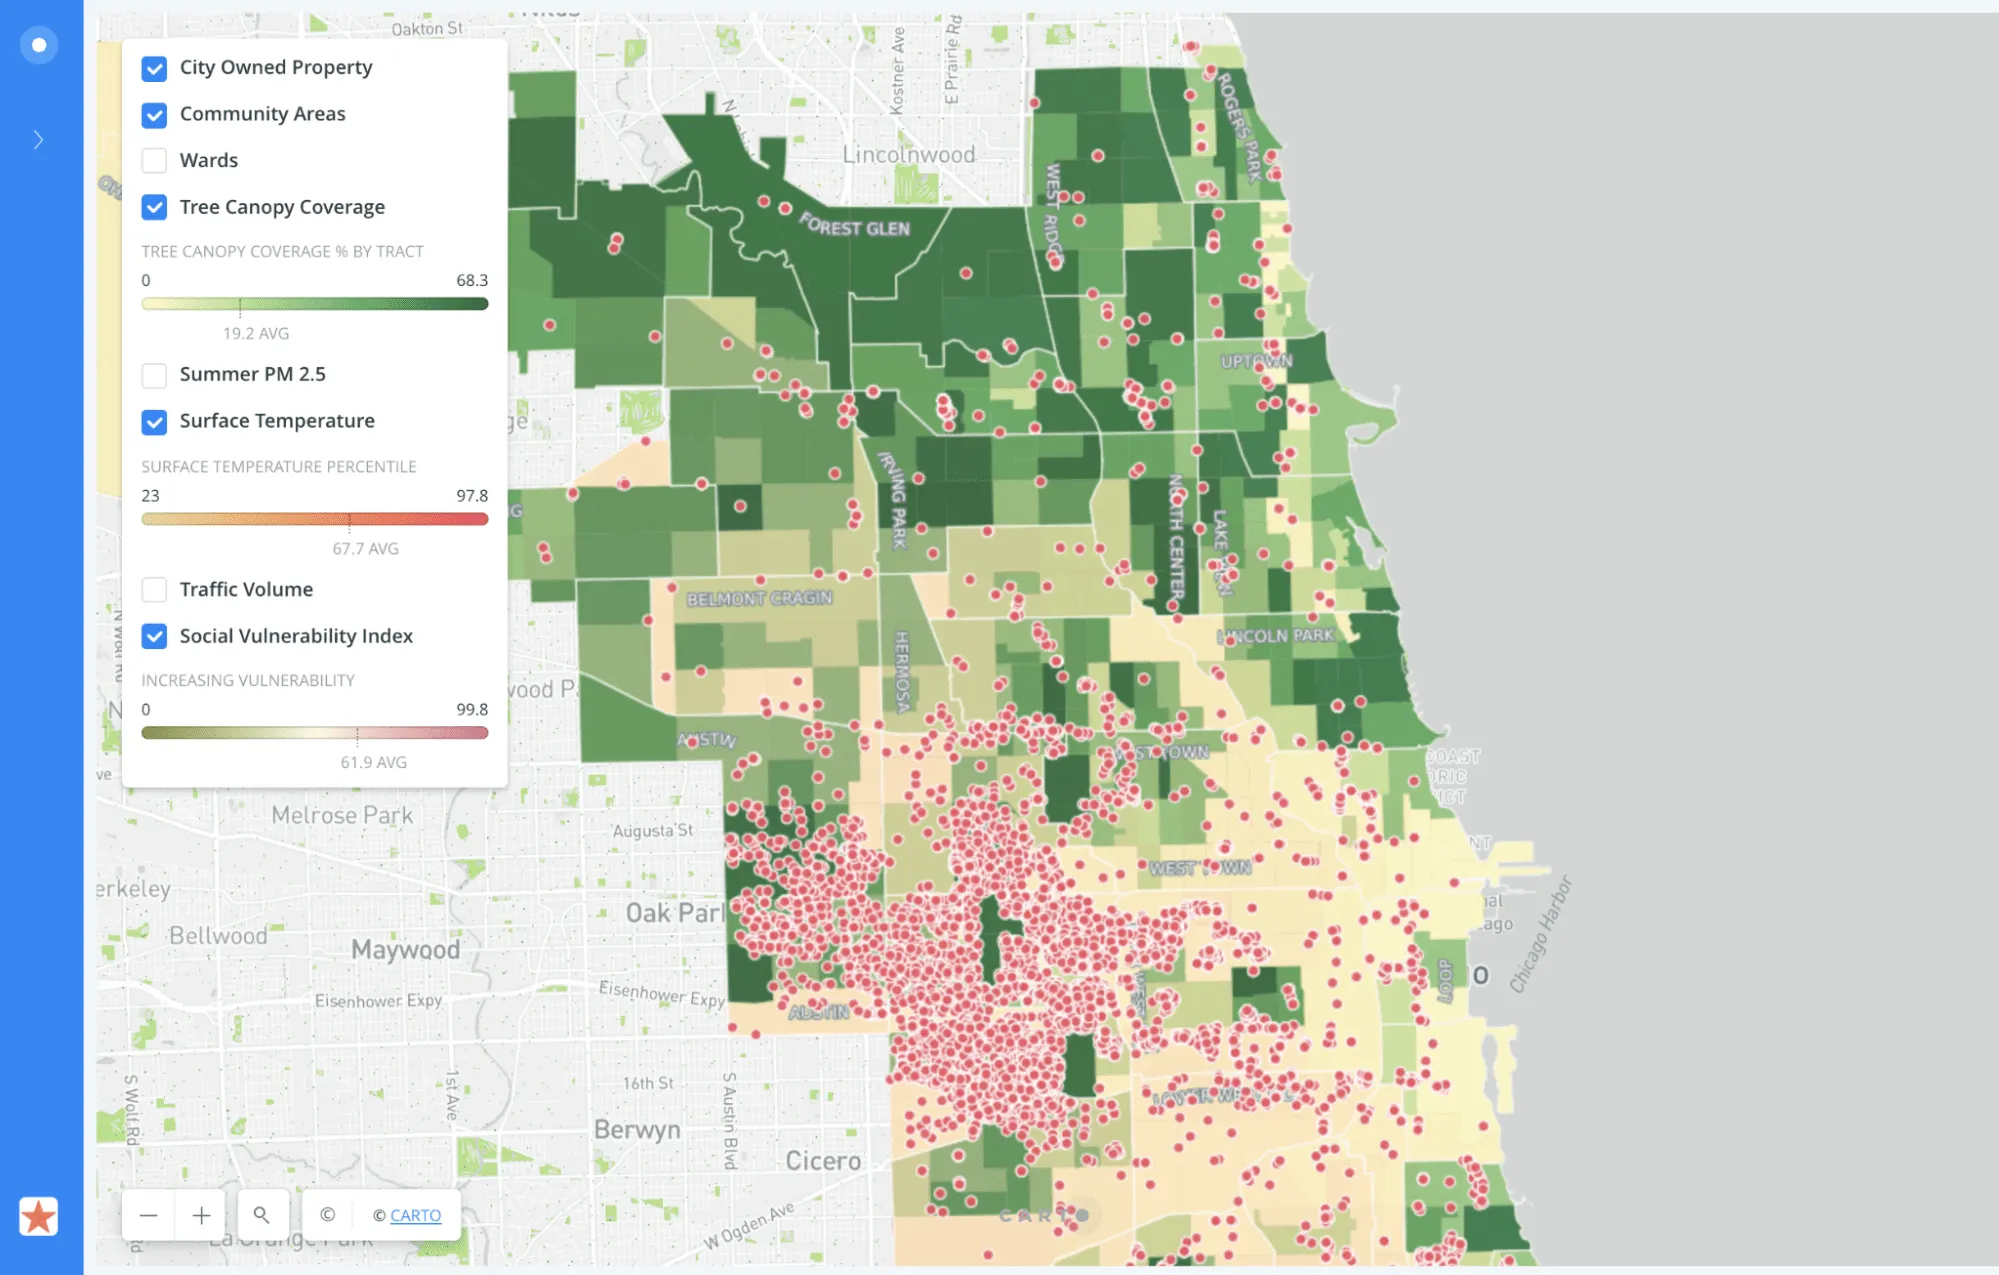
By visualizing the data with filterable widgets, the team could quickly toggle between data points and start extracting correlations between environmental and social factors with speed.
Because of the user-friendly nature of the dashboard they were able to share the analysis across teams organizations and stakeholders to ensure they were all working with the most up-to-date data and findings.
The Results
HeRoP’s data-driven and interactive Tree Equity solution was able to uncover insights surrounding the impact of tree coverage around the city and how that affects vulnerable communities. Due to the intuitive map interface the team was able to put evidence-based research directly in the hands of their partners and decision makers which allowed them to understand key findings like the fact that areas with fewer trees had association with higher air pollution models.
Since completing their research HeRoP’s equity solution has inspired other organizations, like the Paris Urbanism Agency, to consider similar practices of integrating and visualizing complex data in explorable map interfaces.
What’s more the tree equity research done by HeRoP has directly influenced the Mayor’s Office recently passed budget to commit $46 million in spending to help the city plant 75 000 trees over the next five years. Further developing tree coverage in the city will help fight and mitigate the effects of climate change and increase air quality while also supporting disinvested areas and communities within Chicago.


