

How to use CARTO.js with React


The beta version of CARTO.js has been released at the end of last year and as part of our testing program we have created several proofs of concept with different frameworks like React{:target="_blank"} or Angular{:target="_blank"}.
This proof of concept is a map showing prices of AirBNB rentals per night in the city of Madrid. Using CARTO.js we divide the apartments into seven categories according to their price assigning one color per category. In addition we create a dynamic histogram that indicates how many apartments belong to each category in the area of the map we are looking at.
Through this simple example we touch on the basic concepts of CARTO.js and we can see how to integrate it with different frameworks.
Basics of CARTO.js
CARTO.js is designed to work together with the CARTO platform in order to unlock the full potential of your geospatial data through a simple javascript API. Of course the first step is to create a CARTO account{:target="_blank"} and upload the data we want to process. Once you have a created account your username and an API key is all you need to get started!
Client
The carto.Client is the entry point to CARTO.js. It handles the communication between your app and your CARTO account and it contains the model of our application. In this model two types of objects can exist: layers and dataviews. Remember that these objects are useless by themselves and they must be added to a client in order to be interactive.
// Example of how a client is created
const client = new carto.Client({
  apiKey: '{API Key}'
  username: '{username}'
});
Dataviews
Dataviews are objects used to extract data from a CARTO account in predefined ways (eg: count how many rentals are available get the average price for an area …)
This data is considered raw since its form is simply a JSON object from which you can show the data in the way you want. If you want to display this data on a map you should use a layer.
To create a dataview you just need to indicate the carto.Source{:target="_blank"} and the operation{:target="_blank"}.
// Given the AirBNB dataset get the value of the most expensive rental
const maxRentalPriceDataview = new carto.dataview.Formula(airbnbSource  'price'  {
 operation: carto.operation.MAX
});
Once created and added to a client{:target="_blank"} this object will fire events{:target="_blank"} containing the requested data.
// Add the dataview to the client
await client.addDataview(maxRentalPriceDataview);
// Wait for the server to give the data
maxRentalPriceDataview.on('dataChanged'  newData => {
    console.log(`The highest AirBNB rental in madrid costs: ${newData}€`);
});
Layers
Layers are object used to extract data from a CARTO account and represent them on a map.
As in dataviews they need a carto.Source{:target="_blank"} that indicates where to extract the data. They also need a carto.Style{:target="_blank"} that contains the information about how the data should be displayed.
const rentalsLayer = new carto.layer.Layer(airbnbSource airbnbStyle);
Display carto.Layers in a map
When layers are created they should be added to a client{:target="_blank"} in order to be displayed in a map.
Calling client.getLeafletLayer{:target="_blank"} you can get a native leaflet object grouping all carto.layers contained in the client. You just need to add this object to your map to view the data! You can do the same with Google Maps in case you want to use CARTO.js with it as well.
This object will remain linked to the client. This means that any changes in the client layers will be immediately reflected in the map. (eg: you hide a layer{:target="_blank"} or you change the layer style{:target="_blank"} …)
How to integrate CARTO.js in REACT
You can get the code used throughout this example at cartojs-react-example repository
We used create-react-app{:target="_blank"} to scaffold the basics of the application.
Our project structure looks like this:
src/
├── components
│   ├── Histogram.css
│   ├── Histogram.js
│   └── Layer.js
├── data
│   └── airbnb.js
├── index.js
└── utils
    └── index.js
- index.js: the entry point of our application.
- components/Histogram: a widget showing how many rentals are in each one of our price categories.
- components/Layer: a component used to display rentals in a map.
- data/airbnb.js: contains the source and default style for the AirBNB dataset.
- utils/index.js contains a function that creates custom cartoCSS{:target="_blank"}.
Index.js
This is the entry point of the application. It contains the main component{:target="_blank"} of our application which is initialized with a state and a cartoclient as follows:
// We track map's center and zoom and the layer style and visibility
state = {
  center: [40.42  -3.7]
  zoom: 13
  nativeMap: undefined
  layerStyle: airbnb.style
  hidelayers: true
}
// Manages the comunication against the server and will keep a list of all layers and dataviews
cartoClient = new carto.Client({ apiKey: '{api_key}'  username: '{username}' });
The main component contains a layer and a histogram and its JSX will look similar to this:
<!-- WARNING: Only for learning purposes don't copy & paste -->
<main>
  <Map
      center={center}
    zoom={zoom}
    ref={node => { this.nativeMap = node && node.leafletElement } }>
    <Basemap
      attribution=""
      url={CARTO_BASEMAP} />
    <Layer
        source={airbnb.source}
        style={this.state.layerStyle}
        client={this.cartoClient}
        hidden={this.state.hidelayers}/>
  </Map>
  <Histogram
    client={this.cartoClient}
    source={airbnb.source}
    nativeMap={this.state.nativeMap}
    onDataChanged={this.onHistogramChanged.bind(this)}/>
</main>
The Map and the Basemap are created using components provided by the react-leaflet library{:target="_blank"} while the CARTO layer and the histogram are built ad-hoc for this project.
Notice the parameters passed to our custom components:
Layer
- source: string with a SQL query pointing to the geospatial data.
- style: a CartoCSS string with information about how the data should be displayed.
- Client: a carto.Client instance.
- Hidden: a boolean attribute controlling the layer´s visibility.
Histogram
- Client: a carto.Client instance.
- source: string with a SQL query pointing to the geospatial data.
- nativeMap: the leaflet-map element.
- onDataChanged: a callback function that will be executed when the dataview fetches new data.
Layer Component
A layer component receives the properties listed above.
In the component constructor{:target="_blank"} we use those properties to create the carto.source.SQL{:target="_blank"} and carto.style.CartoCSS{:target="_blank"} required in order to create a carto.layer.Layer{:target="_blank"}.
We finally add our brand new layer to the client.
constructor(props) {
    super(props);
   const { client  hidden  source  style } = props;
   const cartoSource = new carto.source.SQL(source);
   const cartoStyle = new carto.style.CartoCSS(style);
   this.layer = new carto.layer.Layer(cartoSource  cartoStyle);
   client.addLayer(this.layer);
 }
According to the React lifecycle{:target="_blank"} we must wait until the component has been mounted{:target="_blank"} before trying to add a leafletLayer to the leaflet map. Once the component has been mounted we know this.context will reference the native leaflet map so we can get a leaflet-layer from the client and add it to our map.
componentDidMount() {
 const { client } = this.props;
 client.getLeafletLayer().addTo(this.context.map);
}
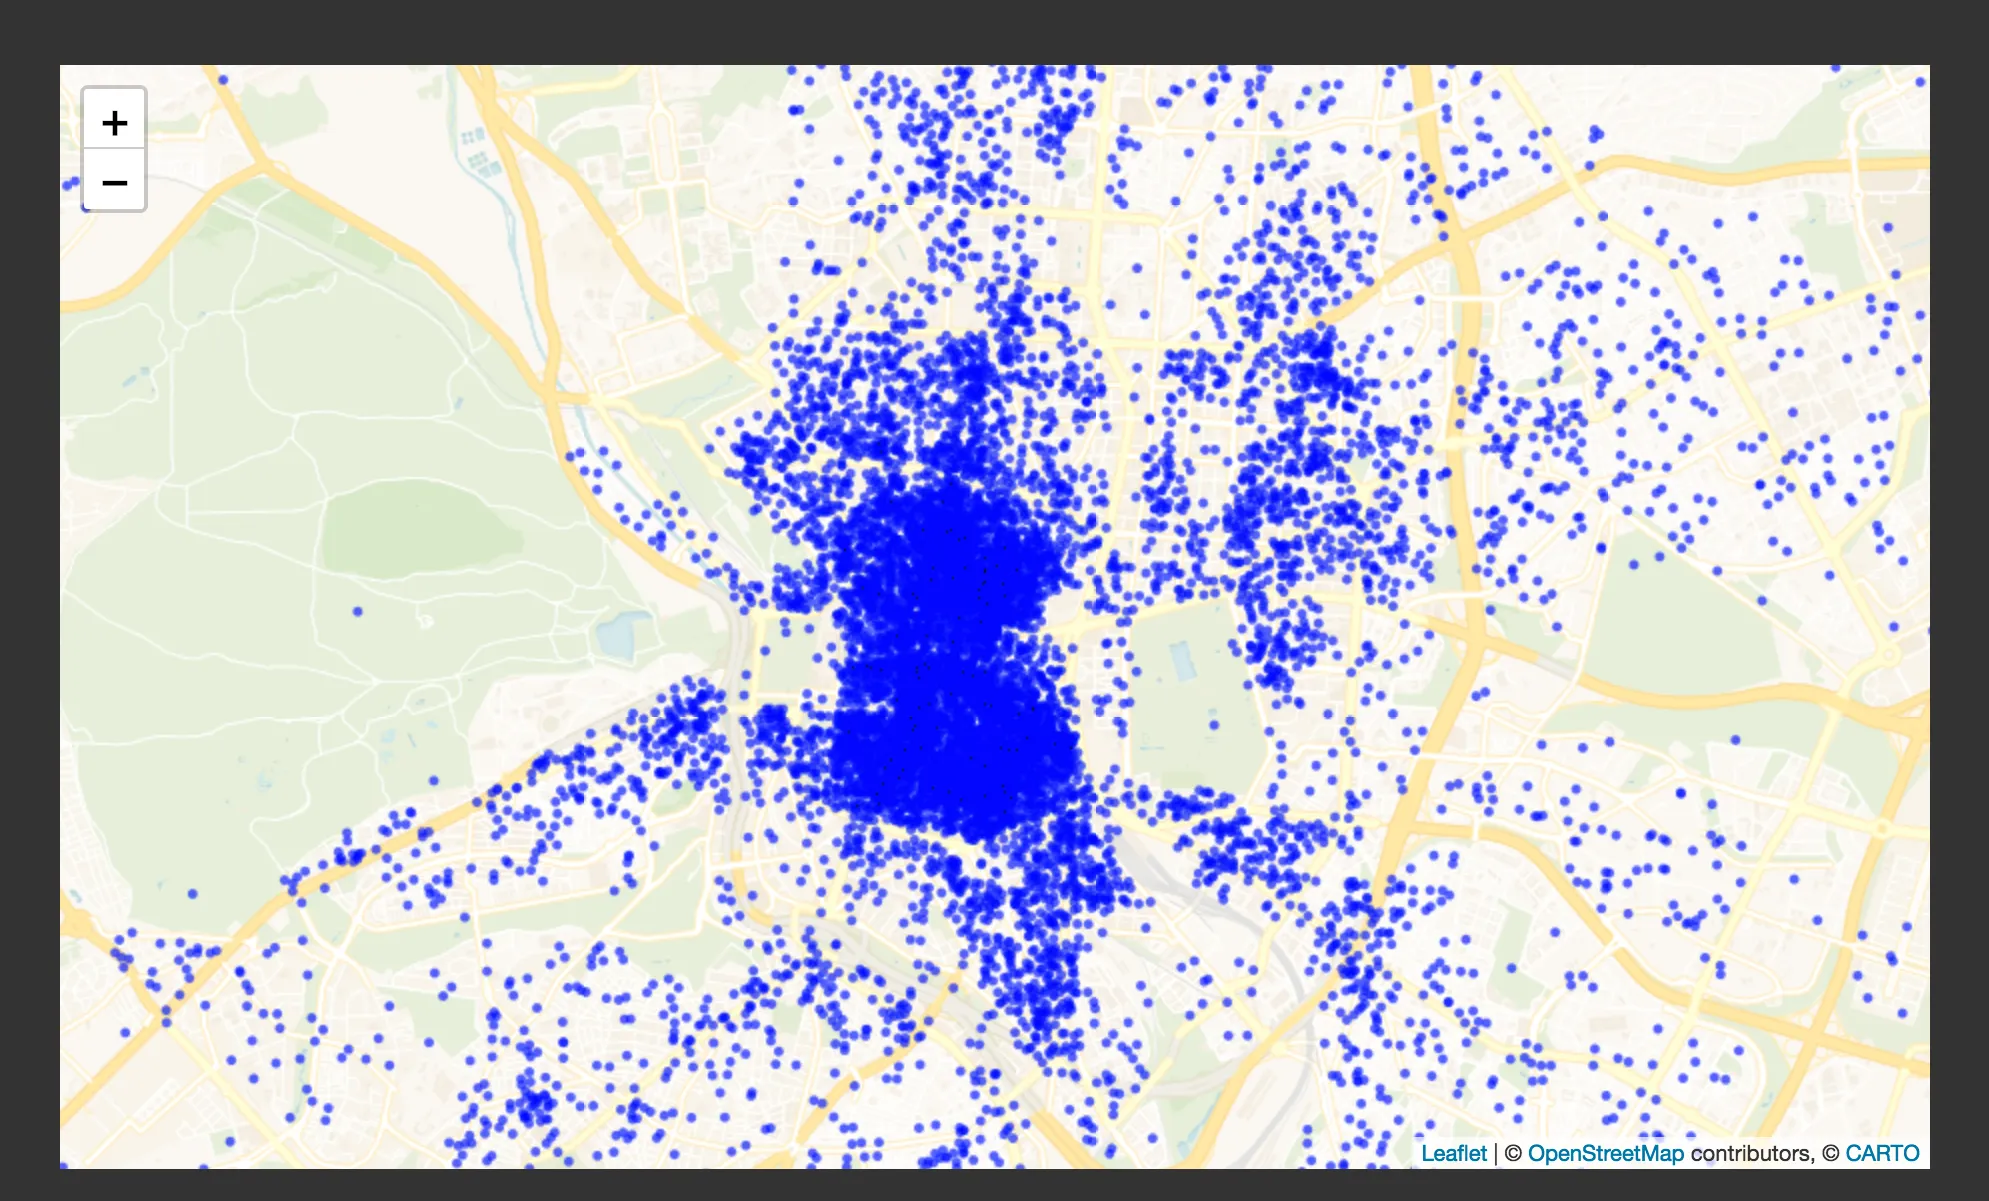
This allows us to view a map as the following:
Histogram Widget
We want to create a histogram displaying the price per night for the rentals in the map.
As you probably know we are going to create a React component wrapping a histogram dataview{:target="_blank"} so you can see how easy is to get geospatial data from the CARTO server.
As in the Layer component all the initialization is done in the constructor. To create the histogram we only need a carto.source.SQL{:target="_blank"} pointing to the rentals data the column name and the number of bins.
Since building the histogram requires server interaction all the process will be asynchronous and we need to register a function callback that will be executed when the data is available.
Finally remember to add the widget to the client. Otherwise nothing will happen!
constructor(props) {
   super(props);
     const { source  client } = props;
   // Create a cartoSource from the given source string
     const dataset = new carto.source.SQL(source)
   // Create a 7 bins histogram on the price column
   this.histogramDataview = new carto.dataview.Histogram(dataset  ‘price’  { bins: 7 });
   // Wait for the server to return data
     this.histogramDataview.on(‘dataChanged’  this.onDataChanged);
   // Register the dataview into the client
   client.addDataview(this.histogramDataview);
 }
The simplest onDataChanged callback could be one that just updates the React internal state:
onDataChanged = (data) => {
 this.setState(data);
}
This will cause render{:target="_blank"} to be called with the new state.
render() {
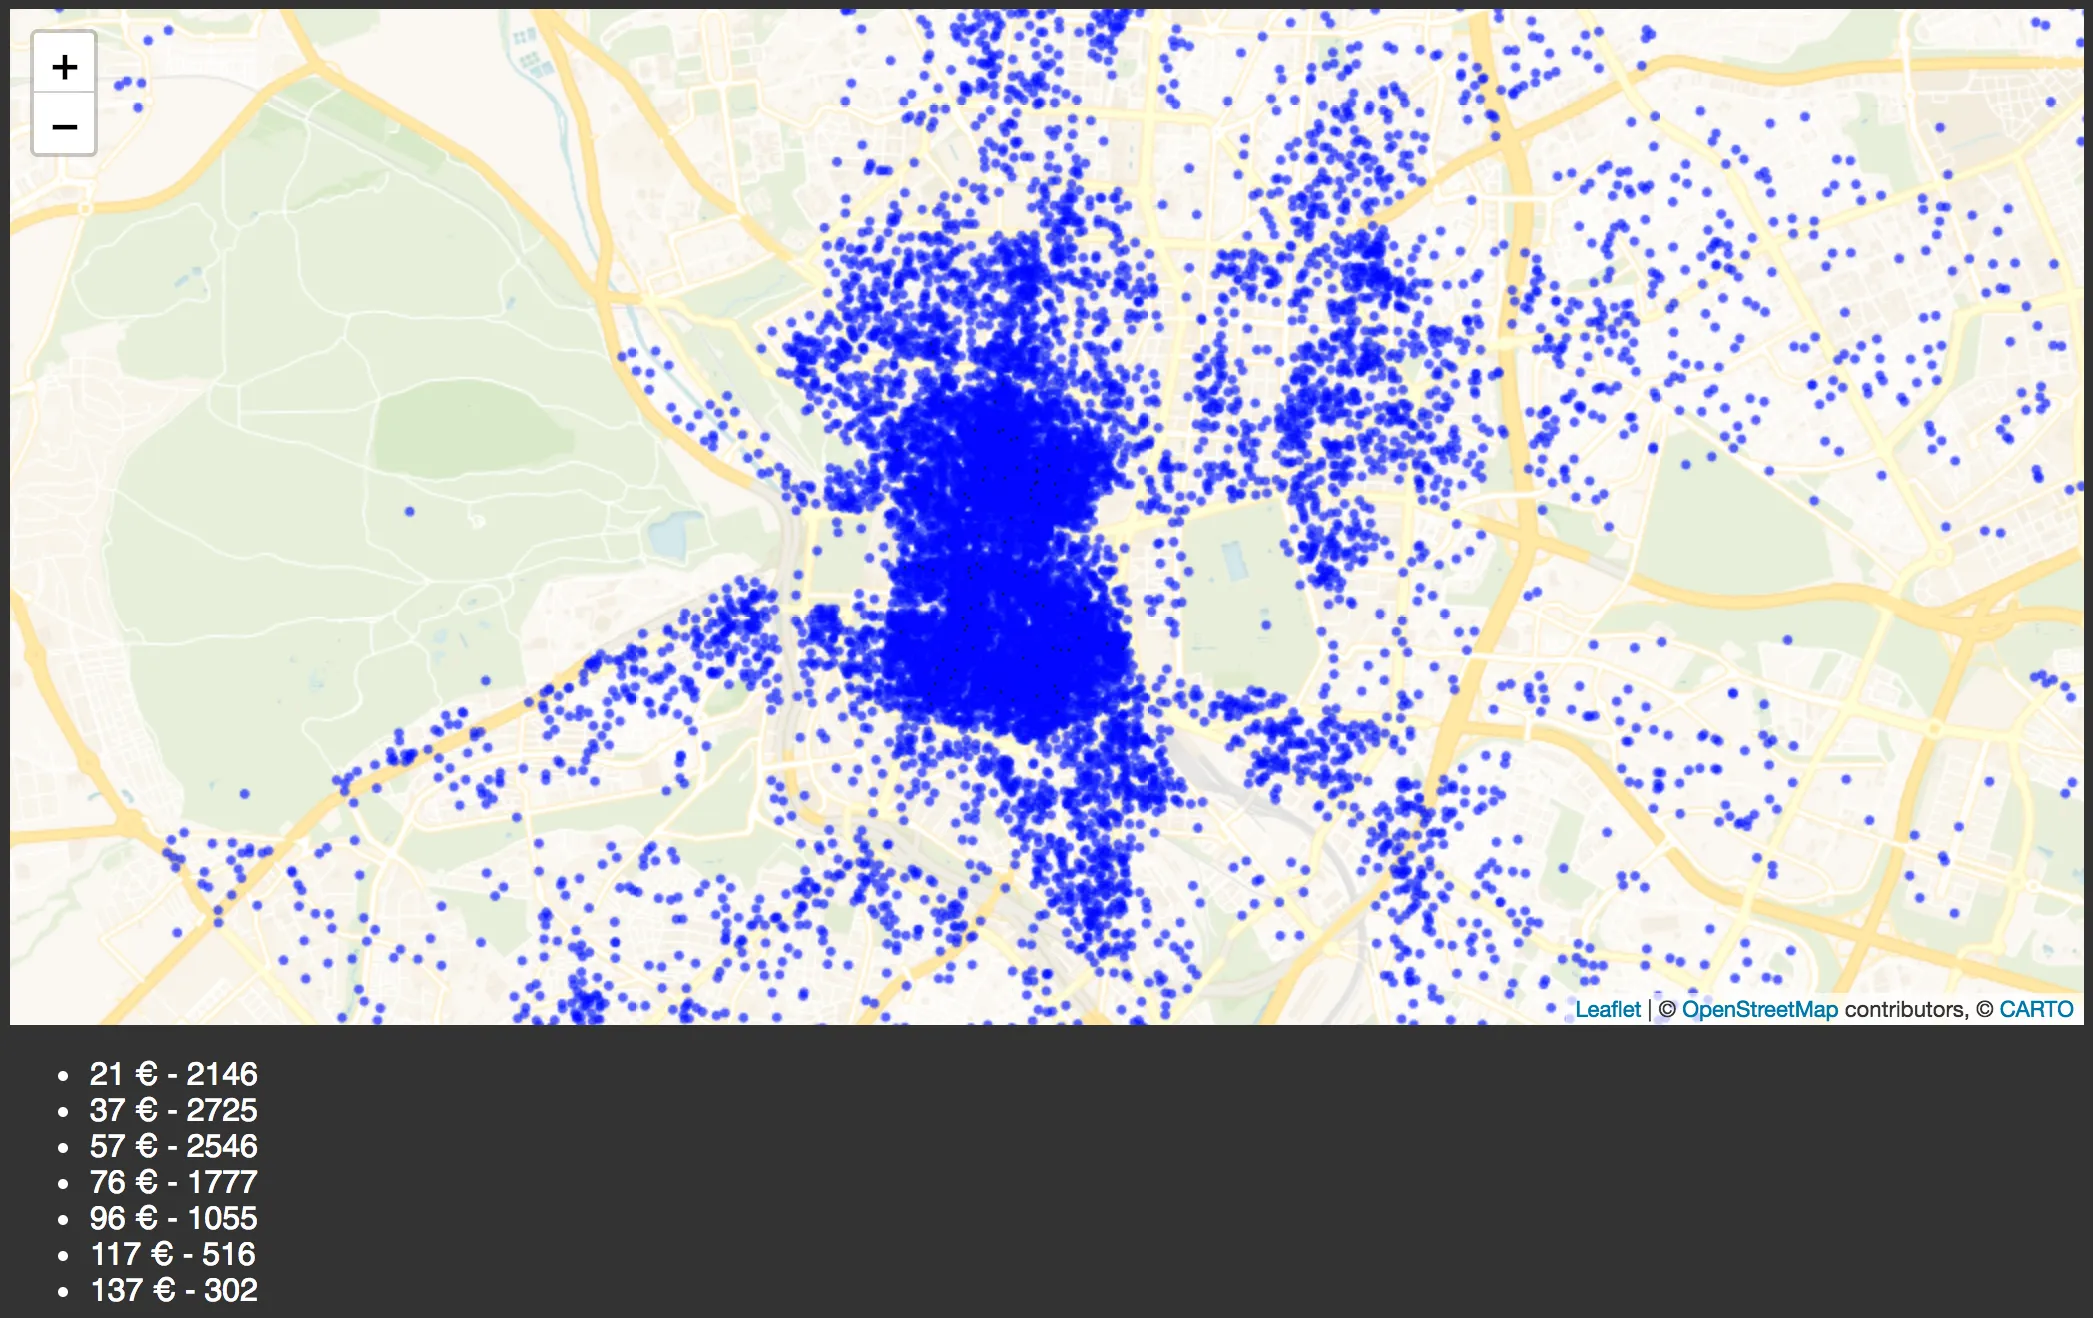
return <ul class=“post-list”> {this.state.bins.map(bin => <li> {bin.avg} € - {bin.freq} </li>)} </ul>;
}
A simple render function like this will show a unordered list with the average price for every bin{:target="_blank"} and how many rentals are in this bin.
With some CSS & HTML we can improve this visualization even more:
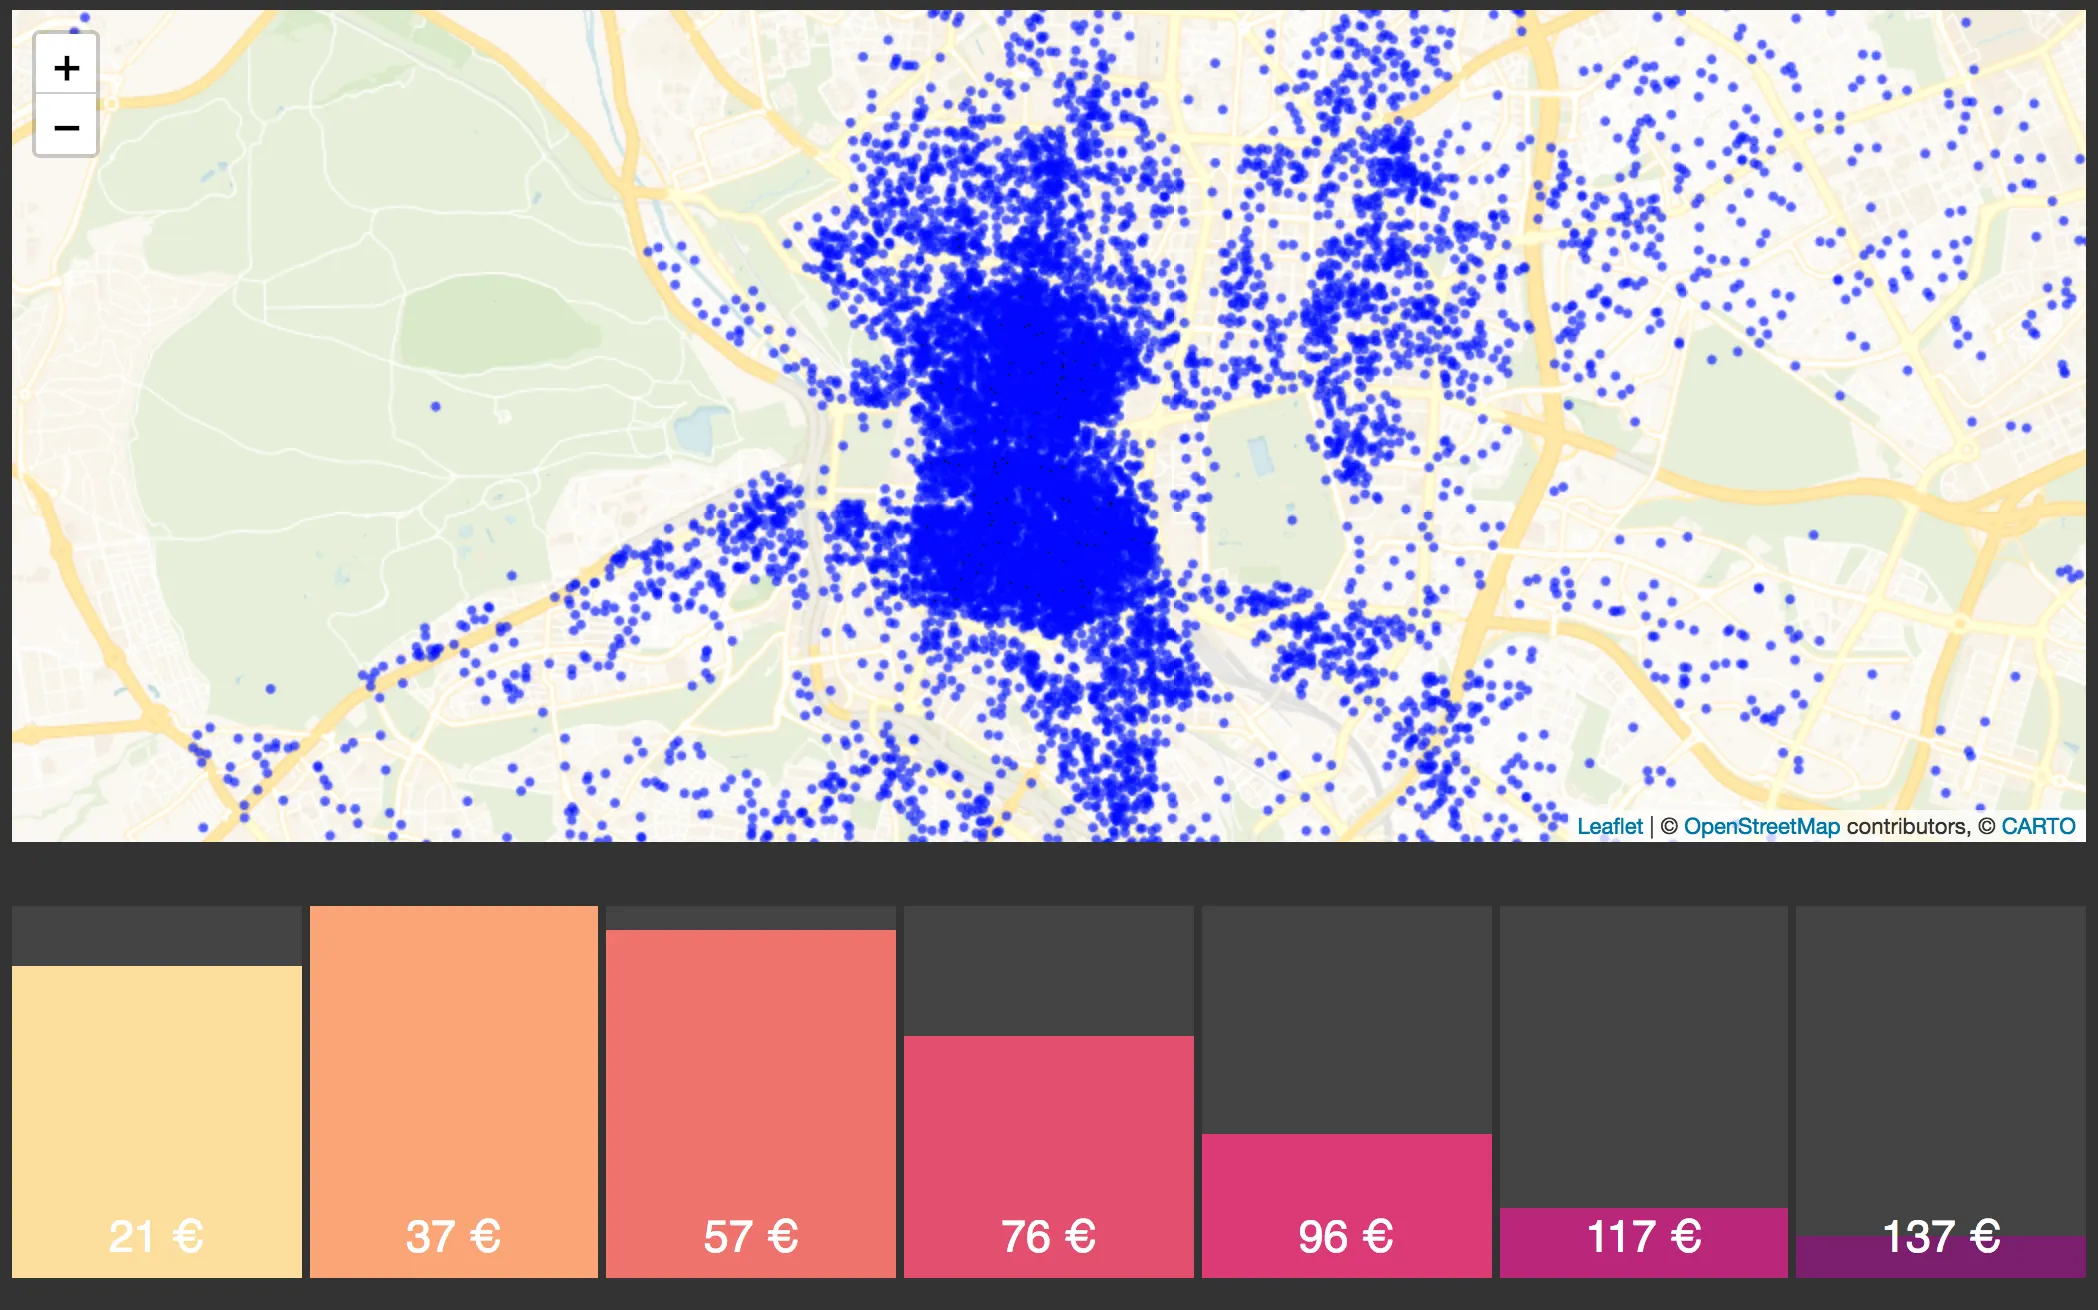
Once we get this… Won’t it be great to have a different color in the layer points according to its histogram bin?
Updating layer style
Once we get the histogram data we want to update the layer and apply new styles to create a greater visualization. The first step will be updating our callback and notify the parent element about the new data arrival.
// Histogram.js
onDataChanged = (data) => {
 this.setState(data);
 // Call callback function with the new data
 this.props.onDataChanged(data);
}
On the parent element (index.js) we will process this data generating a new style that should be applied to the layer.
// index.js
onHistogramChanged(data) {
 const newStyle = utils.buildStyle(data);
 this.setState({ layerStyle: newStyle  hidelayers: false })
}
To generate the style we use a utility function that generates a CartoCSS from histogram data{:target="_blank"}
export const COLORS = [’#fcde9c’  ‘#faa476’  ‘#f0746e’  ‘#e34f6f’  ‘#dc3977’  ‘#b9257a’  ‘#7c1d6f’];
export function buildStyle(data) {
   const rules = data.bins.map((bin  index) => _createRule(bin  COLORS[index])).join(’’);
   return         #layer {            marker-width: 10;            marker-fill-opacity: 0.7;            marker-allow-overlap: false;            marker-line-width: 0;            marker-comp-op: multiply;            ${rules}        }    ;
}
function _createRule(bin  color) {
   return             [price >= ${bin.start}] {                marker-fill: ${color};            }        ;
}
export default { buildStyle  COLORS };
We won’t explain this in detail since is not very relevant but the core concept here is that buildStyle transforms histogram data{:target="_blank"} into a CartoCSS{:target="_blank"} like the following:
#layer {
   marker-width: 10;
   marker-fill-opacity: 0.7;
   marker-allow-overlap: false;
   marker-line-width: 0;
   marker-comp-op: multiply;
   if (price >= 0 ) {
     marker-fill: green;
   }
   if (price > 50) {
     marker-fill: orange;
   }
   if (price > 100) {
     marker-fill: red;
   }
}
This new CartoCSS is asigned to the layerStyle variable in the main app component state triggering a new render .
This style is passed to the layer as a property.
<Layer
 source={airbnb.source}
 style={this.state.layerStyle} // <—-
 client={this.cartoClient}
 hidden={this.state.hidelayers}
/>
So the layer must be aware of this changes. This is done using the shouldComponentUpdate{:target="_blank"} function checking if the style has changed.
shouldComponentUpdate(nextProps) {
   return nextProps.style !== this.props.style;
}
So in our render function we only need to update the layer style with the new CartoCSS pased as a property. We can simply use the .setContent{:target="_blank"} function to achieve this.
render() {
   const { style } = this.props;
   const layerStyle = this.layer.getStyle();
   layerStyle.setContent(style);
   return null;
 }
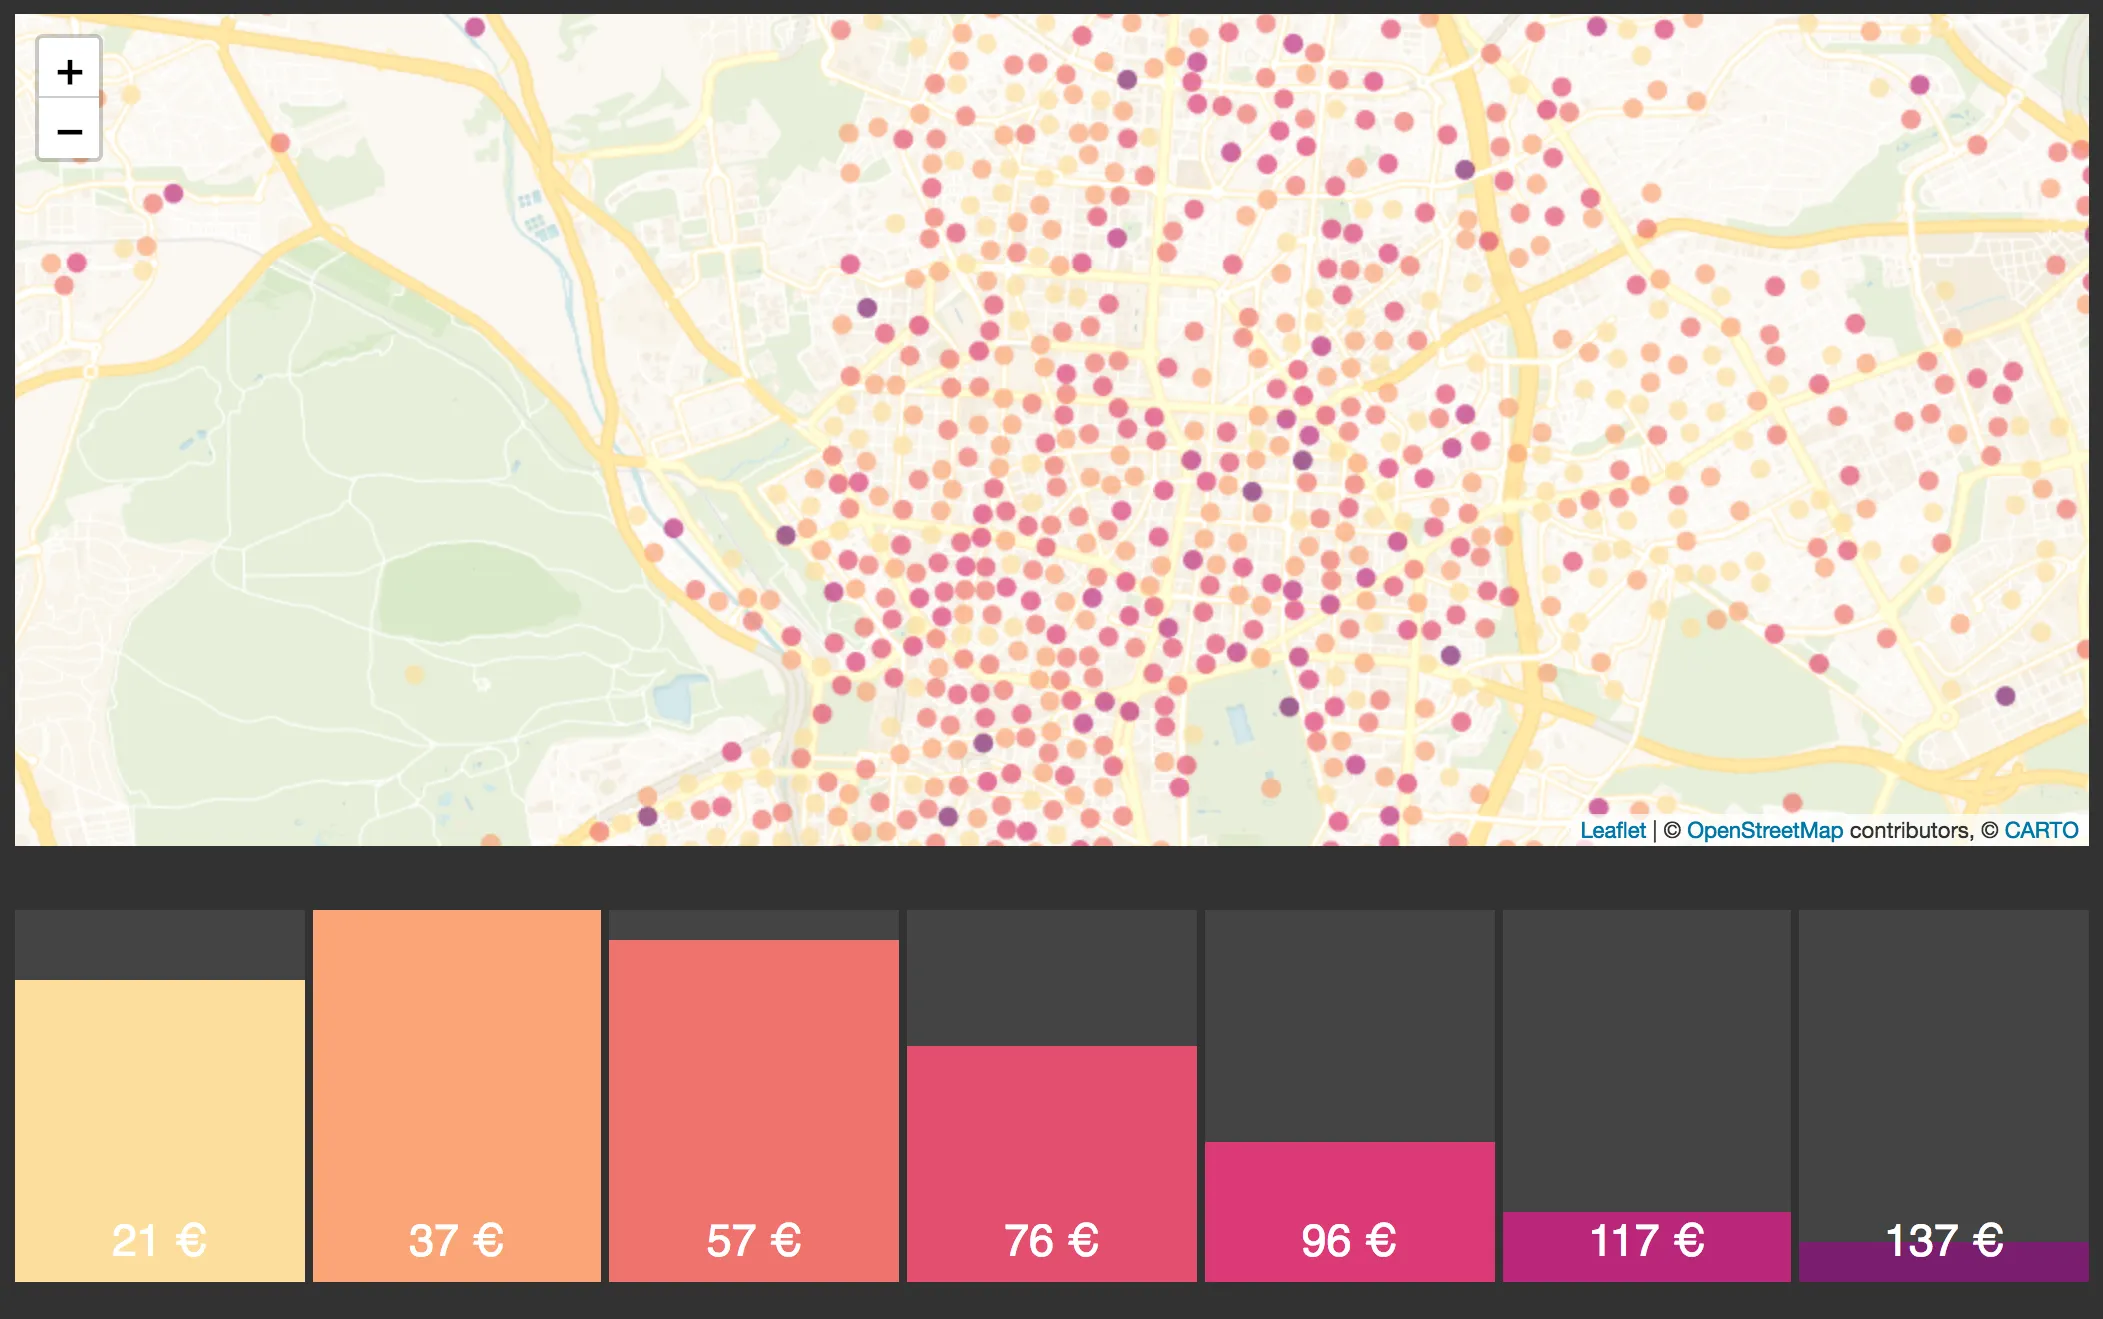
Since our client connects everything the map will be updated on its own:
Listening to map position
As a final step we want our histogram to reflect the exact data we are seeing in the map.
In order to achieve this we need to filter our dataview to consider only data belonging to our current map area.
Luckily for us CARTO.js provides this exact functionality through what is known as filters{:target="_blank"}. For this case we want to use a cartoFilterBoundingBox{:target="_blank"} in the Histogram constructor just adding 2 lines: one for creating the filter and another one to add the filter to the widget.
constructor(props) {
   super(props);
   const dataset = new carto.source.SQL(props.source)
   this.histogramDataview = new carto.dataview.Histogram(dataset  ‘price’  { bins: 7 });
   // Create a bboxFilter attached to the native leaflet map
   const bboxFilter = new carto.filter.BoundingBoxLeaflet(props.nativeMap);
   // Add the filter to the histogram
   this.histogramDataview.addFilter(bboxFilter);
   this.histogramDataview.on(‘dataChanged’  this.onDataChanged);
   props.client.addDataview(this.histogramDataview);
 }
And that’s all! Now when we change the map position the histogram widget will fire a dataChanged event with new data belonging to the visible portion of the map.
##IMAGE_SIZE_LIMT## https://carto.com/media-content/blog/img/posts/2018/2018-01-12-cartojs-and-react/final.gif##_IMAGE_SIZE_LIMT_##


