Acquiring New Customers with Geomarketing for Online Retailers


Before the COVID-19 pandemic expected spend on online retail sales was expected to surpass $6.5tn by 2023. It remains to be seen whether the spike in online retail sales as a result of lockdown measures around the world will translate into higher longer term numbers (indeed China is already returning to normal levels) but regardless online retailers particularly smaller ones are in need of effective geomarketing tools to find new customers.
Based in Montreal the developers and consultants at Anagraph specialize in building out custom geospatial solutions for their clients. Anagraph has a team of designers developers and GIS experts with years of experience working with large North-American organizations.
Many of Anagraph’s fellow entrepreneurs work specifically in online B2C selling their products via online marketplaces directly to consumers all across North America.
Geometric a Geomarketing Solution for Online Retailers
Launched this past January the Geometric application serves as a SaaS platform for online retailers looking for a more comprehensive geomarketing strategy - targeting key audiences and buyer personas and boosting sales. One of the key features of this application is its Shopify connector.
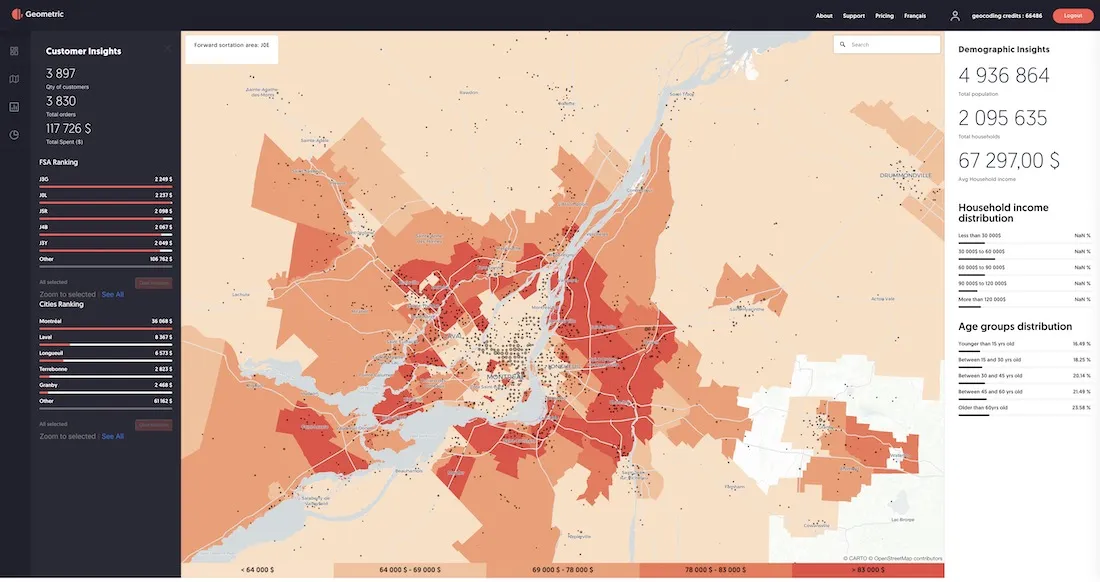
For users who do not operate through Shopify the Geometric solution also allows for direct import of customer data via CSV. While this wouldn’t update in real time with new data as the Shopify connector allows for it would still provide that same demographic matching generating a new layer of geomarketing insight.
Using the complete set of CARTO developer tools Anagraph was able to go from conception to completed product faster than ever.
The CARTO ecosystem has allowed us to accelerate the development of customized solutions and meet enterprise client needs in record time.
Nicolas Delffon CEO Anagraph
Using Demographic Data to Identify COVID-19 Risk
During the COVID-19 pandemic Anagraph have also been producing maps and dashboards in an effort to aid the emergency response in their home country of Canada.
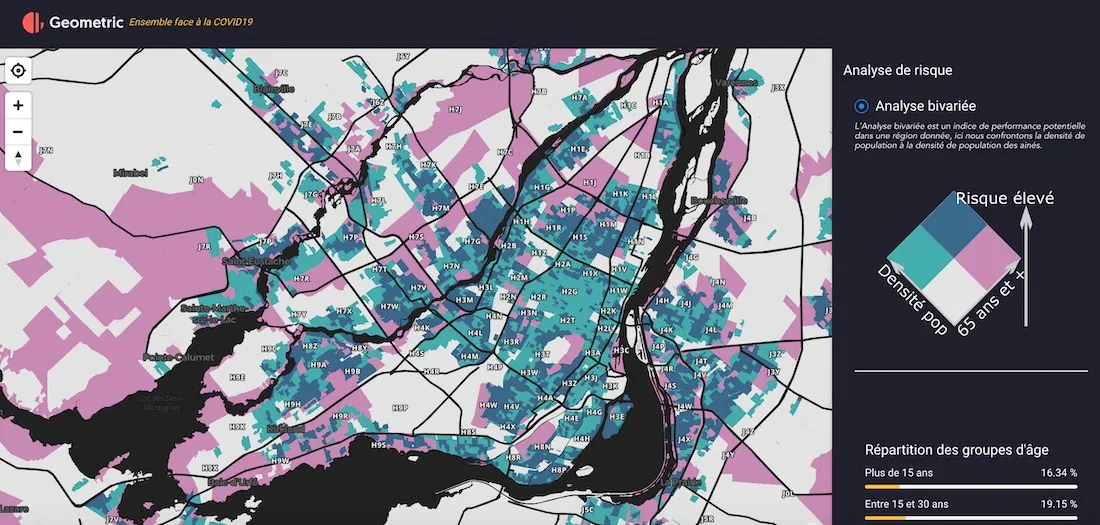
The first dashboard that Anagraph produced uses bivariate analysis to determine which areas would be at a higher risk. This risk analysis used demographic data to correlate overall population density with that of the elderly population. Below shows a screenshot for the city of Montreal with the areas in dark blue representing both a higher densities of population and elderly people. With social distancing policies remaining in place for some time to come this can help to ensure those at a higher risk of complications from COVID-19 can be kept safe. The dashboard can be explored here.
Material and Social Deprivation Index
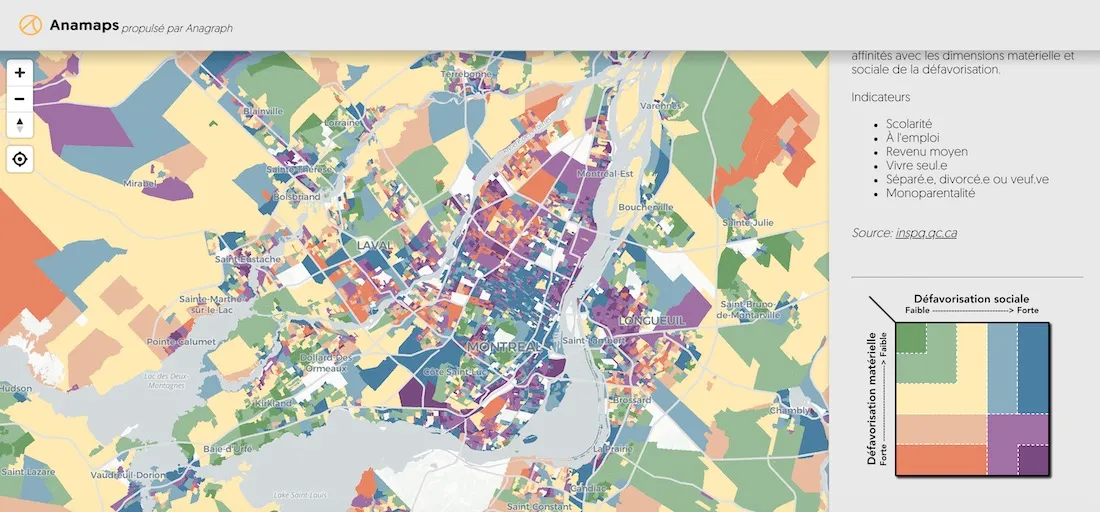
With rising unemployment rates caused by the economic impact of COVID-19 local support and governmental groups have a need to know where to focus their support efforts. The second interactive dashboard visualizes a deprivation index obtained from six indicators selected according to their relationships with health and their affinities with the material and social dimensions of deprivation:
- Education Level
- Employment Status
- Average Income
- Living Alone
- Separated Divorced or Widowed
- Single Parent Household
The screenshot below again shows Montreal and the full dashboard can be viewed here.
Want to know more about Anagraph & Geometric?