Changing Neighborhoods: The case of New York City


Citizen-led organizations are working in cities across the world to better understand the intricacies of housing markets, housing policy, tenant rights, as well as the socioeconomic and demographic evolution of neighborhoods. Geospatial technology and Location Intelligence have become fundamental tools for analysis, communication, storytelling, monitoring and evaluation. CARTO’s Grants For Good Program connects academics and organizations to the technology they need to create impactful projects. In a three part series we will highlight influential civic mapping projects in New York City, San Francisco, and Chicago.
New York City
Rising rents, gentrification, crime reduction and immigration trends are changing the demographic makeup of neighborhoods across New York City. The Citizens Housing and Planning Council (CHPCNYC) is a non profit organization and a community of people that share ideas and shape practical solutions to help NYC government and the housing industry ensure residents’ housing needs are met. CHPC’s mission, since 1937, is to develop and advance practical public policies to support the housing stock of the city by better understanding New York’s most pressing housing and neighborhood needs.
Much of CHPC’s recent work focuses on aggregating and segmenting demographic data that demonstrates the demographic and socioeconomic shifts taking place in neighborhoods over a ten year period. CHPC released an extensive report Making Neighborhoods, as well as an insightful interactive map allowing users to explore the rich temporal, qualitative, and geographic data. Explore the map for yourself to see how neighborhoods in NYC have changed over a ten year period!
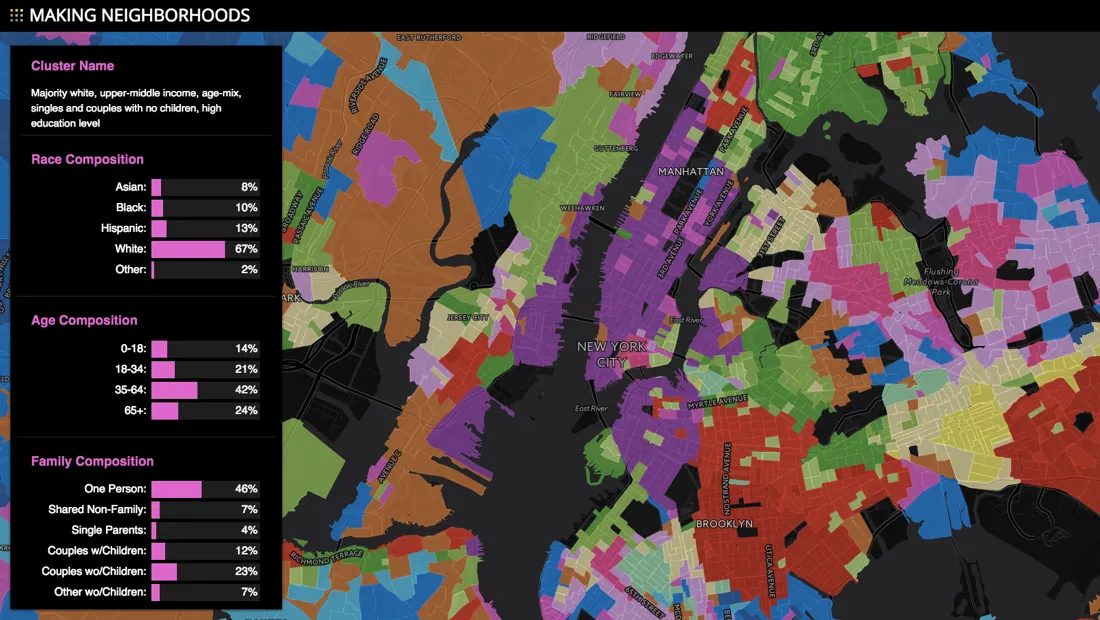
The study used ‘cluster analysis ’ as a way of parsing large amounts of data into groups with shared traits. Populations clusters were identified in 2000 and tracked again in 2010. Dillon Massey, Housing Informatics Designer, played a leading role in the project and managed the entire data visualization and mapping.
“Using 16 demographic variables to measure race, age, foreign birth, household type, education level, and poverty, the model formed 14 ‘clusters’ of census tracts where populations share these characteristics.”
Citizen-led initiatives are complemented by innovative approaches by the public sector for better citizen centric and participatory governance. The New York City Mayor’s Office is doing just that with new real-time data dashboard powered by CARTO. The dashboard shows indicators including up-to-date crime statistics service provision performance health figures infrastructure project updates public works 311 data environmental indicators housing and homelessness statistics.
Request a live demo and see the power of location intelligence.
It is crucial to fully comprehend how a city is performing, how neighborhoods are changing and who is being affected by policy. This understanding is achieved by analyzing, monitoring and evaluating the constantly shifting social, economic and political tides of a city.
Stay tuned for the next piece in this series which shares the work Anti-Eviction Mapping Project is doing in civic mapping and housing rights advocacy in San Francisco.
Happy Data Mapping