

Why Lockdown Matters: Exploring Human Mobility Data in Italy


The new SARS-CoV-2 coronavirus which emerged in the Chinese city of Wuhan in late 2019 continues to cross borders. The epidemic one of the biggest health crises in recent years whose consequences are still unpredictable has spread to more than 160 countries with almost 500 000 confirmed cases and over 22 000 deaths (as of 26th March). The scale of this epidemic is one of the largest challenges faced by our interconnected society in recent times.
The Spread of COVID-19 in Italy
Italy has been one of the most heavily affected countries in the world and the reported cases have grown exponentially since the first cases were detected in Codogno Lombardy. We can see this clearly on the plots below using data from the Italian Dipartimento della Protezione Civile.
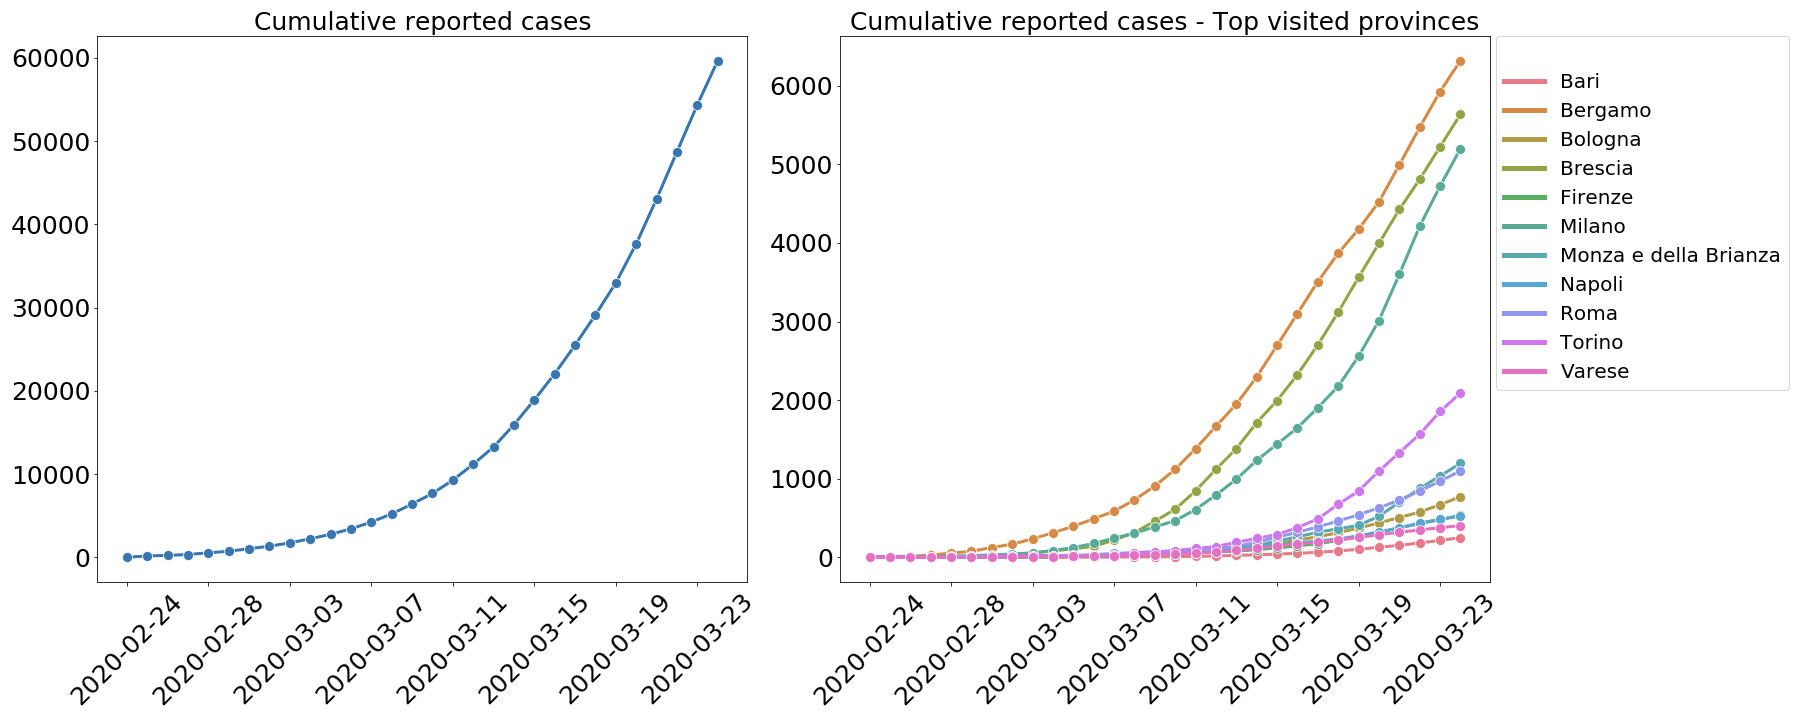
While little is still known about this virus it is clear that the lockdown policies as implemented in China where new cases have dropped to zero for five consecutive days from March 19 slow the spread and avoid the collapse of the health system.
Lockdown policies work because they limit human mobility which has been recognized as the most important virus ally given the long incubation time (median incubation time is estimated to be around 5 days) and the potentially large (but still very uncertain) proportion of asymptomatic cases. How can governments face this huge challenge? The first step taken by Italy and subsequently by other countries has been to reduce the mobility of a large percentage of the population.
Analysing with Human Mobility Data
In this post we have used human mobility data from our partner Unacast to analyse the relationship between the reported cases and the travelled distance during the first weeks of the outbreak in Italy.
Looking at the data we can see that the average distance travelled by province started decreasing on February 23. This correlates to when the first restrictive measures were implemented in all the municipalities where local outbreaks were observed including the closure of schools public events suspended in Lombardy and Veneto and remote working recommended.
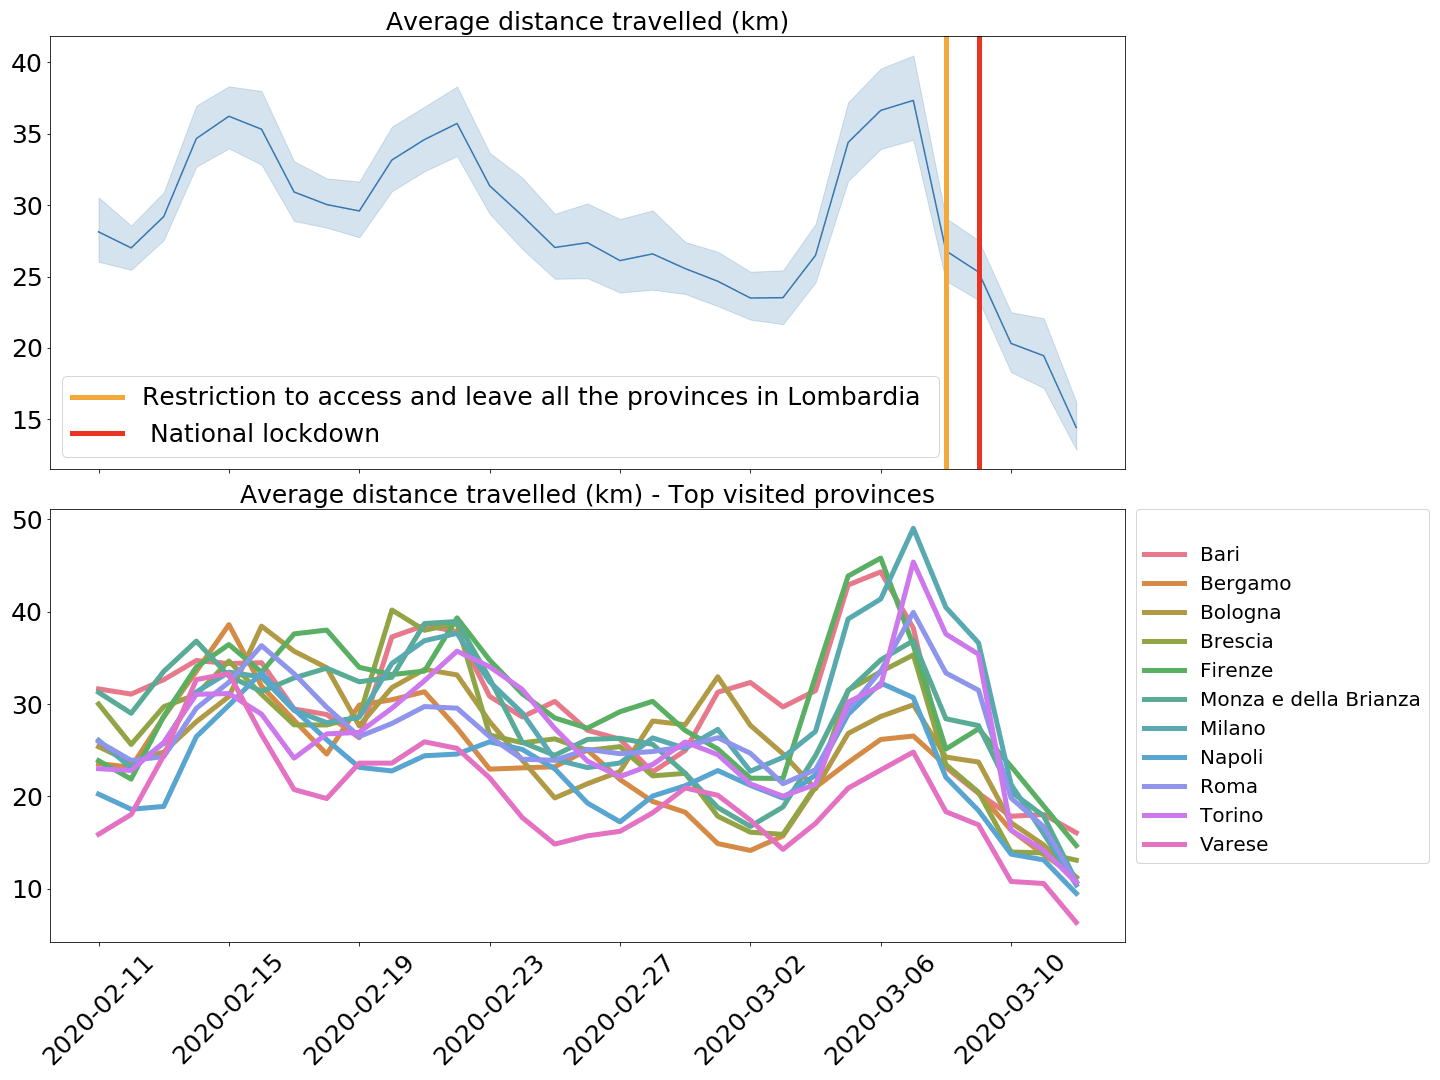
Similarly we can see an increase in the average distance travelled just before the lockdown which was expected but only officially declared on March 8th and then a sharp decrease as the restrictions took place.
Analysing how groups of people move during an epidemic is crucial not only as a monitoring tool for governments to review the effectiveness of lockdown policies but also to study the relationship between human mobility and the spread of the virus.
Using a Spatio-Temporal Model
Next using the average travelled distance by province $i$ and day of the year $t$ $d_{it}$ provided by Unacast and the reported cases $O_{it}$ per province we can fit a Bayesian spatio-temporal model to characterize their relationship.
Implementing such a model requires a few assumptions. First we will assume that this relationship is not instantaneous because of the incubation time and the delay in taking the test. Since the median reporting delay was estimated as 12 days in China by the WHO at the onset of the outbreak the number of reported cases at day $t$ will be associated with the 12-days lagged average travelled distance. Moreover since our aim here is to estimate the relationship between the lagged mobility and the reported cases rather than make predictions we will focus on the period up to February 19th (February 7th for the lagged mobility data just before the full lockdown).
Additionally we need to account for important demographic confounders: given the limited testing implemented by the Italian government it is likely that there is age-dependent bias in the reported cases. In fact testing is mainly limited to people with mid-to-severe symptoms which have higher incidence in certain age stata. To estimate the number of expected cases $E_i$ by province we assumed the same incidence by age stratum $f_j$ as that reported in China
$$E_i = \sum_j \; f_j \ p_{ij}$$
where $p_{ij}$ is the population for province $i$ and age stratum $j$ available from the Italian Istituto Nazionale di Statistica.The observed counts $O_{it}$ were assumed to be conditionally independent (zero-inflated) Poisson variables with mean $E_i \ exp(\eta_{it})$ and the log relative risk was modelled using a Besag York and Mollie (BYM) model for the spatial component and a non-parametric trend for the temporal dependence
$$\eta_{it} = \mu + f(d_{i\ t-12} \beta) + u_i + v_i + \gamma_t + \phi_t$$
where
- $\mu%0$ is the overall intercept
- $f%0$ is a smooth function measuring any possibly non-linear effect of the area-specific lagged mobility covariate implemented assuming a random walk of order 2 prior on the coefficients
- $v%0$ is a zero mean Gaussian representing an unstructured random effect (IID term for area $i$) while $u$ is a spatial component saying that nearby regions are similar and is given by a first-order intrinsic Gaussian Markov random field model (Rue and Held 2005 Chapter 3). Here following Simpson et al. (2017) we used a different parameterization of the BYM model which makes parameters interpretable and facilitates the assignment of meaningful Penalized Complexity (PC) priors
- $\gamma_t$ represents the temporally smooth structured effect defined by a random walk of order 2 prior and $\phi_t$ an IID term for day of the year $t$
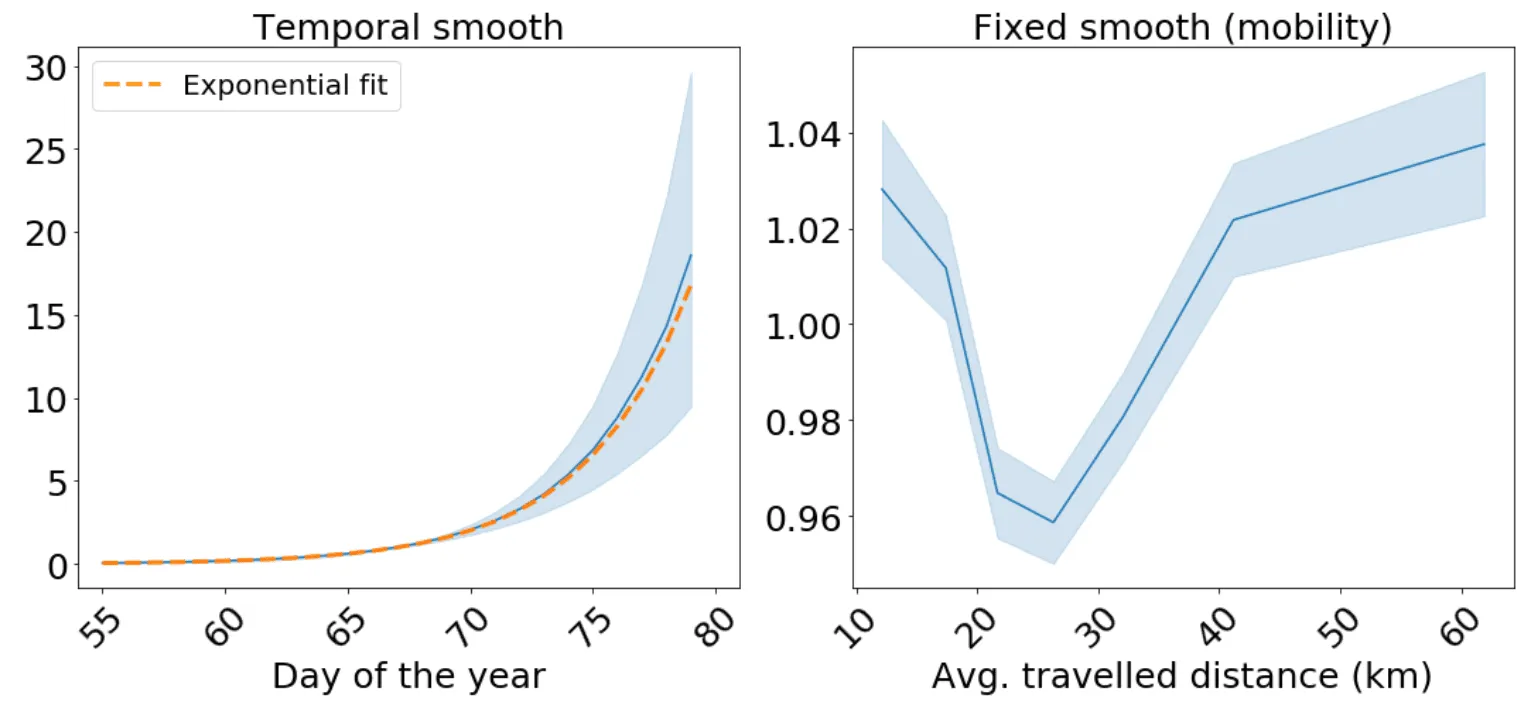
If we look at the dependence on time of the temporal smooth we can see an exponential-like dependence confirmed by fitting an exponential relationship to the smooth mean. On the other hand if we look at the mobility smooth we can see that for average travelled distances above 25 km there is a positive correlation between the travelled distance and the risk.
Finally we can plot an animated map for the estimated risk
Key Findings
Using the latest mobility data we have shown how human mobility might affect the spread of an infectious disease such as the new SARS-CoV-2. While the goal of this preliminary analysis is not to forecast the future number of cases it shows that human mobility is linked to the spread of the disease and that recent mobility patterns should be included in any epidemiological model used for predicting the evolution of the epidemic.
Are you responding to or analysing the impact of COVID-19? CARTO is here to help
We are fully committed to supporting our society and overcoming this crisis with our technologies and services. We have put together a dedicated team of spatial data scientists and engineers ready to collaborate with public and private sector organizations fighting against the coronavirus outbreak. Location Intelligence is playing an important role not only in understanding how COVID-19 is spreading across our territories and society groups but also in defining and executing response campaigns to better manage the health infrastructure ensure faster response to protect our most vulnerable citizens and improve how social distancing policies are being enforced and followed.
We are also actively collaborating with local and national administrations to develop web and mobile applications for self-diagnosis and data collection in order to relieve pressure on the already saturated emergency communication methods and give clear recommendations for action.
Finally we are making its platform available to public and private sector organizations investigating the coronavirus outbreak via our grants program.
In need of support to apply Spatial Analysis and Spatial Data Science in the fight against COVID-19?


