

Location Analytics: A Roadmap to Post COVID-19


Over the past few months we’ve seen thousands of applications of location technology across the globe with maps popping up on almost every news broadcast we see both at a global and local level. Citizens may not have realized it but spatial analysis has become a daily conversation on WhatsApp groups and Zoom calls with families and friends discussing how location might affect their probability of catching coronavirus. Everybody has asked themselves questions with location in mind: Should I work from home? Should I (against government recommendations) spend lockdown in another location? Which supermarket is lower risk to get supplies?
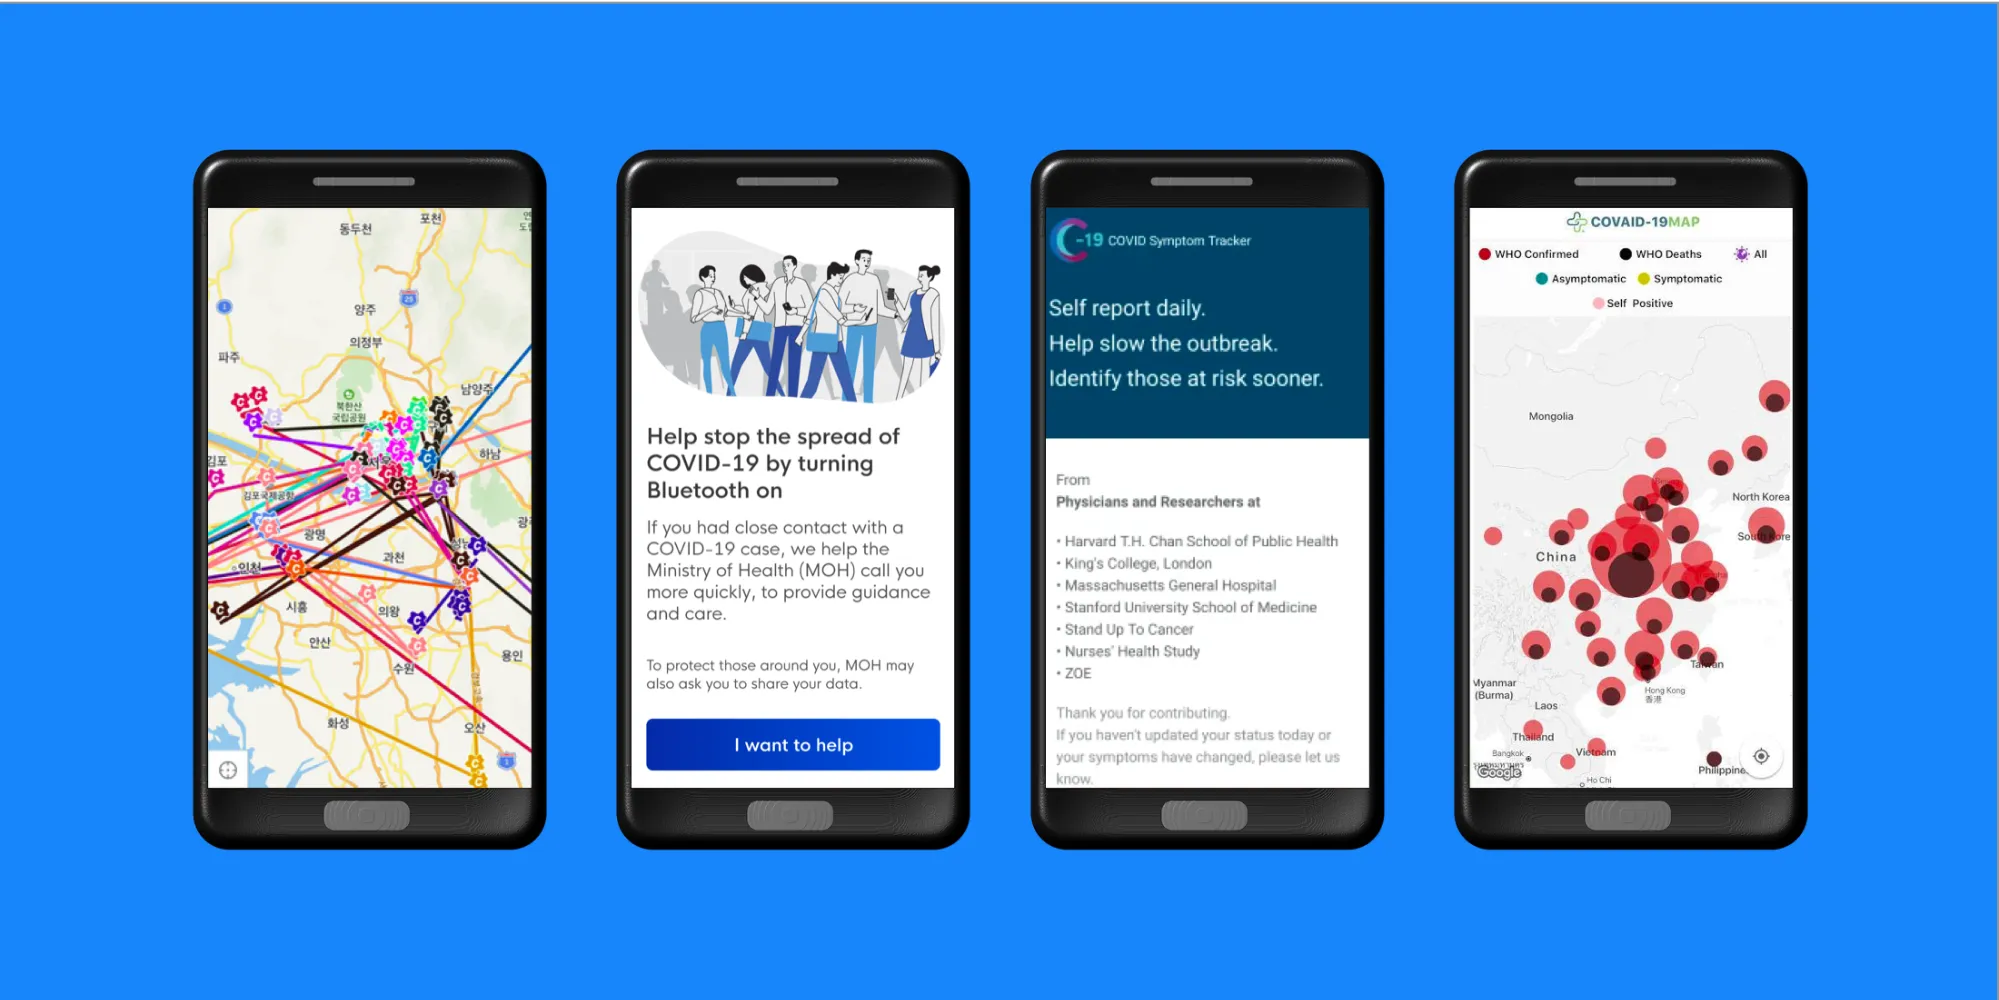
Governments have also been asking spatial questions throughout the outbreak. Singapore launched TraceTogether using cell phone location and proximity data to detect possible exposure events Madrid deployed Coronamadrid to diagnose symptoms through mobile devices and South Korea’s Corona 100m publicly informing citizens of known cases within 100 metres of where they are.
Different regions have responded differently to such measures from a privacy perspective. In fact noyb a European privacy not-for-profit has been keeping an updated list of approaches by private sector and governments to see how apps approach personal data use for contacts tracing lockdown or quarantine enforcement and COVID-19 self-assessment.
However the reality is that we’re really only in Phase 1 of our journey to overcome this pandemic. If you read the American Enterprise Institute’s (AEI) report entitled “National coronavirus response: A road map to reopening" they talk about 4 phases:
- Phase I: Slow the Spread
- Phase II: Reopen State by State
- Phase III: Establish Protection Then Lift All Restrictions
- Phase IV: Rebuild Readiness for the Next Pandemic
To move from one phase to another we need a set of actions and achievements to be seen as societal indicators - and so many of them can be triggered by the effective use of geospatial technologies. Geography might not have been the sexiest profession in the past few years but in a space of 3 months it has just become one of the most important - especially for those professionals who have a mix of Geography and Data Science expertise - otherwise known as Spatial Data Science.
Geography might not have been the sexiest profession in the past few years but in a space of 3 months it has just become one of the most important - especially for those professionals who have a mix of Geography and Data Science expertise - otherwise known as Spatial Data Science.
Javier de la Torre Founder & Chief Strategy Officer CARTO
In this series of blog posts we’ll explore how location analytics can help during each phase with real use cases that we’re seeing in the field using the AEI report to guide us.
Recommendation 1: Maintain Physical Distancing
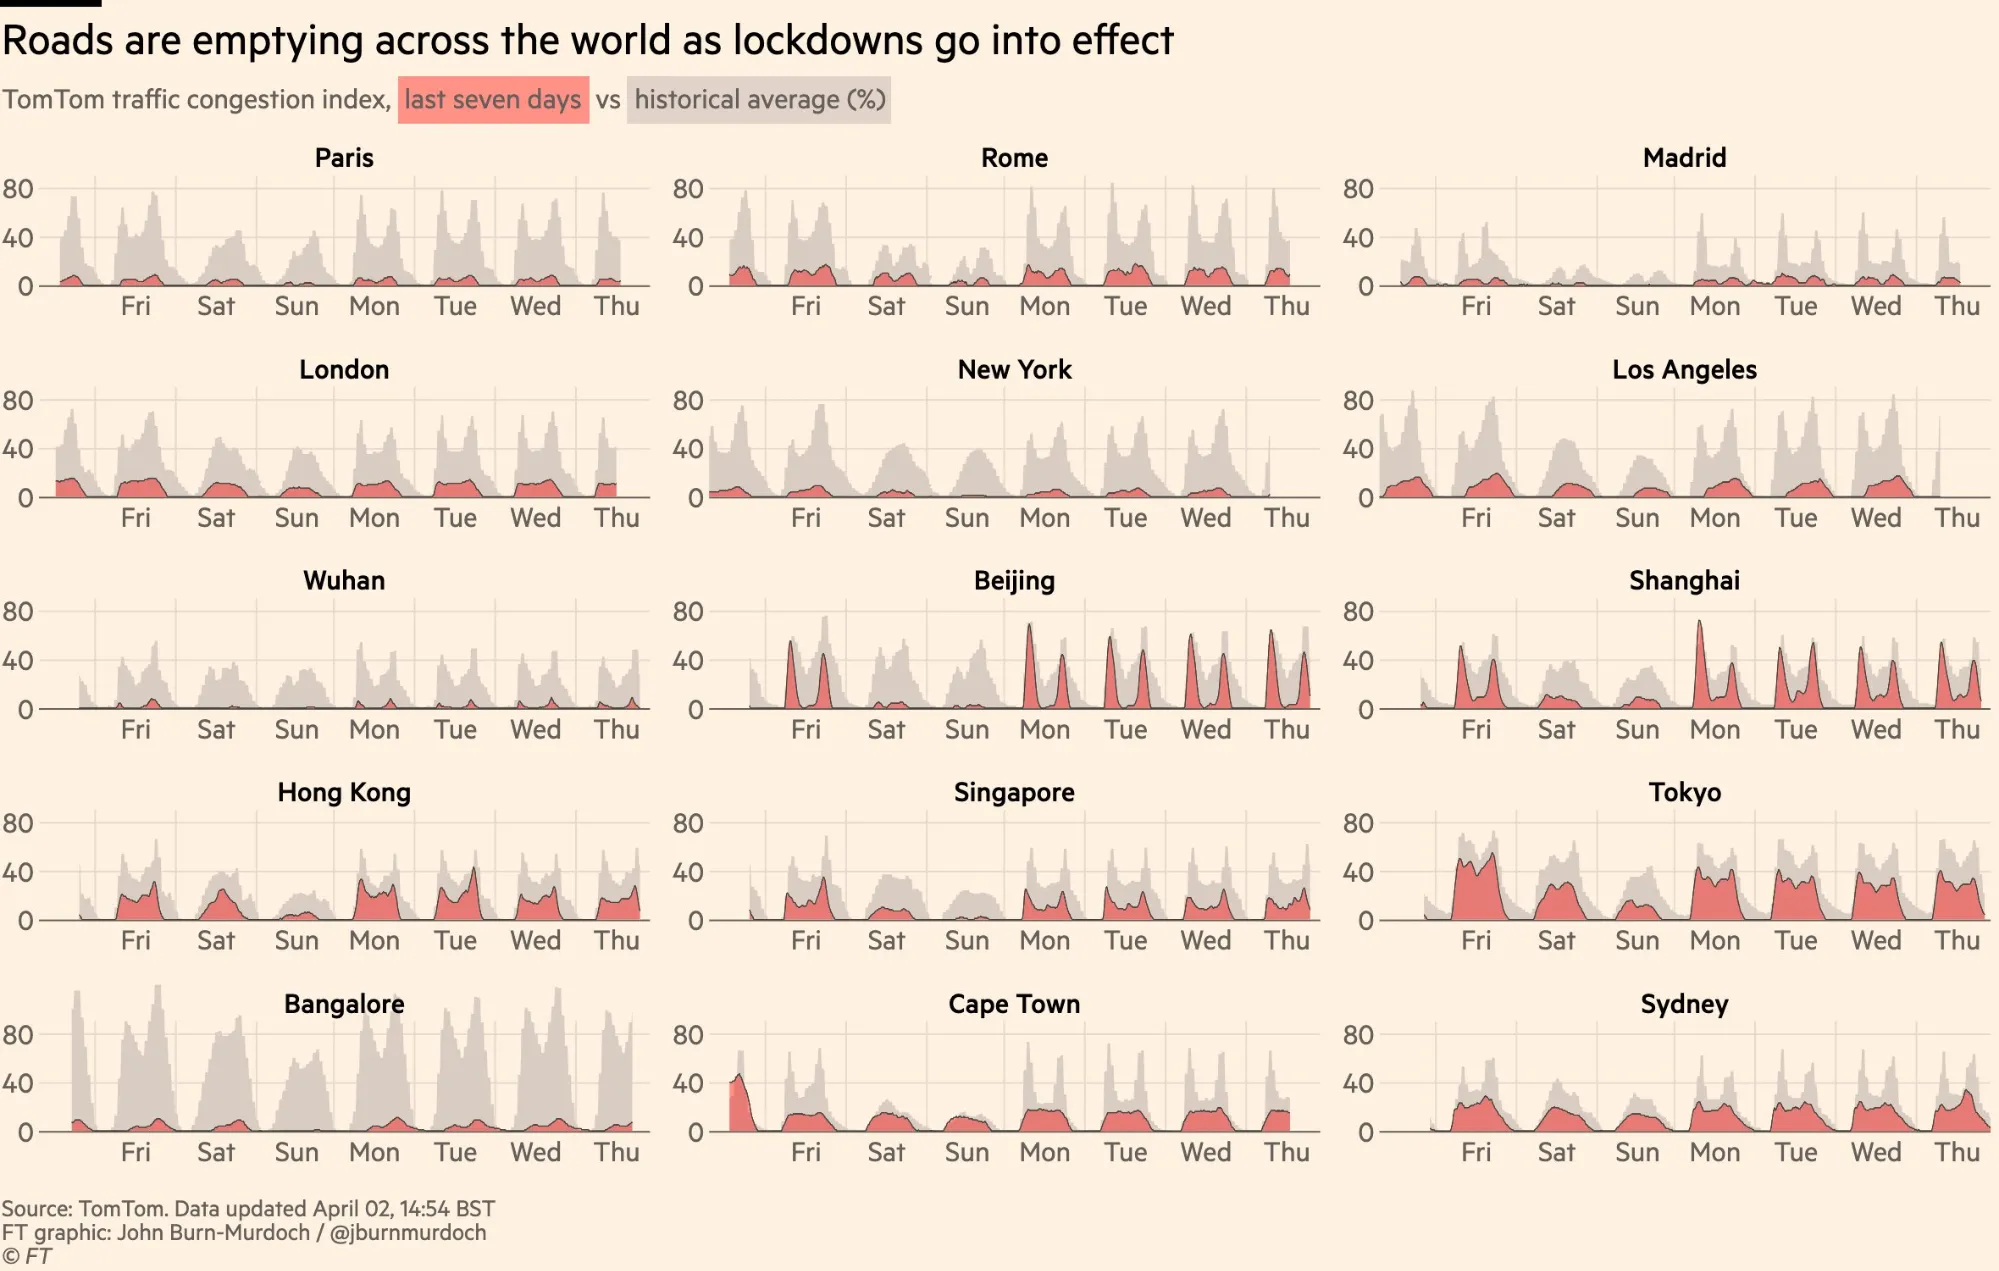
Monitoring community adherence to physical distancing and lockdowns in order to adjust government guidelines is fundamental. Police forces will be regularly providing feedback on the number of infringements they see but that lockdowns are taking place at such a wide geographical scale it is fundamental to use location data to measure impact. We’ve already seen several examples of such analysis such as Unacast’s Social Distancing Dashboard using human mobility data the Financial Times using TomTom traffic data and we’ve also worked closely with New York City to calculate risk of overcrowding in subway stations (as outlined in this post).
Citymapper’s mobility index is also a great example of how mobile app-generated data can help us to understand the impact of lockdown measures on cities. They compare trips planned in the Citymapper app to a recent typical usage period having enough data in the cities they publish to be confident that it represents a real change - looking at yesterday vs last week vs 2 weeks ago and 3 weeks ago.
Recommendation 2: Increase Diagnostic Testing Capacity and Build Data Infrastructure for Rapid Sharing of Results
Governments are rapidly trying to ramp up the number of tests they can do per day - with different models (such as drive-throughs) being used. However using site selection techniques for testing centres is critical in order to serve the highest number of potentially affected citizens - which is where self-assessment app data can come in handy for governments alongside their existing socioeconomic and demographic datasets on the population.
Here we can see an example of how this type of analysis is already taking place in Romania:
Equally rapid sharing of data and results in a common data infrastructure not just within countries but also between countries will be important through organizations such as the World Health Organization and Johns Hopkins University and Medicine.
Recommendation 3: Ensure Functioning of the Health Care System
Healthcare systems are seeing an unprecedented level of demand with many countries having to pull together makeshift hospitals or even using Navy hospital ships. Inspecting medical facilities including hospitals primary care clinics and retirement homes will be fundamental to analyze care capacity and vulnerability. For this to happen effectively inspectors will need to be equipped with the right mobile apps to do so - with existing staff already overstretched and likely unable to gather and share data in the way they normally would do under pre-COVID circumstances.
In this example one of our grantees from Radboud University has mapped vulnerable population groups in Brazilian cities visualizing a model to estimate future demand for hospital beds using the Huff Model and hospitalization rates. This spatial interaction model calculates gravity-based probabilities of consumers at each origin location. From these probabilities potential visits can be calculated for each origin location based on disposable income population or other variables.
Recommendation 4: Implement Comprehensive COVID-19 Surveillance Systems
As mentioned above symptoms maps and the resulting epidemiology analysis is hugely important in order to understand the spatial spread of the virus - both using medical testing data and self-assessment data captured by web and mobile apps.
The Catalonian government’s STOP COVID19 CAT initiative is a great example of this methodology capturing data via mobile applications to later share results back publicly in the map below:
This example from NYC shows the number of positive cases by zip code (data made available by DOHMH) including additional layers of data such as service workers rent burdened households and people of color:
Recommendation 5: Massively Scale Contact Tracing and Isolation and Quarantine
Scaling contact tracing isolation and quarantine measures are also uniquely spatial questions. Although this recommendation can be somewhat limited by the privacy legislation of the country in question and the public’s appetite for such technology using geofencing and contact tracking has proved exceptionally powerful in some Asian countries.
In the example below named Outbreak.my we can see areas where people have tested positive for coronavirus in Kuala Lumpur areas on lockdown areas that have been sanitized detailed hospital capacity and notifications on fake news (e.g. consumers claiming that positive cases have been identified in a certain supermarket):
So what triggers can help us move to Phase 2?
According to the AEI we will need to see a sustained reduction in cases for at least 14 days and states must be able to conduct active monitoring of confirmed cases and their contacts. Of course a reduction in cases can simply be seen in the numbers (as long as the data collection and infrastructure is robust) but actively monitoring confirmed cases and their interactions can also be covered with geospatial technology. It might not always be possible at the granularity that would best serve the use case but human mobility data along with other location data streams could provide some relevant indicators.
In this example one of our Data Science team looks at human mobility data to look at the relative change in the number of visits to grocery stores per census tract - which if we gradually transition out of lockdown could be relevant to analyze. You can see the full post here.
Conclusion
Analyzing just one of the five phases in our recovery roadmap already showed us a broad array of spatial use cases that need to be worked on by both private and public sector organizations in order to beat coronavirus. Data and software is more available than ever before with many companies providing grants and complementary datasets that together can make a difference.
All of this together reinforces that there has never been a more important time to work in geography and spatial analysis. We hope you are ready for the mission!
In need of support to apply Spatial Analysis and Spatial Data Science in the fight against COVID-19?


