A New Approach to Customer Segmentation Using Location Data

Sales and marketing directors all ask the same question: "How do I get my products or services in front of the right people at the right time?"
The key to any go-to-market strategy that answers this question is customer segmentation (also called market segmentation), the process of dividing a client base into groups of potential customers that share similar characteristics and needs.
Traditionally, customer segmentation has faced three main challenges:
- Segments were based entirely on a company’s internal sales data, which was inconsistent, incomplete, or even incorrect.
- Segmentation required a large investment in third-party data to create customer profiles, a process that was prohibitive for both sales and marketing departments.
- The third-party data was often based on small samples created in surveys or panels which generated insights on what people say they do not what they actually do.
The foundation of a data-driven, go-to-market strategy is literally data. More specifically, sales and marketing directors need data related to (1) potential client base (2) location of potential client base, and (3) available resources to allocate to the location of potential client base.
These are all challenges that Location Intelligence can help solve. By enriching existing sales territories or more general geographic areas with publicly accessible demographic, geographic, and behavioral data, any industry can effectively identify and optimize their customer segments.
Let's explore some examples of how geographic customer segmentation can be put into action.
Customer Segmentation for Retail
A recent survey found that 60 percent of retailers have difficulty boosting sales and promotional offers by leveraging geographic and socio-economic demographic data. Geographic and demographic data happen to rank among the most popular types for retailers when segmenting a potential client base.
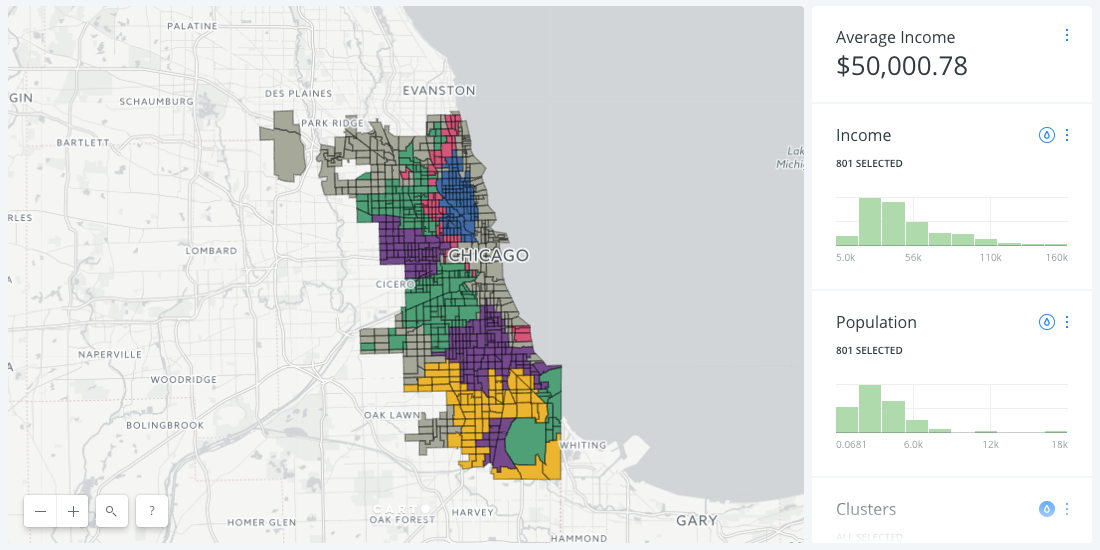
In the visualization below, we see the city of Chicago, Illinois, with two layers of data (from our Data Observatory):
- Census tracts.
- These boundaries have been enriched with multiple demographic measures about Chicago residents, such as age, gender, race and annual income.
This map above is a good starting point. You can adjust the widgets to explore the different measures used to enrich the census tracts and the default view shows an auto-styled histogram of income levels.
However, retailers need a more granular view.
To dive a little deeper, with the click of a button, we applied the Spielman and Singleton algorithm a popular clustering procedure for generating customer profiles, often paired with open U.S. Census data.
While we could populate up to 55 different clusters, we decided 10 clusters would be sufficient for this market segmentation. We applied a divergent color scheme to easily identify areas by average annual income, from highest (red) to lowest (blue).
Retailers serving price-conscious customers might want to consider areas shaded yellow and orange:
- Yellow: White and minority mix, mixed multilingual, mixed education, and mixed Income
- Orange: Renters within cities, mixed income, White and Hispanic Mix, and Unmarried
This level of customer segmentation provides sales, marketing, and operations directors with a better understanding of a territory’s context, helping them answer the question: "How do I get my products or services in front of the right people at the right time?"
Customer Segmentation for Transportation
As urban migration continues to strain transit infrastructure and congest highways, urban developers and city planners are turning to location data for help.
Solving these transportation issues requires an understanding of commuting routes and commuter behaviors.
For example, Transport For London developed the Transport Classification of Londoners by visualizing and analyzing location data. By understanding and clustering seven key variables like travel behavior, use of mobile phones, and income, they came up with nine different customer segments.
We created a visualization below of San Francisco, California, to show similar data. The map is built by importing layers of census tract data and shows behavioral segments using location data on mobility and commuting patterns. We also visualized this data with a sequential color scheme, which was chosen to shade volume from light to heavy along a multi-hue palette.
Anyone working in transportation could easily create a similar visualization to better understand and categorize their customer segments.
This type of segmentation is especially useful for fleet routing and tracking, a pain point few go-to-market territory management strategies adequately address. It can help build more accurate predictive models that can assist route optimization.
If an operations director is looking to reduce fuel costs and travel time, for instance, then one potential option would be to consider rerouting deliveries through areas where residents own fewer vehicles, as it is likely to have less traffic congestion.
What are your segments?
A lot of ground has been covered in this post, and we added links throughout on additional resources to specific topics covered in more depth.
Clearly, customer segmentation is pivotal in commercial strategy across a wide range of sectors, including many that we didn't even cover in this post (like healthcare). But sales and marketing leaders will continue to struggle if they don't include new, location-driven data sources in their segmentation.


.png)

.png)

.png)