Predicting Traffic Accident Hotspots with Spatial Data Science


Road traffic injuries are among the ten leading causes of death worldwide and they are the main cause of death among young adults aged 15-29 years [1]. In addition to the tragic impact in human lives road traffic injuries have a significant effect on the world's economy. One study estimates that road traffic injuries will cost the world economy US$1.8 trillion in the period 2015-30 [2]. The European Union estimates the impact represents 2% of their GDP [3]. These costs include property damage costs insurance administration costs hospital costs and productivity losses among others [2][4][5].
Because of these enormous impacts governments and the private sector are making big efforts to reduce these numbers. Today as a result of these efforts we have GPS-based systems that provide real-time information on traffic and weather conditions with governments providing information such as accident hotspots (a.k.a. accident blackspots) and other useful statistics.

However this information is available either post accident or it is static. For example one location can have a relatively low concentration of accidents but all occurring under a same set of rare circumstances. In this case it would be useful to identify this location as a hotspot only when those circumstances take place i.e. as a dynamic hotspot.
Knowing the conditions under which accidents happen and where they happen is very powerful information that can be used to take action to avoid them. For example logistics companies can use this information to avoid specific routes insurance companies can share this information with their clients and cities can assign their traffic police to the dynamic hotspots.
In this blog post we present a detailed analysis and a powerful predictive model that can help identify the factors affecting accident concentration and how these results can be further used to define dynamic hotspots. The analysis focuses on the city of Barcelona (Spain) using traffic accident data from 2019 and can be replicated in other cities and regions of the world. Barcelona was selected as it is a mid-large city and has available a rich Open Data catalog.
Data Sources
We identified different data sources that can influence accidents and worked with open and premium data. All premium datasets were obtained through CARTO's Data Observatory.
The following map shows all the datasets we used for this model. The layer selector on the legends can be used to activate/deactivate one layer and analyze them. Note that data is only shown for an area of the city.
Open Data
Open data comes from three sources:
- Barcelona Open Data Catalog for accident and road traffic signalling data
- OpenStreetMaps (OSM) for building footprints and road intersections
- AEMET for historical daily weather data
Traffic accident data is organized in 5 different datasets and contains very detailed information such as geolocation date and hour number of injured people age and gender of people involved type and years of driving license main cause type of accident and the type and color of vehicle.
Premium Data
We also identified other features that can influence accidents such as traffic density and points of interest (POI). All this data is provided by a range of CARTO data partners through CARTO's Data Observatory.
- Traffic stats dataset is provided by TomTom and contains information about traffic density and speed per street segment. We are using a month of data because we are interested in trends not exact numbers so one month is enough to identify hourly and daily trends.
- Point of Interest (POI) dataset is provided by Pitney Bowes. POIs are classified at different category levels the highest being by trade division (retail transportation tourism etc.).
- Human Mobility (footfall) dataset is provided by Vodafone and consists of anonymized counts of unique visitors and total visits to an area during a time window segmented by age gender visitor profile and economic level in a 250x250m cell grid. We are using a month of data because we are interested in identifying variations between days of the week and time intervals not exact numbers.
- Working population dataset is provided by Unica360 and consists of the number of companies and employees by type in a 100x100m cell grid. This data is later transformed into Vodafone's 250x250m cell grid as described below.

Accident Datasets Analysis
We start our study by analyzing all the information available for the traffic accidents. We are interested in understanding accidents spatially temporally and based on factors such as age type of vehicle reason for trip etc.
Temporal analysis
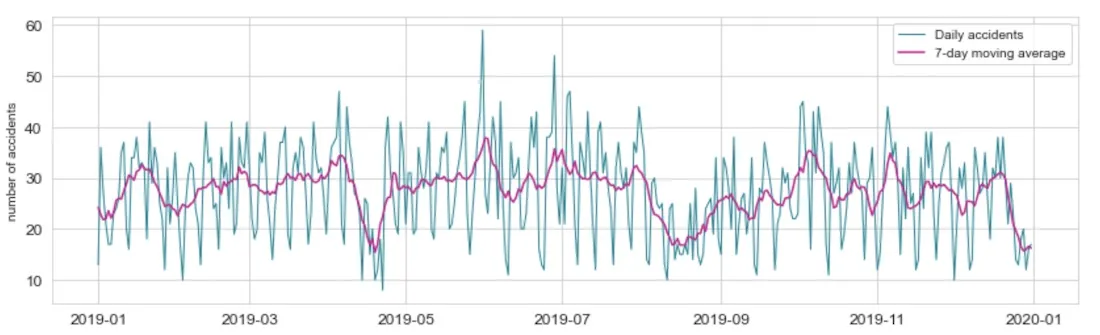
We first take a look at the daily time series (see figure below). This first analysis gives us an initial overview on the stationarity of accidents throughout the year. We can observe how:
- During the three main holiday seasons (Easter August and Christmas) the number of accidents is significantly lower
- There is a weekly seasonality in accidents
- During the first half of the year the number of accidents is slightly higher than during the second half
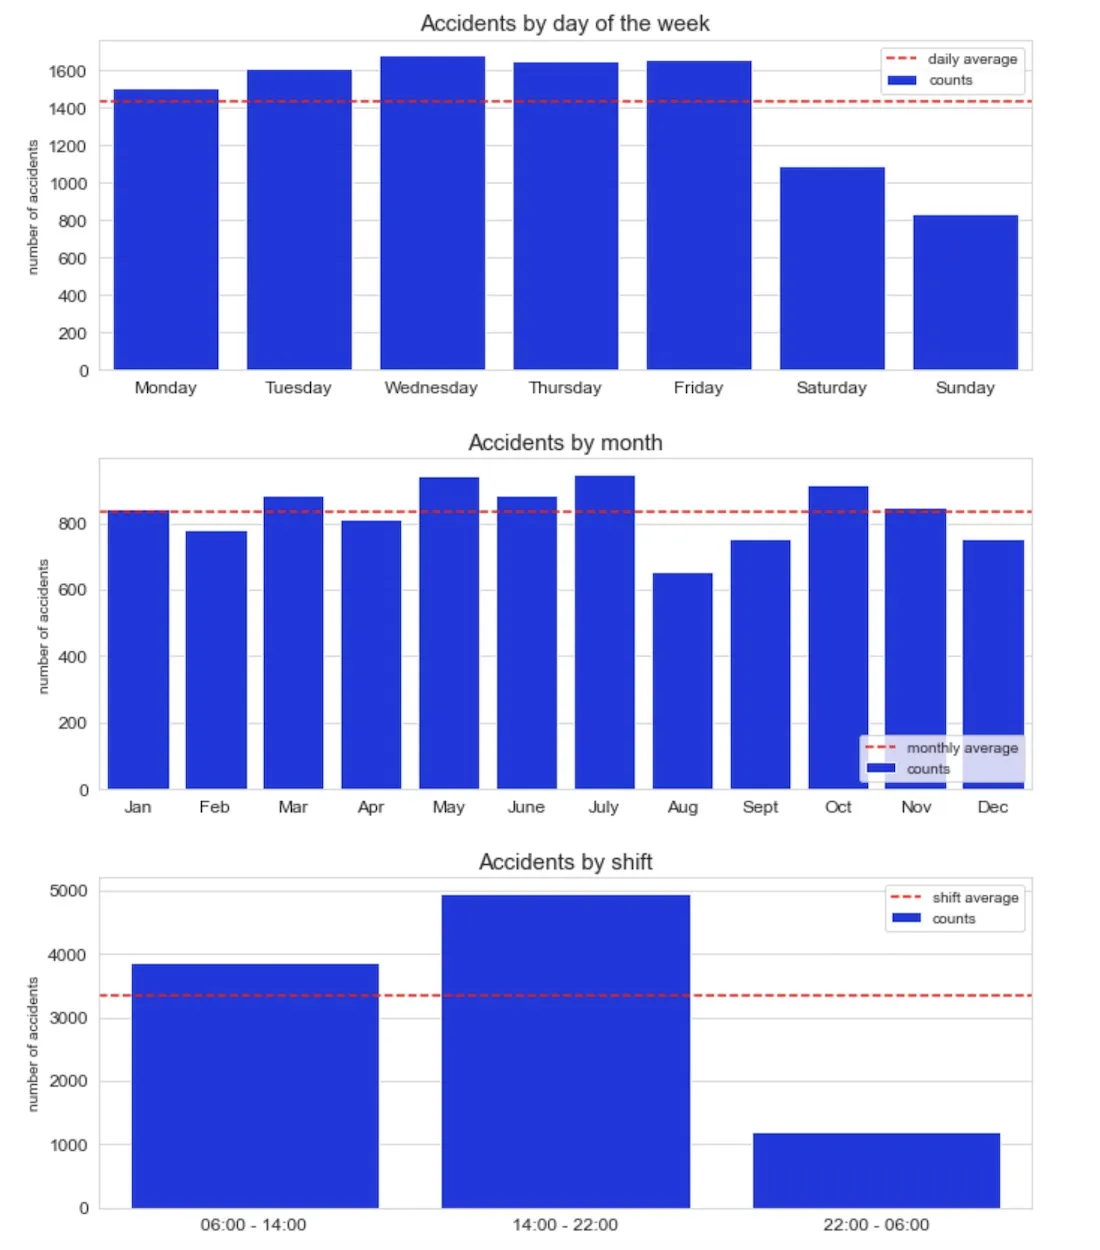
We analyzed aggregated temporal patterns by day of the week month and time of the day (see figure below). We can see very different patterns that call for a dynamic and responsive approach to tackle accidents.
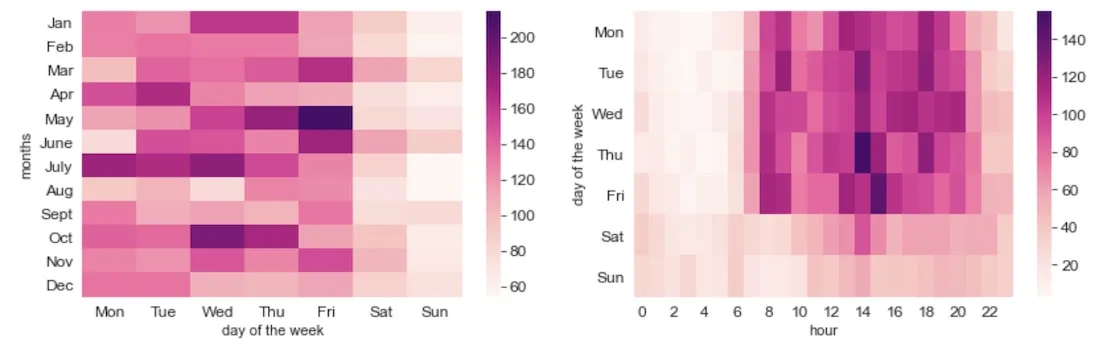
When looking at a more disaggregated time study (see figure below) we identified accidents during working days peaking during working hours whilst being more evenly distributed throughout the day (even at night hours) on weekends. Also Thursdays from 2pm to 3pm and Fridays from 3pm to 4pm have an especially high number of accidents.
Spatio-temporal Analysis
We have already identified that accidents don't show a temporal stationary behavior and concentrate at specific hours depending on the day. Is this behavior also present spatially? As you might already know it is. In fact accidents concentrate in different parts of the city depending on the type of day and month of the year as can be seen in the two maps below. These results show the importance of defining dynamic hotspots.
Analysis Based on Accident Characteristics
Now we are interested in analyzing how factors such as age type of vehicle or trip purpose affect the number of accidents. In order to perform this analysis we built the following dashboard using our Python package CARTOframes. On the dashboard accidents are labelled based on their type and the widgets on the right allow us to filter them by cause type of vehicle type of day among others to discover new insights.
Some interesting insights we can easily identify are:
- Half of the accidents with alcohol as the direct cause occurred on weekends
- While young adults aged 18-25 are the fourth highest demographic group in number of accidents they are the second when considering only accidents at night
- Car-pedestrian crashes are the main type of accidents for people aged +65 and the fourth when considering all age groups
- Almost 50% of the deadliest accidents occurred on a weekend
These insights further underline the importance of defining dynamic hotspots.
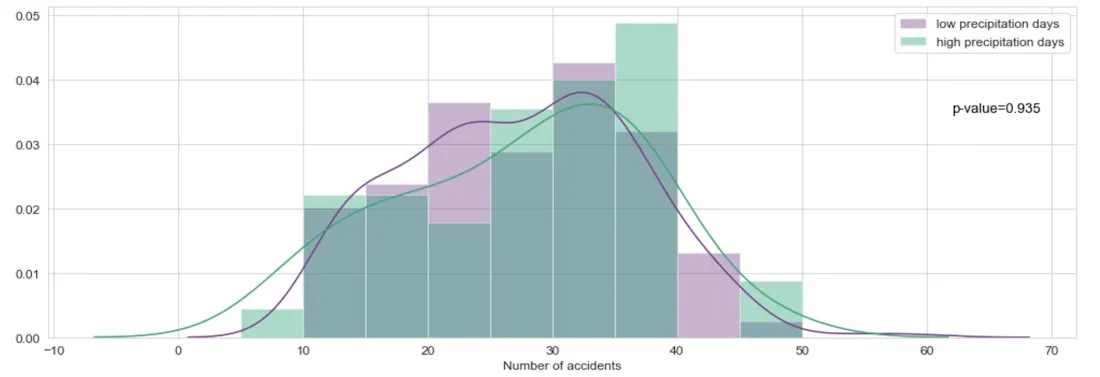
Impact of Weather Conditions
We were also interested in understanding the impact of weather and in particular the impact of rain. Surprisingly enough we found out that in Barcelona the difference in the number of accidents during rainy days vs non-rainy days is not statistically significant most likely due to the city's mild weather. This is however something to be considered in other cities as it might have a big impact on accidents especially in cities with more extreme and variable weather conditions.
Discovering Complex Data Patterns using Advanced Spatial Modeling
We have already seen how space time and other factors such as age and type of vehicle affect traffic accidents. In this section we will apply modeling techniques to infer more advanced insights. First we will perform a hotspot analysis using Local Moran's I statistic and then by training a predictive model to predict the annual number of accidents by area we can understand the effect of other factors such as human mobility and traffic signalling.
Before we start we need to define our areas. Ideally we should select a regular grid for the sake of data normalization. We selected Vodafone 250x250m cell grid as our base support and aggregated our data and performed our analyses with this support as reference. Note there are also standard hierarchical grids such as H3 or Quadkey grid that can make your analyses much easier especially if you need to move between different aggregation levels.
Hotspot Analysis with Moran's I
Local Moran's I statistic allows us to identify hot and cold areas in the city which correspond to areas of statistically significant high and low concentration of accidents. Most importantly it allows us to identify locations of high concentration of accidents in low concentration areas. Studying these locations can be even more important than hot areas and are considered spatial outliers.
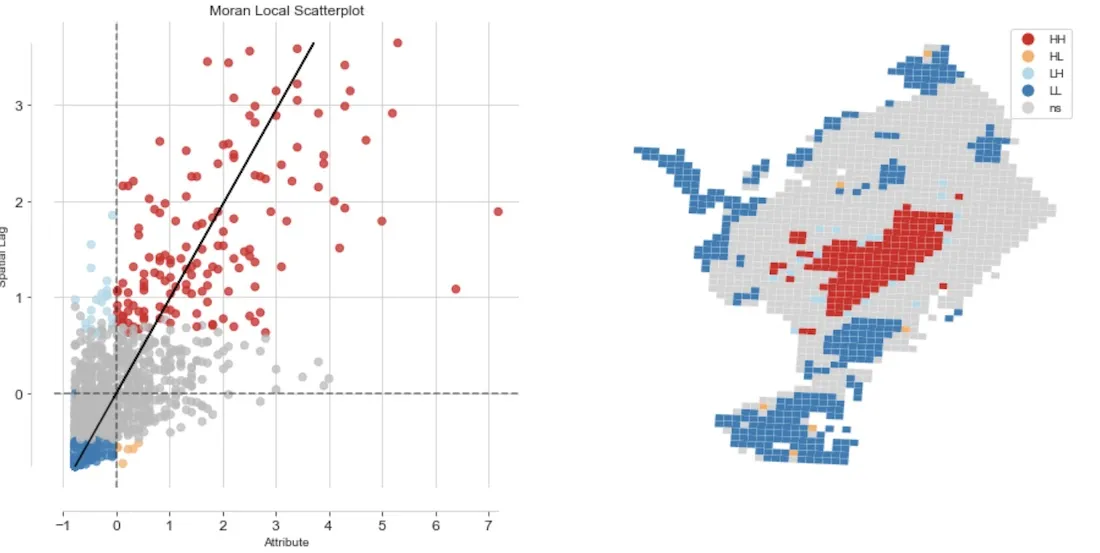
The following map shows the hot (HH) and cold (LL) areas together with the spatial outliers (HL and LH) with a significance level of 0.05. We identified six cells with a high concentration of accidents in low concentration areas. These are classified as HL (High-Low). Now what is different in these cells with regards to their surrounding cells?
We first analyzed the urban characteristics of these cells. In most cases they correspond to locations with large roundabouts or complex road systems as can be seen in the maps below.
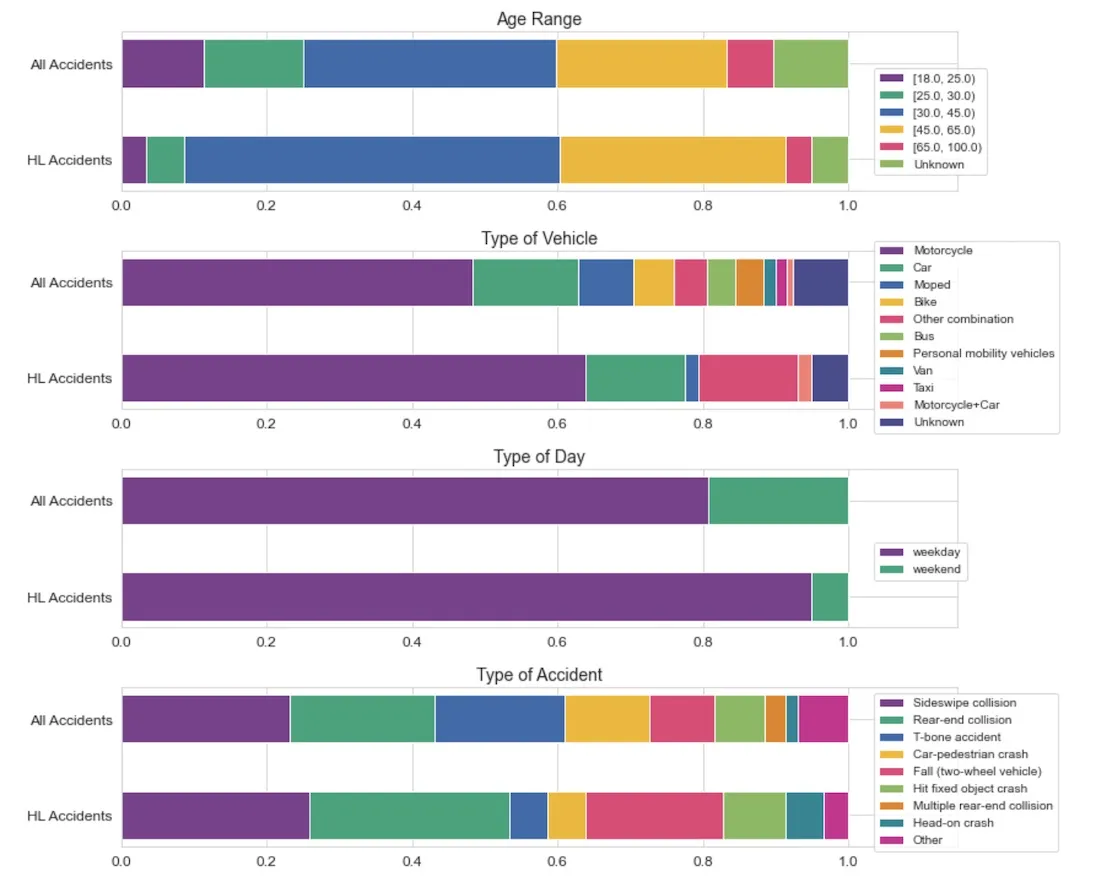
We also looked at the characteristics of accidents in these areas compared to the rest of the city and found some interesting differences:
- More than 80% of the people involved were between 30 and 65 compared to around 60% when factoring in all accidents.
- Around 65% were motorcycle accidents compared to 50% when looking at the whole city.
- More than 95% of accidents in these HL locations happened on a weekday compared to around 80% of all accidents.
Building a Predictive Model to Understand the Effect of External Factors
In order to study the impact of other factors such as human mobility and traffic signalling we can train a predictive model to predict the annual number of accidents per cell. Note we are focusing now on the annual number of accidents to identify factors that affect accidents. This information will be very valuable to define dynamic hotspots as a further step.
Data Preparation
The first step is to transform all the data we want to use to the Vodafone 250x250m cell grid we set as base geographic support.
Points and area related variables are easily transformed by aggregating. However the working population is provided in a 100x100m cell grid which does not fit into the 250x250m cell grid. In order to transform this data we used areal interpolation which can be automatically achieved using the data enrichment functionality of CARTOframes.
Note that other data preparation steps were performed and we have only focused on the purely spatial aspects.
Feature Engineering
Apart from the enriched data we created new features based on the knowledge obtained throughout the analysis. These features are:
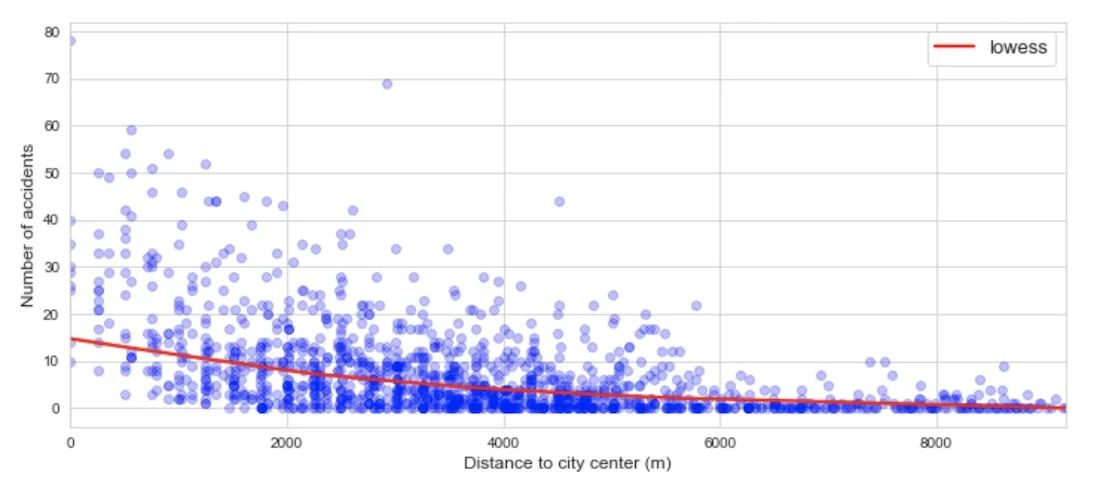
- Distance to city center. This was identified as a result of hot spot analysis with the main hot area in the geographic center of the city i.e. the closer to this area the higher the number of accidents (see figure below).
- Index of road types. TomTom provides all the roads in the city classified by type. We created an index based on the type of roads and their length in every cell.
- Index of speed. TomTom also provides all the roads in the city classified by speed limit. We created an index based on the road's speed limits and their length in every cell.
- Index of road intersections. We created an index based on the number of road intersections in a cell and the average distance to the three closest road intersections of every road intersection.
- Traffic standard deviation. We used the standard deviation of hourly traffic in all roads within a cell as a proxy to identify areas with high peaks and large variations of traffic.
- Road area. Derived from building footprints as a proxy to the area covered by roads.
The Model
For the predictive model we trained a Regression Kriging model using a Random Forest regressor for the regression part.
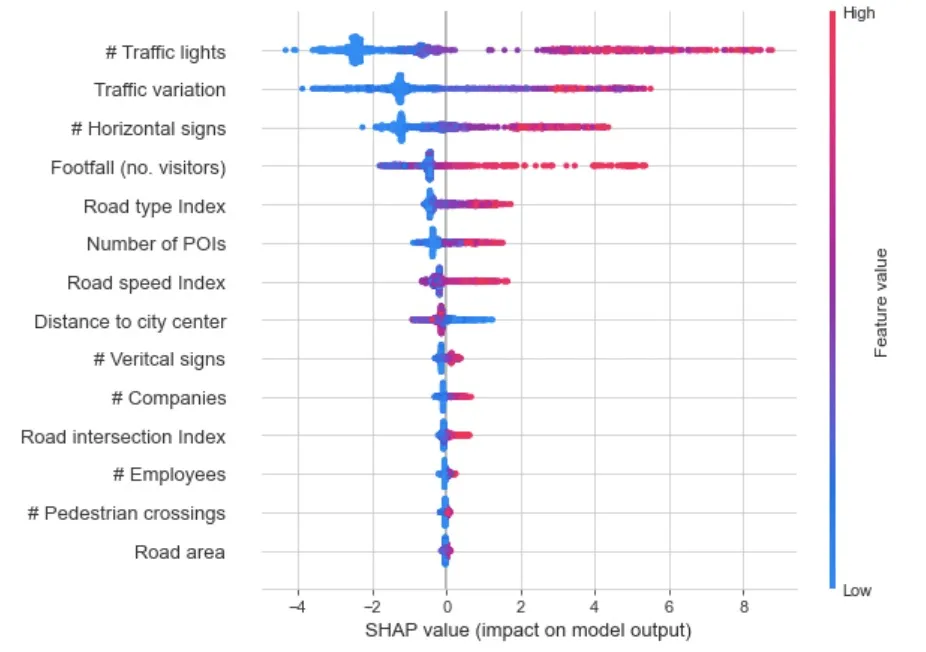
The main findings from this model are summarized on the SHAP summary plot below. We could highlight that accidents are highly influenced by:
- Traffic variation. We can expect more accidents in areas with large variations of traffic i.e. areas with peaks of traffic.
- Human mobility has a big impact on accidents as well. Areas with high footfall experience a higher amount of accidents.
- Number of traffic lights and horizontal signs. The larger the number of these signs the larger the amount of accidents. This makes sense as normally there is more concentration of these signs in locations with road intersections and heavy traffic.
- Areas with more business premises also experience higher amounts of accidents. This can be explained by higher concentration of traffic in short periods of time early in the morning and in the afternoon.
- Road Type Index. The model identified that the types of roads is the fifth most important feature.
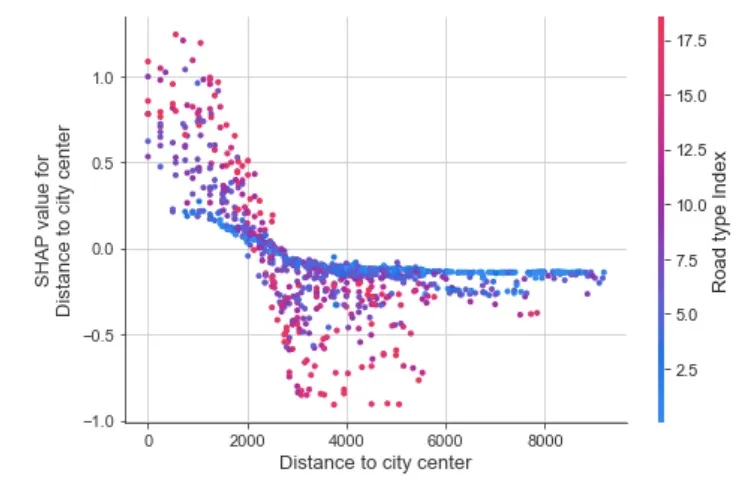
It is especially interesting to analyze the effect that distance to the geographic city center has. We can see how for cells with a mid-high Road Type Index value as you get closer to the city center the number of accidents increases. However for cells with a low Road Type Index value the effect of distance to the geographic city center is significantly weaker.
Finally regarding model performance we obtained an R2 score of 0.71. The following map shows the ground truth compared to the model's prediction. We can see that they look very similar when aggregating the results into intervals of accident intensity degrees.
Conclusion and Next Steps
Road traffic injuries are among the ten leading causes of death worldwide and have a significant impact on the world's economy affecting many public and private sectors. The study presented in this blog post shows that accidents are heavily influenced by space time and other factors such as age type of vehicle traffic type of roads and human mobility. These results call for further steps in which dynamic hotspots are identified so that this information can be used for better management of public and private resources.
The effective identification of dynamic hotspots can be used in a number of use cases including allowing:
- Cities to more effectively organize their traffic control systems
- Logistics companies to optimize routes by anticipating dangerous spots
- Insurance companies to share this information with their clients for a safer driving experience
References
[1] WHO W. (2013). Global status report on road safety 2013: supporting a decade of action.
[2] Chen S. Kuhn M. Prettner K. & Bloom D. E. (2019). The global macroeconomic burden of road injuries: estimates and projections for 166 countries. The Lancet Planetary Health 3(9) e390-e398.
[3] Mobility and transport - European Commission. (2016 Oct 19). Socio-economic costs and the value of prevention. Retrieved from here
[4] CENTERS FOR DISEASE CONTROL AND PREVENTION; DIVISION OF UNINTENTIONAL INJURY PREVENTION. (2020 Nov 6). Cost Data and Prevention Policies. Retrieved from here
[5] García-Altés A. & Pérez K. (2007). The economic cost of road traffic crashes in an urban setting. Injury prevention 13(1) 65-68.
Want to get started?
 | This project has received funding from the European Union's Horizon 2020 research and innovation programme under grant agreement No 960401. |