

Risk Analysis and Optimization with Weather Data


Weather is intertwined in the fabric of our lives. Much of the time its impact is passive - we keep an umbrella in our desk we check it to determine our outfit. Sometimes that impact is active pronounced and global in scale with major weather events in 2018 costing the United States upwards of $1.6 trillion. Either way those impacts permeate affecting the choices and decisions we make as individuals organizations governments and as a global community.
For businesses understanding the impact of weather and climate and interpolating future weather-related challenges is crucial. How do weather conditions and seasonal shifts impact consumer behavior? What risks do weather events pose to your efficiency to your supply chain to your workforce? For answering these questions weather-related data represents a huge asset.
Data like this is even more important in the era of man-made climate change. As reported by the Intergovernmental Panel on Climate Change although many weather events are the result of natural climate variability it is well recognized that climate change may lead to changes in the frequency intensity and spatial extent of weather extremes. Businesses and organizations need to minimize the financial and physical damage risk posed by these changes.
To that end we're thrilled to announce the inclusion of premium datasets from Weather Source in our Location Data Stream Catalogue. Weather Source is the leading provider of global past present forecast and climatology weather data and turn-key weather based solutions. Drawing on cutting-edge science data analytics and meteorological expertise Weather Source has since 2015 been delivering the industry's most comprehensive and accurate weather & climate data enabling companies to quantify the impact of weather on business functions and to reduce waste increase return on investment fine-tune logistics optimize marketing strategy improve resource planning and much more. Datasets now available in CARTO include:
- Past weather data from the year 2000 to present
- 10 and 15-day weather forecasts
- Global climatology data providing weather statistics such as weather means standard deviations and frequency of occurrence values for any location and any date and/or hour during a calendar year.
Covering all land masses up to 200 miles offshore Weather Source data can be provided at both daily and hourly temporal resolutions. These datasets are available for any collection of latitudinal or longitudinal points and aggregated for geographic areas such as postal codes metropolitan statistical areas and other administrative regions.
Weather Source products are generated from multiple data sources such as the Climate Forecast System Reanalysis (CFSR) for the historical and climatology products and the Global Forecast System (GFS) for real-time data and forecasting. These products are then coupled with Weather Source analysis tools used to identify for example any errors or gaps in the data producing highly accurate weather data at any location of interest.
{% include icons/icon-bookmark.svg %} Want to start incorporating new data streams and spatial analysis into your work? Get started with CARTO today!
Applied Weather Source Data for Analysis
In order to understand the impact of extreme weather events such as heat waves droughts tornadoes and hurricanes it is useful to look at the patterns of some of these events using Weather Source data and CARTOframes.
During the last week of June 2019 Europe was struck by a heatwave. The event broke a number of historical records at distinct locations in several countries (a record of 7°C was measured at the 4810m high Mont Blanc summit). This event in contrast to typical heatwave events that occur in mid-summer caused many disruptions to both school and professional activities. In France the government decided to postpone one national exam. In Switzerland heat damage to train tracks caused several delays. And in Rome civil security distributed free water to tourists.
To better highlight June 2019 temperatures (at 2 meters above the surface) compared to past values during the same period of the year we plotted daily anomalies given by the difference between the actual values and the average values over the 2000-2015 period (climatology).
As we can see from the map very large positive anomalies appear across all of central Europe especially in central and southern France.
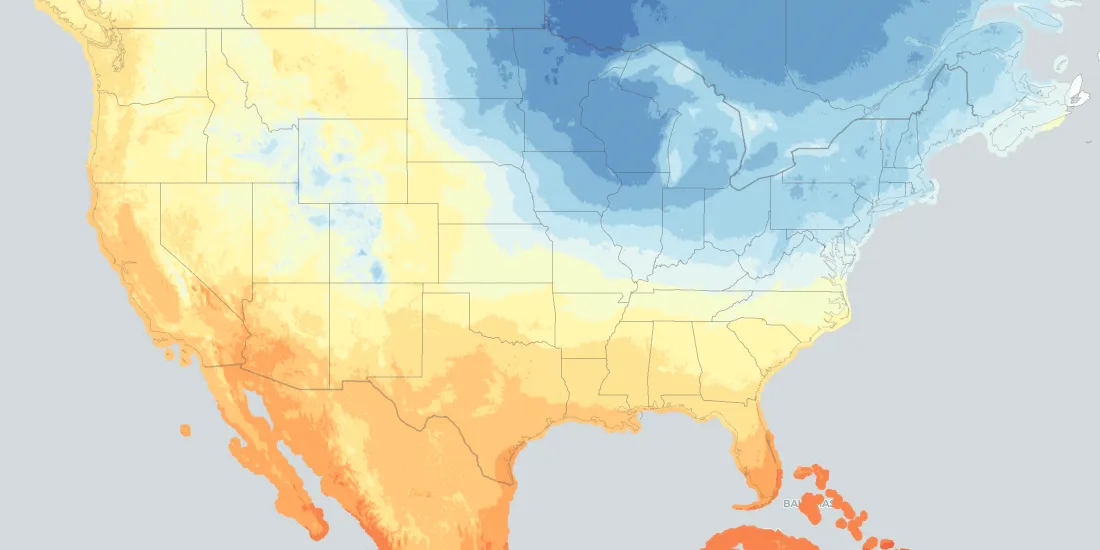
Although it might seem counterintuitive in a warming climate extreme cold weather events also occur carrying impacts on human health the physical environment and energy and resource consumption. In late January 2019 a severe cold spell hit the United States and Canada killing at least 22 people. As we can see from the below map which shows the temperature (at 2 meters above the surface) on January 31 2019 all midwestern states and the northeast of the United States show dangerously cold conditions.
Although there are fewer studies available and less consensus around changes in the characteristics of cold spells a growing body of research has highlighted ways in which rapid Arctic warming can lead to colder winters more extreme heatwaves and even droughts and floods across North America Europe and Asia.
As for weather extremes hurricanes have an even more deadly impact on our society. It's currently hurricane season and while these storms occur naturally there is evidence that human‐caused climate change is supercharging them and exacerbating the risk of major damage powered by increasing sea surface temperatures.
This was seen recently with hurricane Dorian making landfall in the US after devastating the Bahamas. Only a year ago hurricane Florence generated massive flooding killing 22 people and causing $24B in damage in the Carolinas. In the animated map below we can watch as hurricane Florence approaches the coast on September 14th 2018 just south of Wrightsville Beach North Carolina and see increases in precipitation cloud cover and relative humidity (at 2 meters above the surface).
Precipitation Visualized
Cloud Cover Visualized
Relative Humidity Visualized
Although the causes behind hurricane Florence are still debated the ultimate question is what can we do to bolster our protections and reduce destruction damages and deaths resulting from future catastrophes given the likelihood that global warming will make hurricanes even worse in the future. Now Weather Source data and CARTO can help your business or organization in tackling this challenge.
Get Started with Modern Up-to-Date Data Streams
Learn more about CARTO's location data streams today and start incorporating data from WeatherSource and other high-quality data sets into your models and spatial analyses today.
Special thanks to Mamata Akella CARTO's Head of Cartography for her support in the creation of the maps in this post.


