What's New in CARTO - Q2 2023


We are thrilled to announce the latest set of enhancements and new product features delivered during Q2 2023. These innovations are designed to revolutionize the way you harness the power of spatial data and analysis in your cloud data warehouse platform.
Driven by our commitment to empower users with the tools to make data-driven decisions with confidence, in the past months, we have worked on providing even more capabilities for delivering richer insights and a more interactive data exploration experience using the power of maps. We have deployed new components that remove the need to write complex queries when designing and automating data preparation and analysis pipelines, and added support for more geospatial analysis functions via our Analytics Toolbox so you can supercharge your cloud data warehouse.
In today’s data-driven landscape, cloud native technologies provide enterprises with unrivaled scalability, flexibility and cost-efficiency gains, resulting in a paradigm shift for data exploration, analysis and visualization of massive amounts of data. Our mission is to accelerate the delivery of unique features for spatial analysis and data visualization that run natively in Google BigQuery, Snowflake, Redshift and Databricks, unlocking powerful location-based insights within your data cloud.
Let’s now take a look at our most recent product releases, and remember to stay tuned as we are already working on new initiatives to give you the best spatial analytics platform built for the modern data stack. Check out our What’s New page to keep up to date with our most recent developments.
Integrate more complex KPIs in Builder maps with our support for custom calculations in Formula widgets
CARTO Builder now provides advanced capabilities to create custom calculations in Formula widgets and derive richer insights from data using SQL expressions. You now have the flexibility to go beyond the previous default aggregation operations (e.g. SUM, AVG, COUNT) and incorporate business-specific KPIs into your Builder maps.
Additionally, if you are working with Builder maps out in the field (e.g. servicing your network, visiting merchants, delivering goods), you can now center the map on your specific device location, with just a single click.
New features for more powerful analysis workflows and flexibility in data transformation pipelines
When creating geospatial analysis workflows, often it’s necessary to define a set of custom geographies (e.g. points, polygons, lines) as inputs for other components of the pipeline. Now in CARTO Workflows, leveraging the component “Table from GeoJSON”, users have the option to “Draw features” with the help of a new interface; which is particularly useful to define a bounding box to filter data and specific locations as points, for example.
We have also added the possibility to rename nodes when added to the canvas to describe the steps in the workflow plus the option to include annotations, with support for markdown formatting, so users can better describe their workflows when sharing.
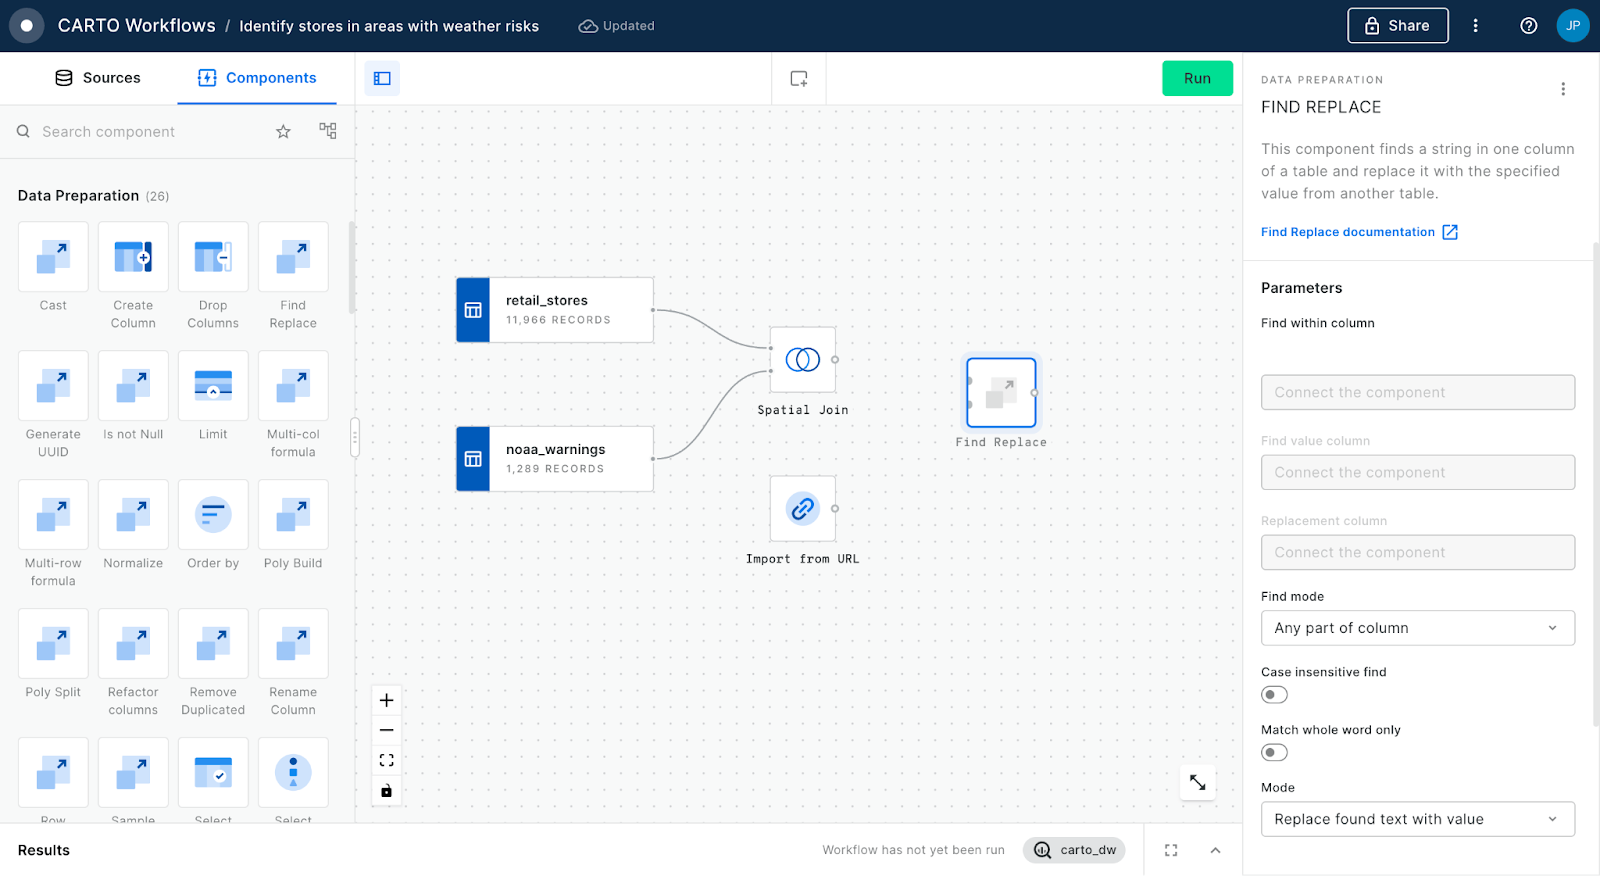
Additionally, during these past months, we have released a new batch of components in Workflows to broaden the possibilities and further increase the value of the tool when creating data pipelines and running spatial analyses. The majority of components in this new batch are focused on providing more flexibility when manipulating and getting your data ready for analysis; some of these new components include: Find replace, Refactor columns, Multi-Col and Multi-Row Formula, Unique, H3 to Parent, H3 KRing and H3 Distance.
Increased control over your geospatial data imports and your CARTO Data Warehouse connection
When importing geospatial data to a cloud data warehouse, one of the challenges is to select the correct data type for each of the columns in the file, also known as schema. CARTO now supports both auto-guess and manually defined schemas for your file imports, both through the CARTO Workspace and Builder, and through our Imports API.
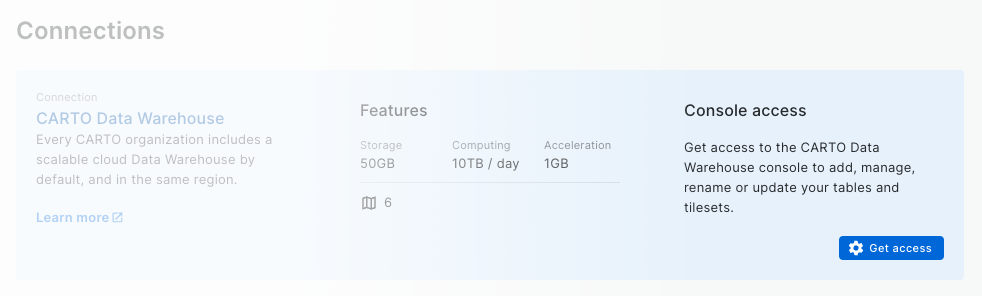
In addition, users that leverage the CARTO Data Warehouse connection can now introduce their Google account credentials to get console access to resources available via that connection; allowing for more flexibility when executing queries, copying and editing existing tables or using other built-in features to import and migrate data. Read more on how to get access to the CARTO Data Warehouse console.
More geospatial horsepower for your data warehouse: routing capabilities, space-time clusters, geostatistics and H3 support
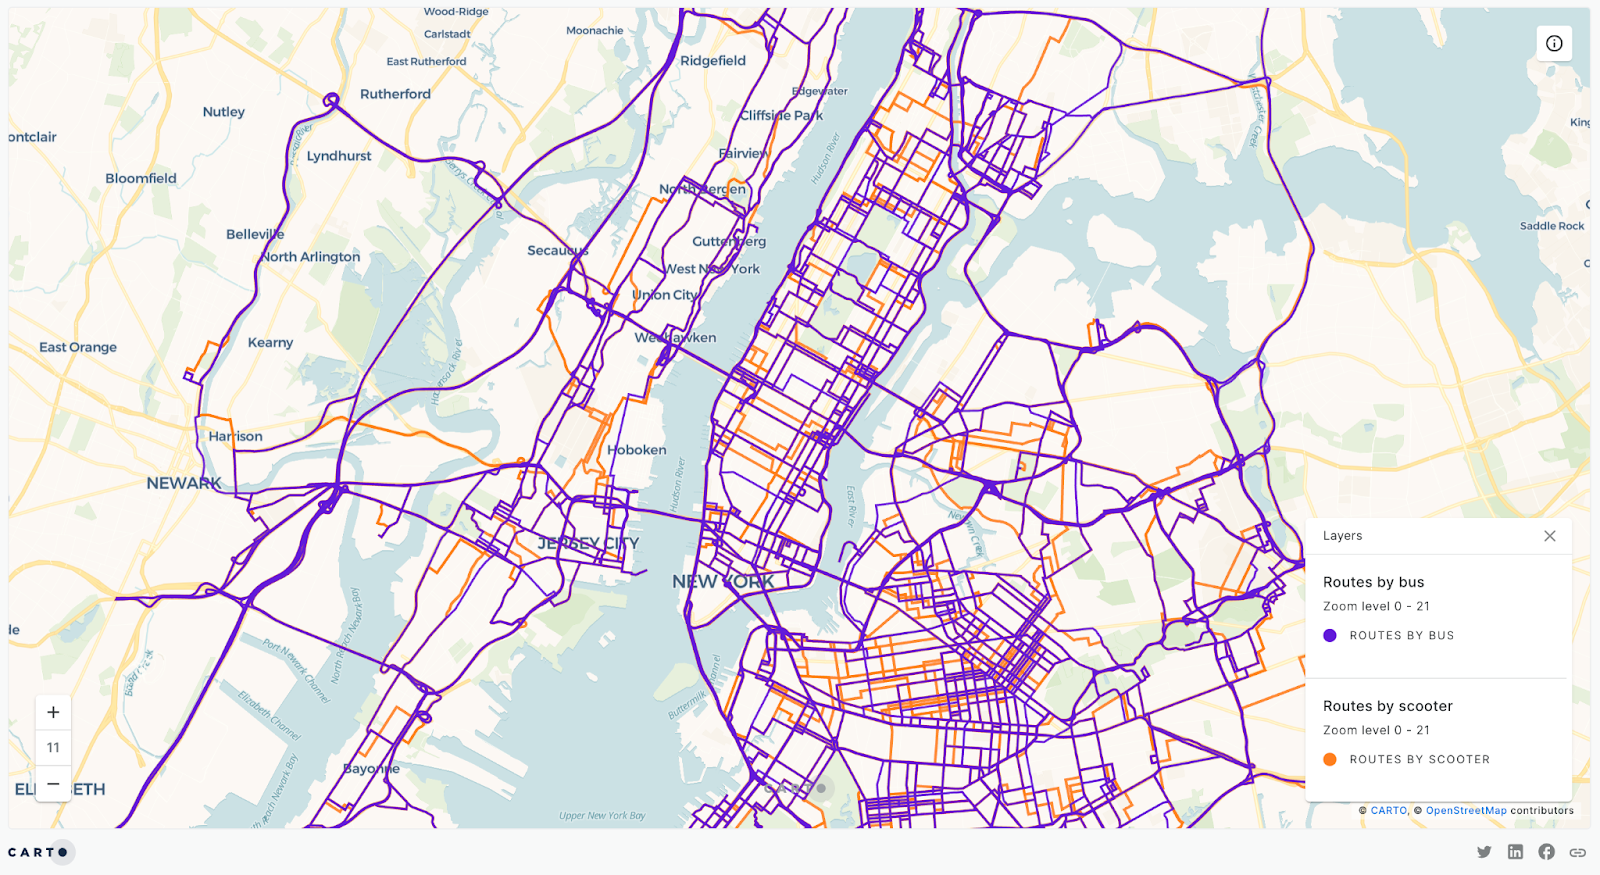
One of our main objectives is to ensure users have access to unique spatial analysis capabilities that can run natively in their cloud data warehouses, and one of the ways to achieve this is via the monthly updates to our Analytics Toolbox. With the releases we have made in the past months, users of the Analytics Toolbox for BigQuery, Snowflake and Redshift can now create point-to-point routes for different transportation modes thanks to a new function in the LDS module. We have added the function to CREATE_ROUTES between given sets of origins and destinations (points) in a query, supporting different transportation modes and other advanced parameters.
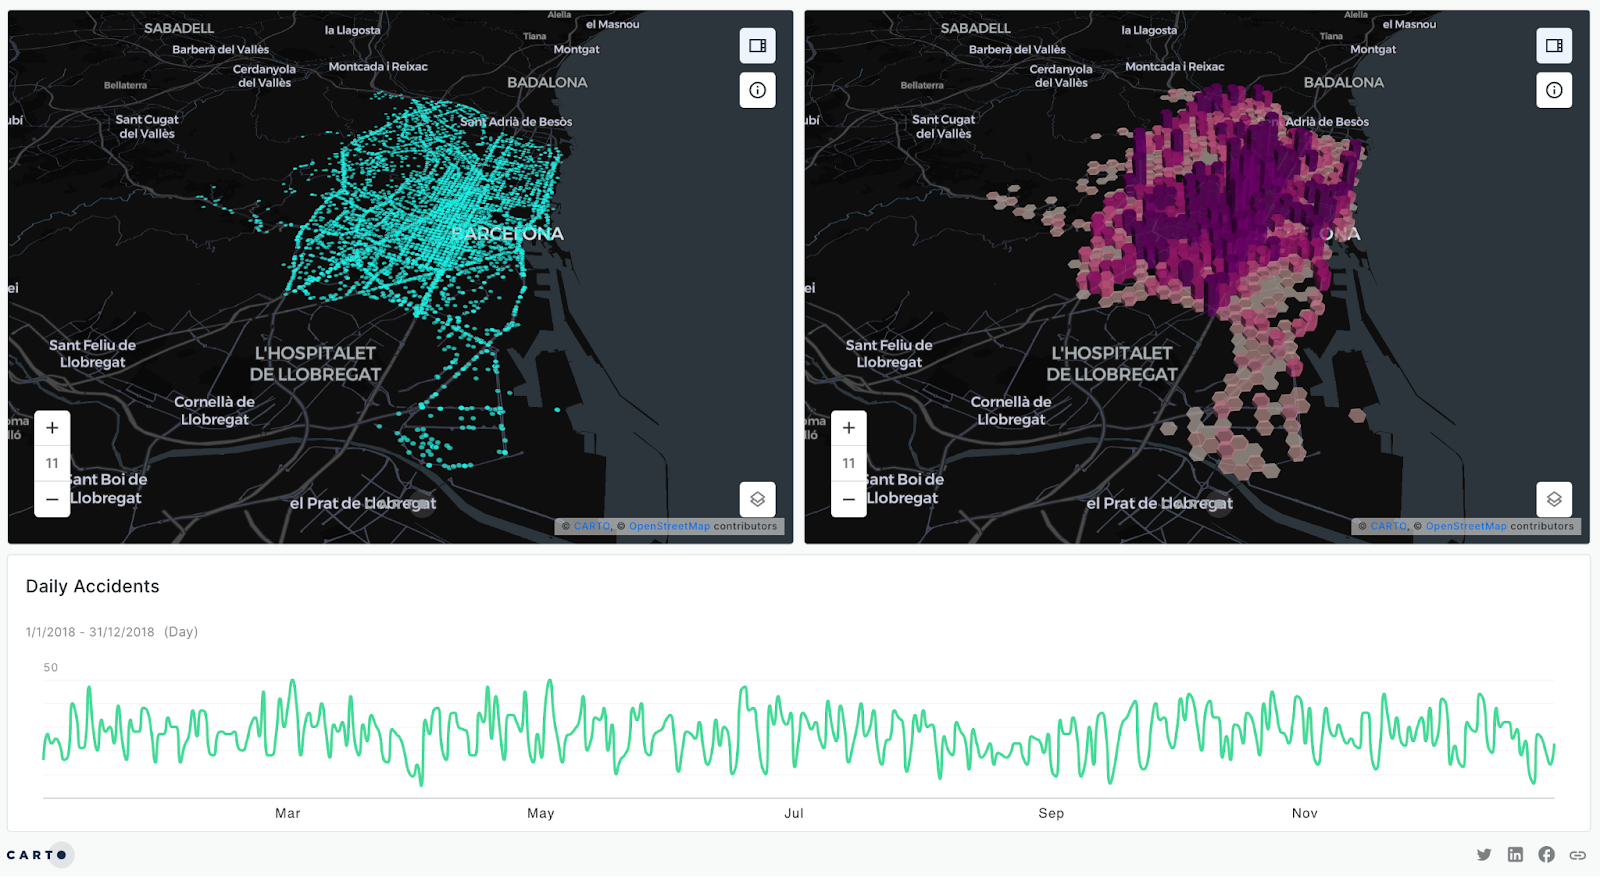
In the Analytics Toolbox for BigQuery we have made a new set of functions available in order to perform space-time cluster analysis, for data that has both a spatial and a temporal component and to identify clusters looking at both dimensions at the same time (e.g. hotspots of demand for food delivery services during different periods of the day). Our implementation computes the space temporal Getis-Ord Gi* statistic for each area and timestamp according to the method described in this paper. This is now supported with two new functions in the statistics module of the toolbox, namely GETIS_ORD_SPACETIME_QUADBIN for quadbin indexes and GETIS_ORD_SPACETIME_H3 for H3 indexes.
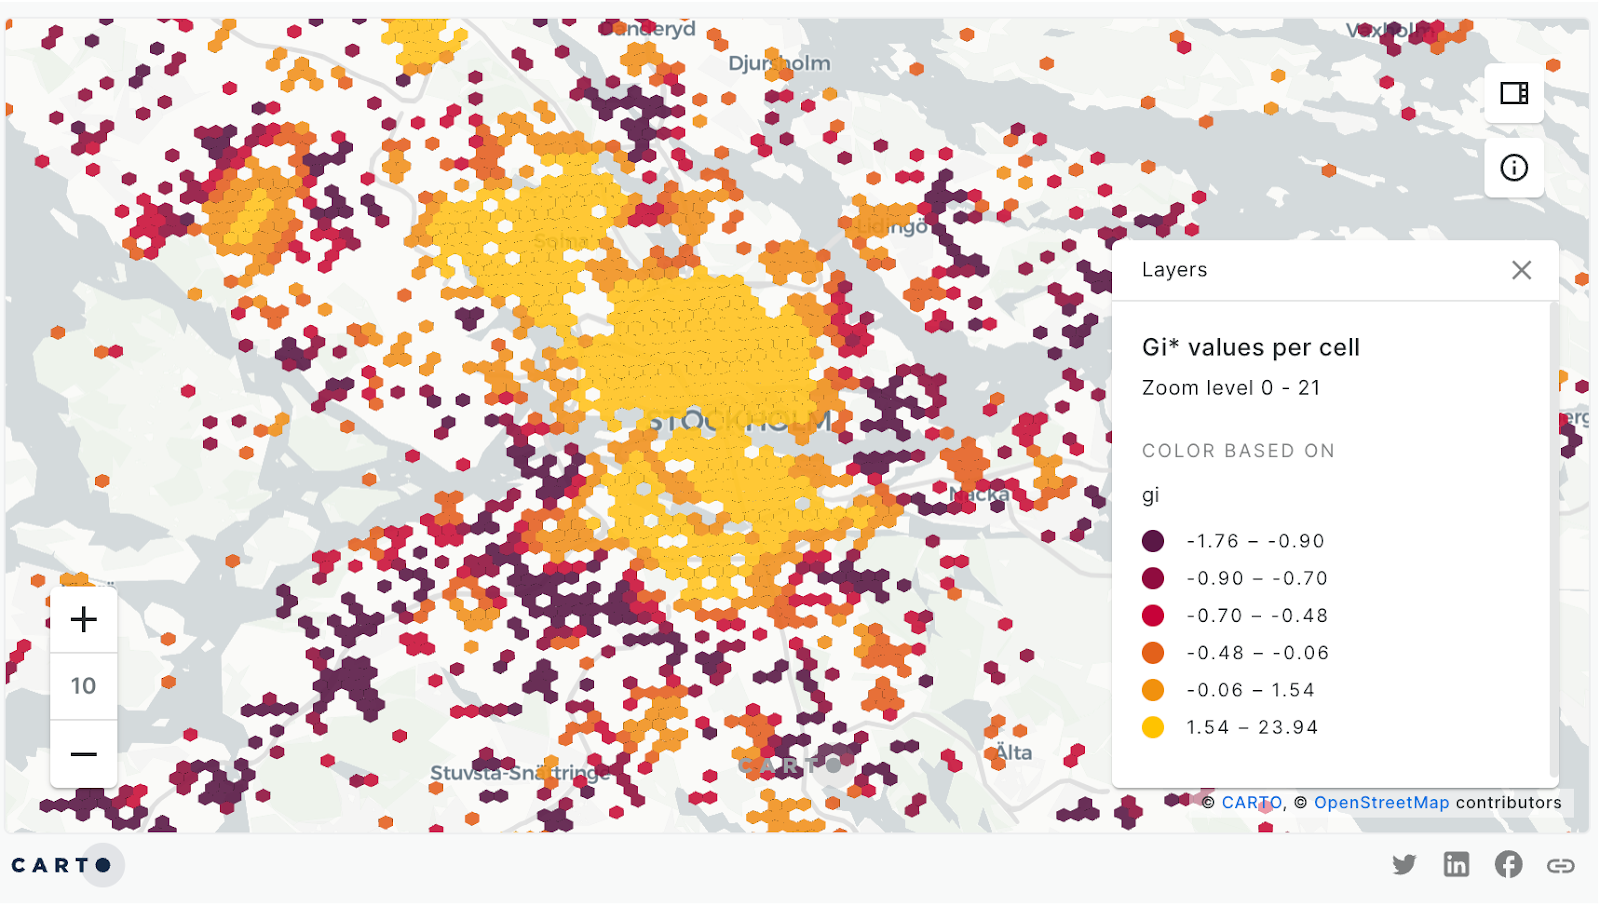
Users of our Analytics Toolbox for Snowflake now have access to a new module named “statistics”, offering functions to compute statistical measures on top of spatial data. We have added support for computing the Moran’s I spatial autocorrelation and Getis-ord Gi* statistics for the identification of hotspots based on an input feature. Learn more about how to derive insights from spatial hotspots here.
And users who run our Analytics Toolbox for PostgreSQL now have access to a new module named “h3” with a set of functions providing support for operating over the H3 spatial index. To learn more about Spatial Indexes and H3 in particular, please have a look at our Spatial Indexes 101 report and our documentation.
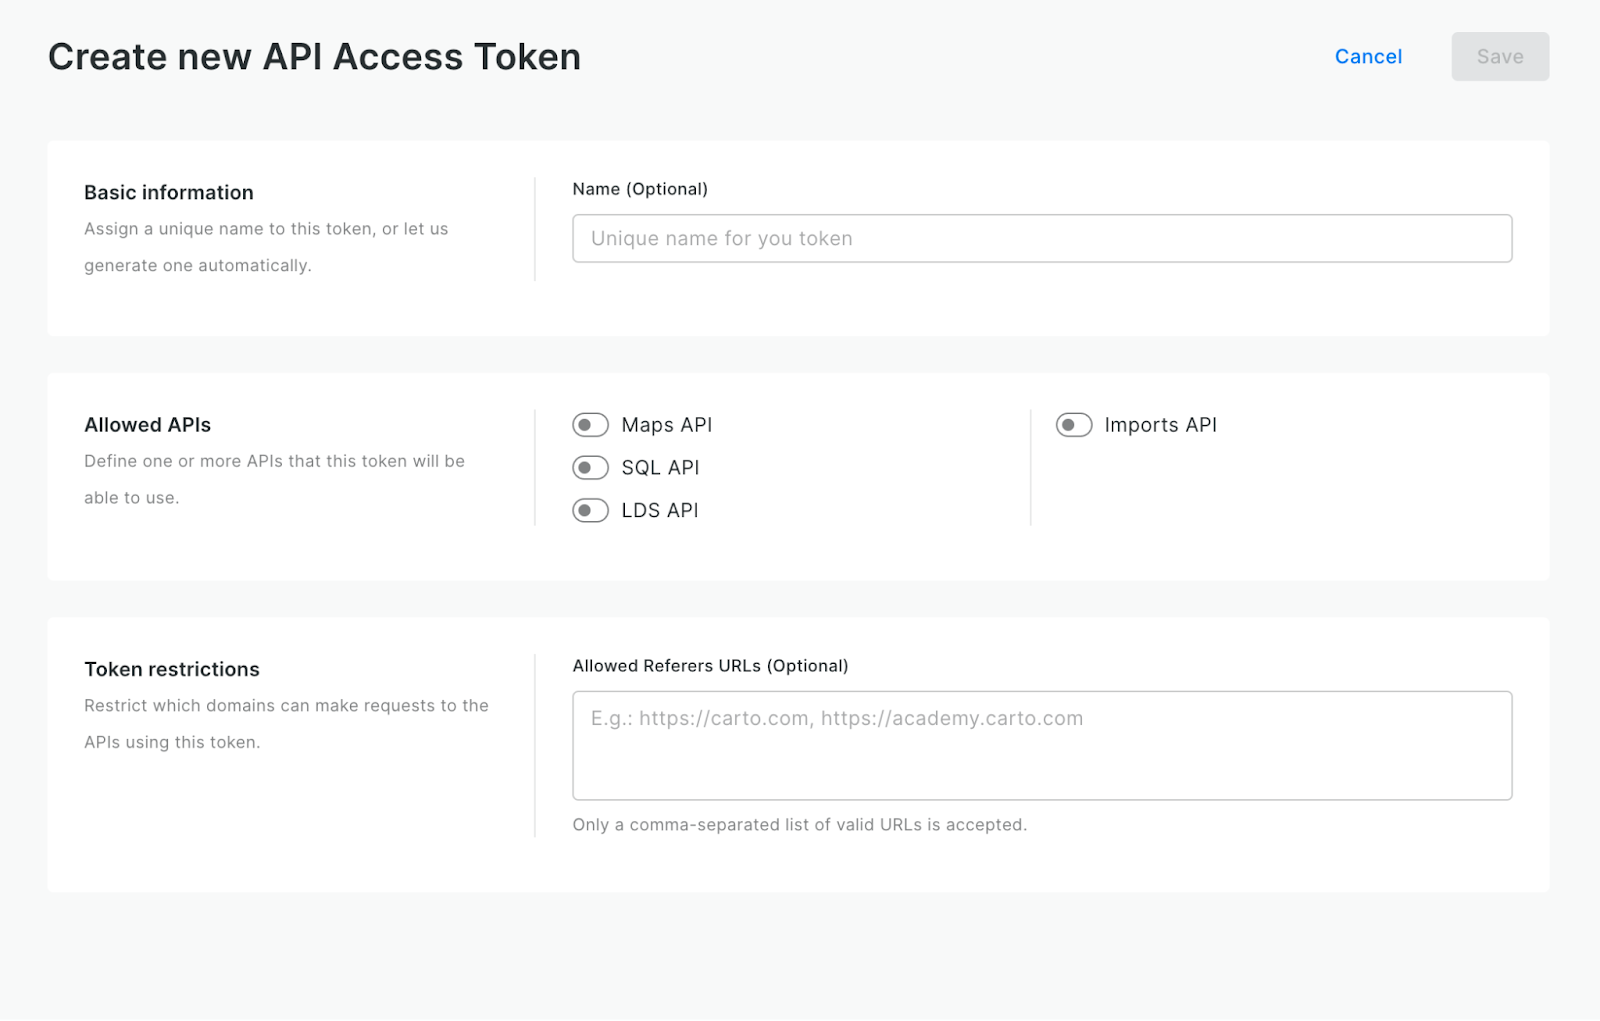
Easier authentication for developers with a specific interface to manage API Access Tokens
Developers looking to create geospatial applications at scale usually face an authentication challenge: how to build the application so that data is accessed in a granular and secure way. And there are different solutions depending on your needs: from static API Access Tokens for simple, public applications to dynamic authentication using the CARTO login (with or without Single Sign-On). This last quarter we worked on making the creation and management of API Access Tokens much simpler, with a complete user interface to create, edit and delete tokens.
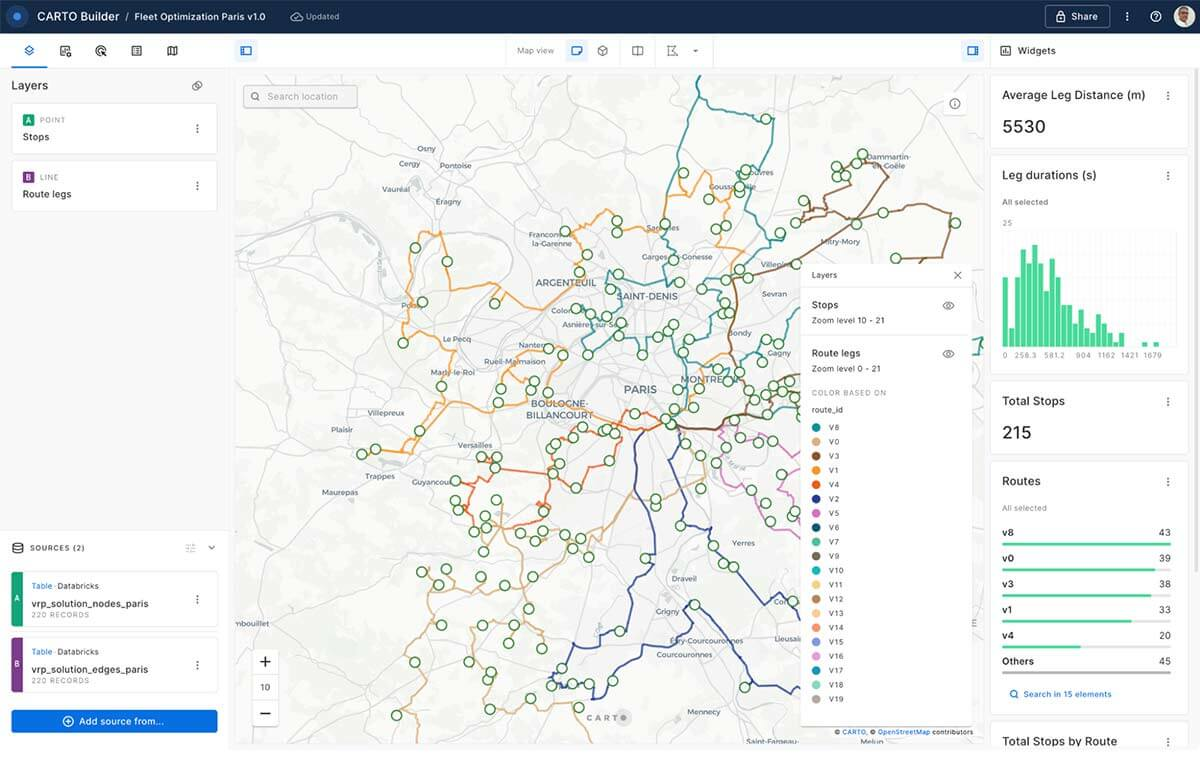
Fleet optimization with CARTO & Databricks
Optimizing transportation routes to minimize costs and environmental impacts while ensuring a timely delivery it’s a complex problem that professionals in the Logistics and CPG industries, face on a daily basis. In May, CARTO and Databricks jointly launched a fleet optimization toolkit that allows developers to take full advantage of the powerful and elastic computing resources of Databricks to design routing applications that help companies to be more efficient, competitive and environmentally-friendly. Learn more about this launch in the Databricks’ blog.
Deploying CARTO spatial apps directly in the Snowflake Data Cloud
At the 2023 Snowflake Summit that took place in Las Vegas inJune, CARTO proudly participated as launch partner for the release of Snowpark Container Services and Snowflake Native Apps. Snowpark Container Services can be used as part of a Snowflake Native App (in development) enabling Snowflake customers to install and run sophisticated apps entirely in their Snowflake account. For Snowflake consumers, this means they can install cutting-edge products like CARTO’s Analytics Toolbox and our Fleet Optimization solution and run them in their Snowflake without ever having to move their governed data or compromise its security. Check out our video on how you can install and access our fleet optimization toolkit in Snowflake.
Power 3D Maps with Google Maps Platform, CARTO & deck.gl
In May, Google Maps Platform opened up their stunning photorealistic data for use with the OGC standard for 3D Visualization, available in over 2500 cities across 49 countries. CARTO has collaborated with the teams at deck.gl and Google Maps in order to integrate the support for Photorealistic 3D tiles into deck.gl. One of the key updates that we have worked on has been to add a new terrain extension to allow the visualization of any deck.gl layer on top of Google’s 3D Tiles, which permits rendering of 2D data along a 3D surface. If you would like to learn more about this, please read our dedicated blog post.
----
We are really excited by this wave of enhancements to the CARTO platform and would like to thank our customers and partners for guiding us on this journey; and remember you can stay up to date on our most recent product releases by regularly checking our What’s New section.
If you would like to find out more about the enhancements we have developed and see the CARTO platform in action, why not sign up to our What’s New Product Update webinar, taking place on Thursday July 13.
Would you like to try out these features for yourself? Sign up for our free 14-day trial.