

WorldPop in CARTO: global demographic insights at high granularity


Understanding population distribution has important implications in a wide range of geospatial analysis including: human exposure to hazards and climate change impact on ecosystems improving access to markets and health services planning efficient and cost effective optimized route schedules and improving geomarketing and site selection strategies.
National population census data is the main source of information on the distribution of human population. Census data is available globally though there are often differences in the quality of the data and sampling between countries. Census data is compiled through traditional survey methods which because of the inherent high cost of this method results in aggregated data on an area-level with a coarse spatial scale. This can hide local heterogeneity and disparity. To overcome this challenge international efforts have been developed to increase the spatial scale of the distribution of human populations.

"Fitness for use" of available fine-resolution estimates
The methods used to produce fine resolution population data fall broadly within two categories. On the one hand there are 'top-down' methods which aim to disaggregate from top to bottom coarse census data driven by fine-resolution covariates. On the other hand 'bottom-up' methods directly model population estimates available in small areas from microcensus surveys using spatio-temporal regression methods which typically also include fine-resolution covariates. Compared to the latter which depend on the availability of microcensus surveys 'top-down' methods are easier to generalize and although might rely on out-of-date census data and the results are often more difficult to validate have been the preferred method for producing fine-resolution population estimates spanning multiple countries.
The simplest approach amongst 'top-down' methods is called dasymetric mapping and consists in redistributing demographic data equally through areal interpolation using covariate data associated with the variable of interest.

This is the method followed by the Facebook Connectivity Lab and the Center for International Earth Science Information Network (CIESIN) of Columbia University to derive the High Resolution Settlement Layer (HRSL) which provides gridded estimates of the population distribution at very fine resolution (30 m by 30 m at the Equator) for 140 countries for 2015. A convolutional neural network is used to identify potentially populated areas (settlements) using very high resolution (0.5 m) satellite imagery from DigitalGlobe and reallocate the population from census data proportionally to the ratio of built-up areas within a grid cell to the total grid cell surface.
While the HRSL dataset provides estimates at very fine resolution and uses advanced image recognition methods based on high resolution satellite imagery to identify settlements it has several limitations. First because of the proportional allocation the estimate of the population for the identified settled areas within each census unit will be the same with industrial and commercial areas counting as residential areas for the same built-up area and therefore the population would not strictly represent where people live. Secondly it is only available for 140 countries (out of 195 UN-recognized sovereign states) and only for year 2015 which means that it won't capture areas with structures built since then as with the example highlighted in this article.
While HRSL is more suitable when the interest lies in settlements areas as opposed to the human population the WorldPop dataset provides fine resolution estimates (although coarser than those available in HRSL) where variations within settled areas are instead taken into account. The WorldPop dataset is available globally for every year between 2000 and 2020 both on a grid with a resolution of 1 km by 1 km and of 100 m by 100 m (at the Equator). The method uses a Random Forest model trained to predict at the census-unit level the demographic data from remotely-sensed and geographical covariates (e.g. slope elevation distance to cultivated areas distance to major road intersections etc.) also available at fine-resolution. The model weights are then used for the fine-scale redistribution.
The differences between the two population datasets can be visualized in the map below which shows the total population in 2015 near San Juan Puerto Rico for WorldPop (for the 100 m resolution grid) and HRSL
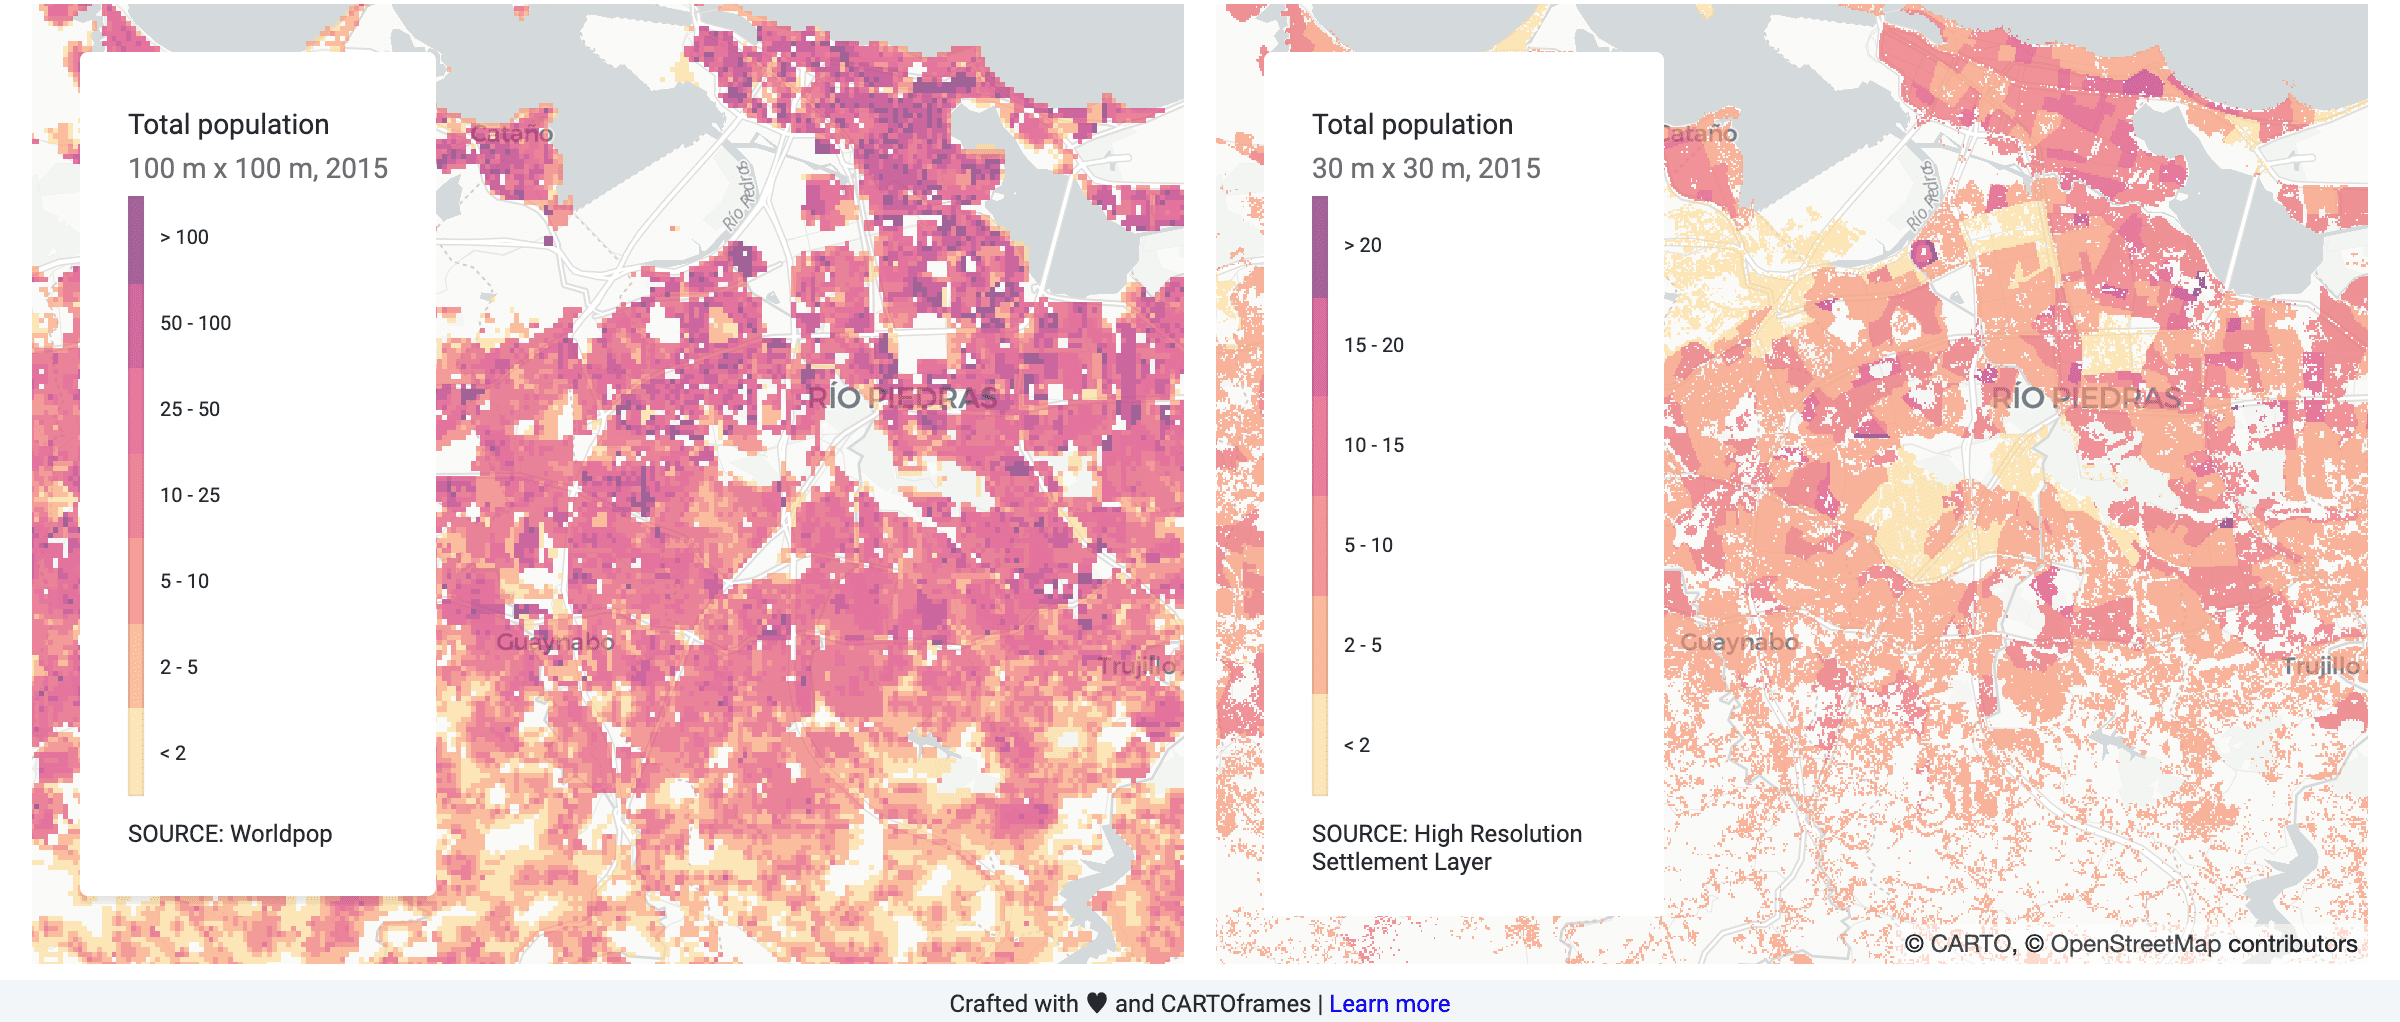
While the population is distributed "more smoothly" in the WorldPop dataset in the map showing HRSL data we can clearly spot the difference census units because of the proportional allocation.
While both the HRSL and WorldPop data provide useful information we have for now decided to start by making WorldPop data available in our Data Observatory. This choice was motivated by WorldPop's greater spatial coverage the availability of data for multiple years (allowing change over time analysis) and because the data more closely represents the residential population (given daytime population is already well covered by our human mobility data partners). Finally WorldPop not only provides the total population but also the age and gender structures as well as the fine-resolution covariates used in their disaggregation method.
Want to see it in action?
Request a live personlized demo
WorldPop in CARTO now available as public data
As part of commitment to open data we have been making WorldPop data available in our Data Observatory by converting the freely available raster data from the WorldPop website to vector data.
As of today we have made available the data for the total global population both at a resolution of 1 km and at a resolution of 100 m for the period 2000 - 2020 (amounting to almost 16 TB worth of data for the 100 m dataset!).
As an example of how this data can be used we looked at the evolution of the population in Delhi India which is one of the worlds fastest growing cities in the last 20 years with a median percentage change in 2020 with respect to 2000 of about 50%.
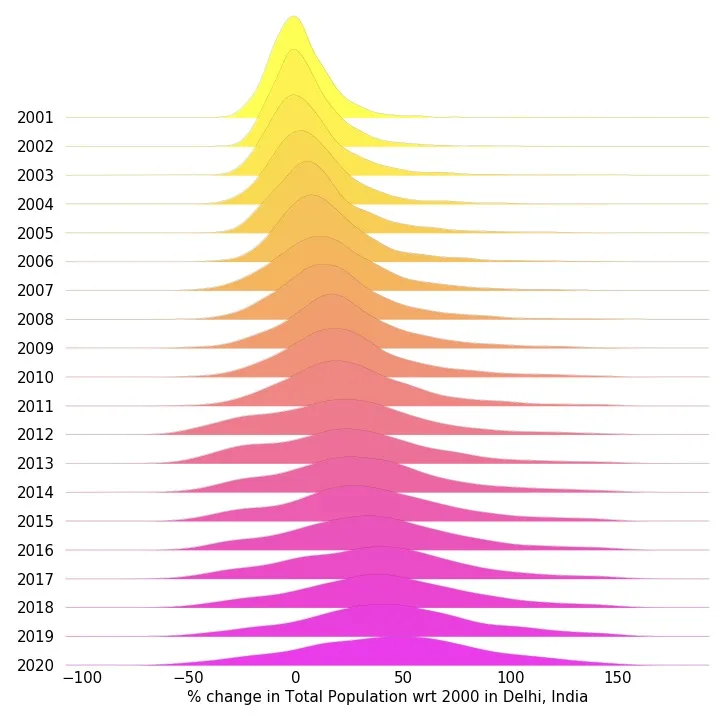
By visualizing this data with CARTOframes we can determine that these changes are unevenly distributed as shown in the animated map below.
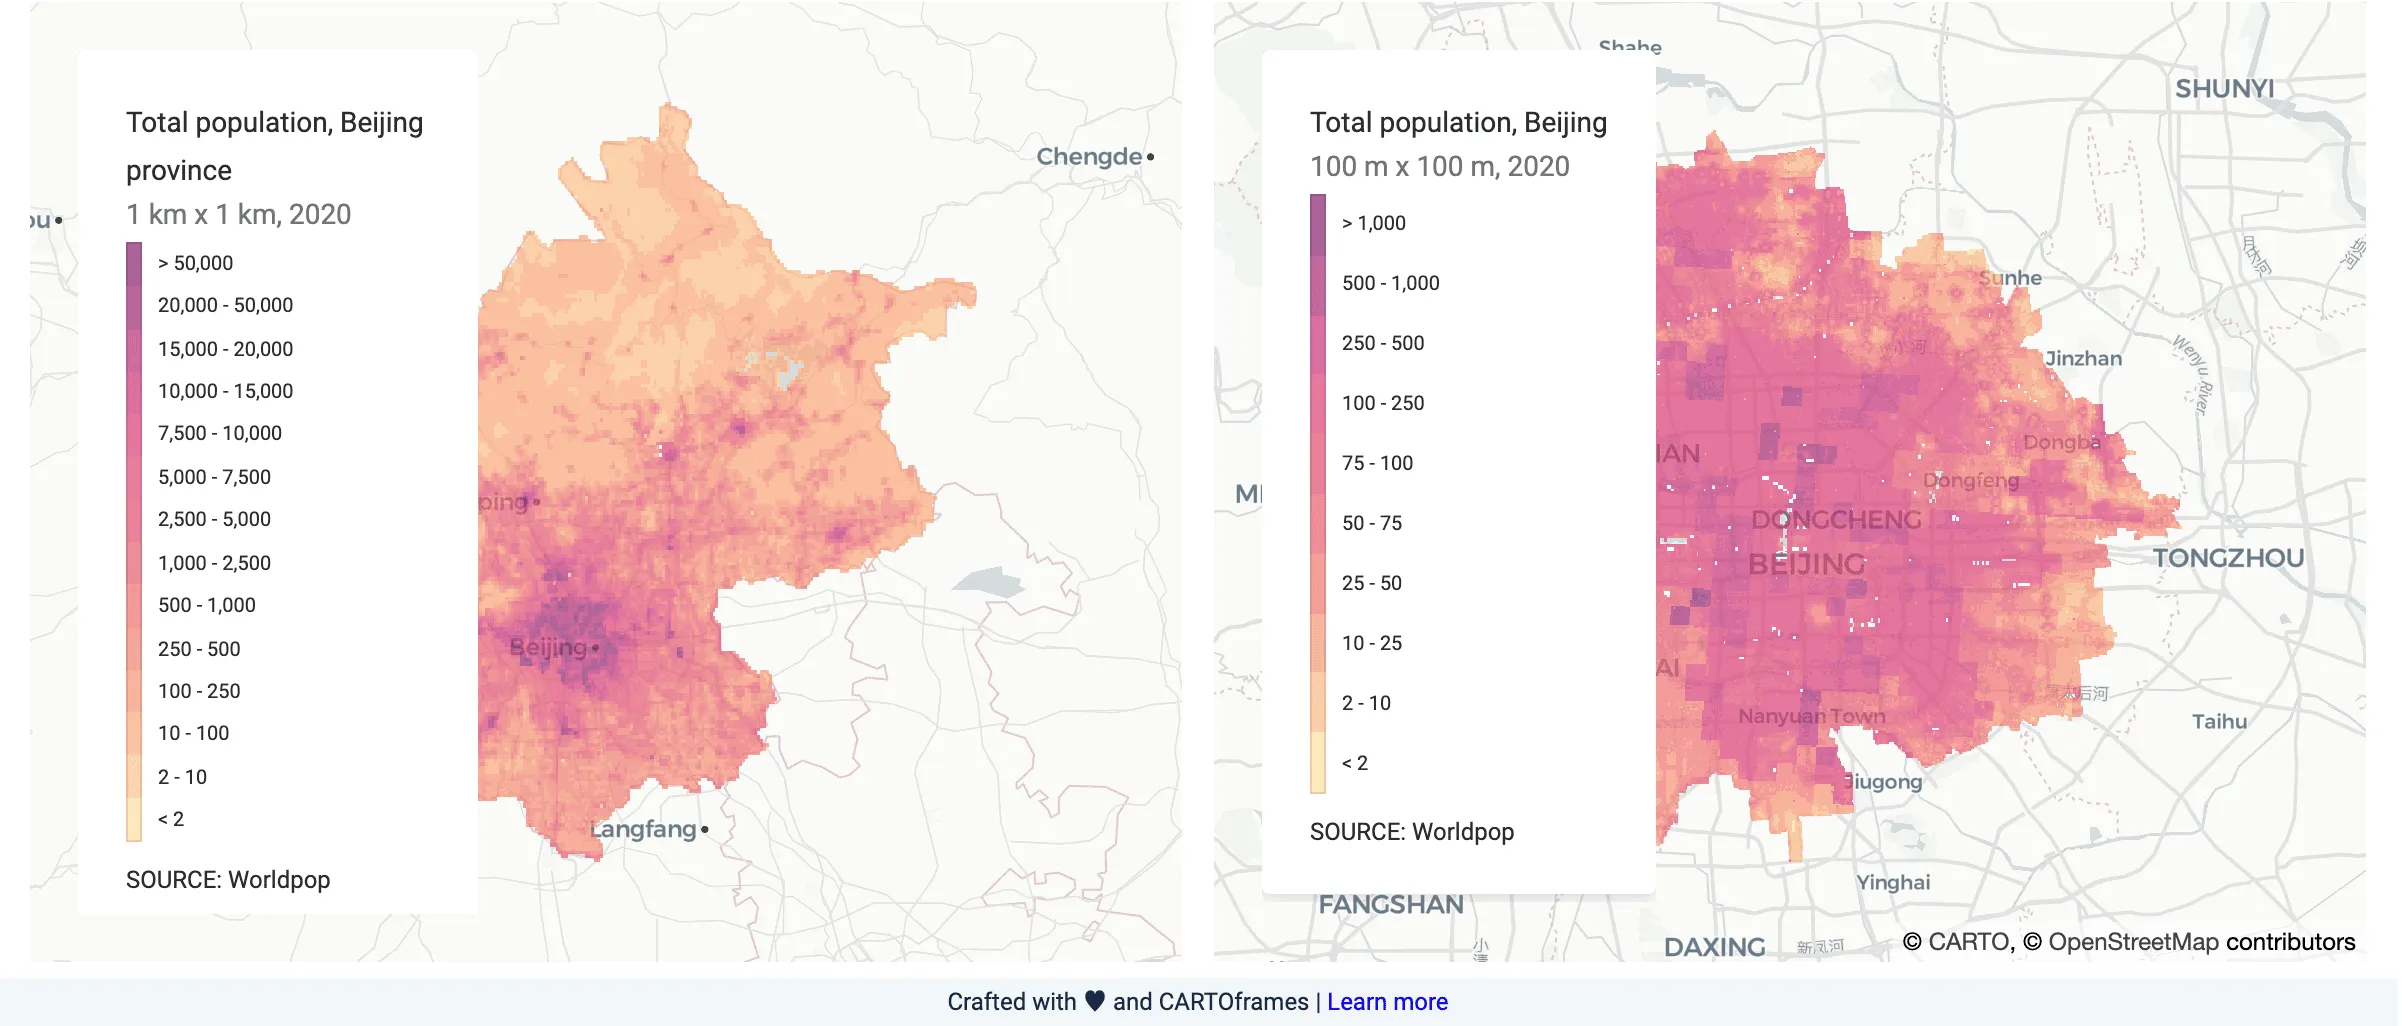
While the 1 km product can be useful to detect patterns at a coarser spatial resolution the 100 m resolution dataset can be further used to better understand very local variability as illustrated by the next map which shows the total population at 1 km in the Beijing province (China) and at 100 m in Beijing central districts in 2020.
This notebook we are sharing via Google Colab illustrates how to access some of the aforementioned datasets that are now publicly available from CARTO's Data Observatory as well as from our public project in Google BigQuery.
Get Started with Modern Up-to-Date Data Streams
Learn more about CARTO's location data streams and start incorporating data from WorldPop and other high-quality data sets into your models and spatial analyses today.
Want to give it a go? Sign up for a free account


