Boosting Retail & CPG Sales with Sentiment Analysis


Before booking an accommodation, selecting a restaurant or making a purchase - what do you do? For 95% of consumers, they read a review. A further 58% of consumers say they would willingly pay more to support a company with good reviews, and 83% of customers trust reviews MORE than messages coming from a brand itself!
Despite these statistics, many organizations do not incorporate this type of data - referred to as sentiment (measuring perception and the level of customer satisfaction) - into their analysis, missing a crucial part of what is driving their customers. Sentiment analysis provides crucial insights when making decisions such as site selection, product placement, and building tailored marketing campaigns.
So where can organizations find this data, and how can they leverage it to generate actionable insights?
Introducing Data Appeal & Sentiment Analysis
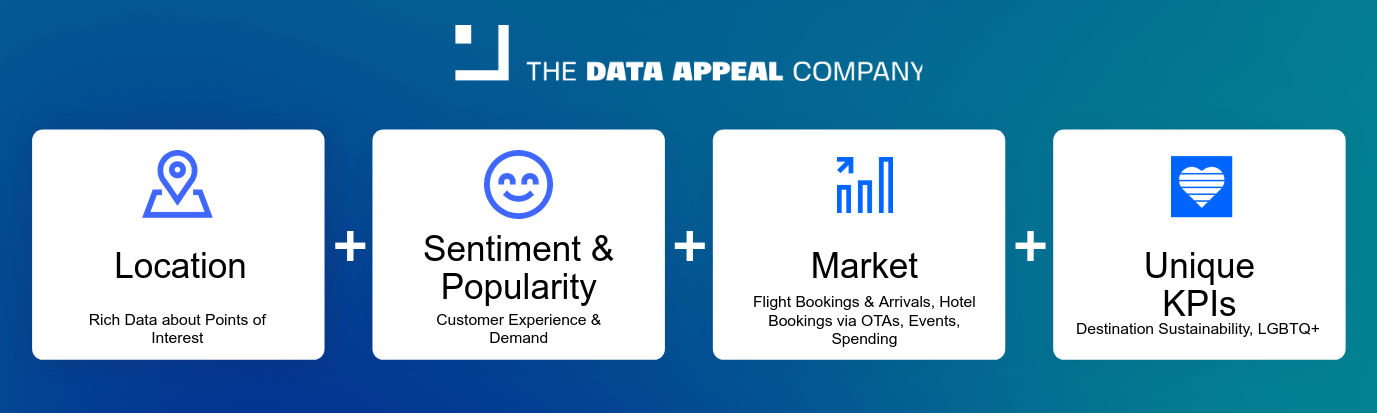
Data Appeal is a global data intelligence company that specializes in customer sentiment insights data. Leveraging advanced technologies like Natural Language Processing (NLP) and Sentiment Analysis, they provide businesses with comprehensive location data (Points of Interest), sentiment scores, and customer feedback insights from hundreds of online channels, enabling data-driven decision-making and optimizing business strategies.
Data Appeal is a CARTO data partner - meaning if you’re a CARTO user (wait, you ARE a CARTO user right? If not - sign up for a free 14-day trial and see what the fuss is about!) you can subscribe to and access their 584 datasets directly from our Spatial Data Catalog; no painful ETL required!
So… what exactly is this sentiment data?
The Power of Sentiment Data
The primary sentiment dataset offered by the Data Appeal company is based on Points of Interest (POI). This includes datasets on various KPIs relating to customer feedback, sentiment and popularity - a proxy of footfall. The data is collected from a wide variety of online platforms such as Booking.com, Airbnb, TripAdvisor, Google, Facebook - with data available from up to 5 years in the past. For sentiment, places are given a score from 0-100, with 100 being the most positive.
Organizations can further understand what’s driving these scores with Data Appeal’s cluster analysis, scoring the sentiment of over 50 main topics ranging from safety, price, quality and staff.
You can explore this dataset in the map below - or in full screen here! Make sure you explore the pop-ups and widgets to see sentiment levels for individual locations or to compare categories!
In addition to this POI dataset, users can also subscribe to:
- Characterization: data on facilities, amenities, features and attributes of any POI (i.e. cuisine type, on-site parking, internet access, etc.)
- Opening & closing hours: exactly what you’d imagine!
- OTA Offers Price: minimum, maximum and average price of hospitality-related accommodation properties from online travel agencies (OTAs).
- OTA Offers Saturation: the occupancy levels of OTA-listed accommodation properties.
- Popularity Trends: an “overall popularity index” for each POI based on a selected historic time period. This is a great proxy for footfall data.
- Popularity by time of day: includes a “popularity index” for week days versus weekends and time of day.
- Sentiment Trends: provides a sentiment score and number of reviews for a selected historic time period.
Sounds great, right? But… How can you use this data to benefit your organization? Keep reading to find out!
The Missing Piece: Incorporating Sentiment Data into your analysis
Next, we’re going to take you through an example use case for sentiment data analysis. If you want to follow along with this example, make sure you sign up for a free 14-day trial!
In this example, let’s imagine we’re a coffee supplier looking to expand to new merchants in Rome.
With our own first-party data, we know which locations we are currently supplying, and our annual revenue from their orders. From The Data Appeal Company, we know the locations of all food & beverage suppliers in Rome, and their popularity and sentiment scores. We can use this information to start to decide which merchants to target.
In this example, this process will involve three main steps.
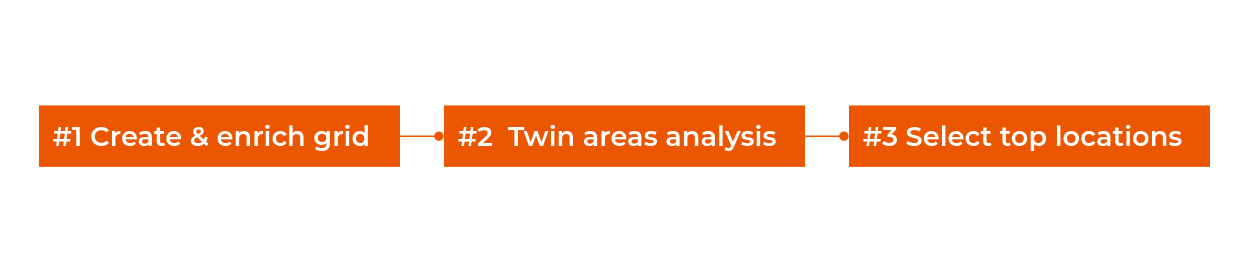
Step 1: Create and enrich grid
In order to perform twin areas analysis, we first need to convert our input POI data into a Spatial Index. Spatial Indexes are global grid systems which are geolocated using a short reference ID, rather than a long geometry string. This makes them super lightweight to store and analyze - perfect for working with spatial data which is notoriously B-I-G. Learn more about Spatial Indexes in this FREE ebook!
To do this, we’ll use CARTO Workflows - our low-code visual interface for creating iterative analytical pipines.
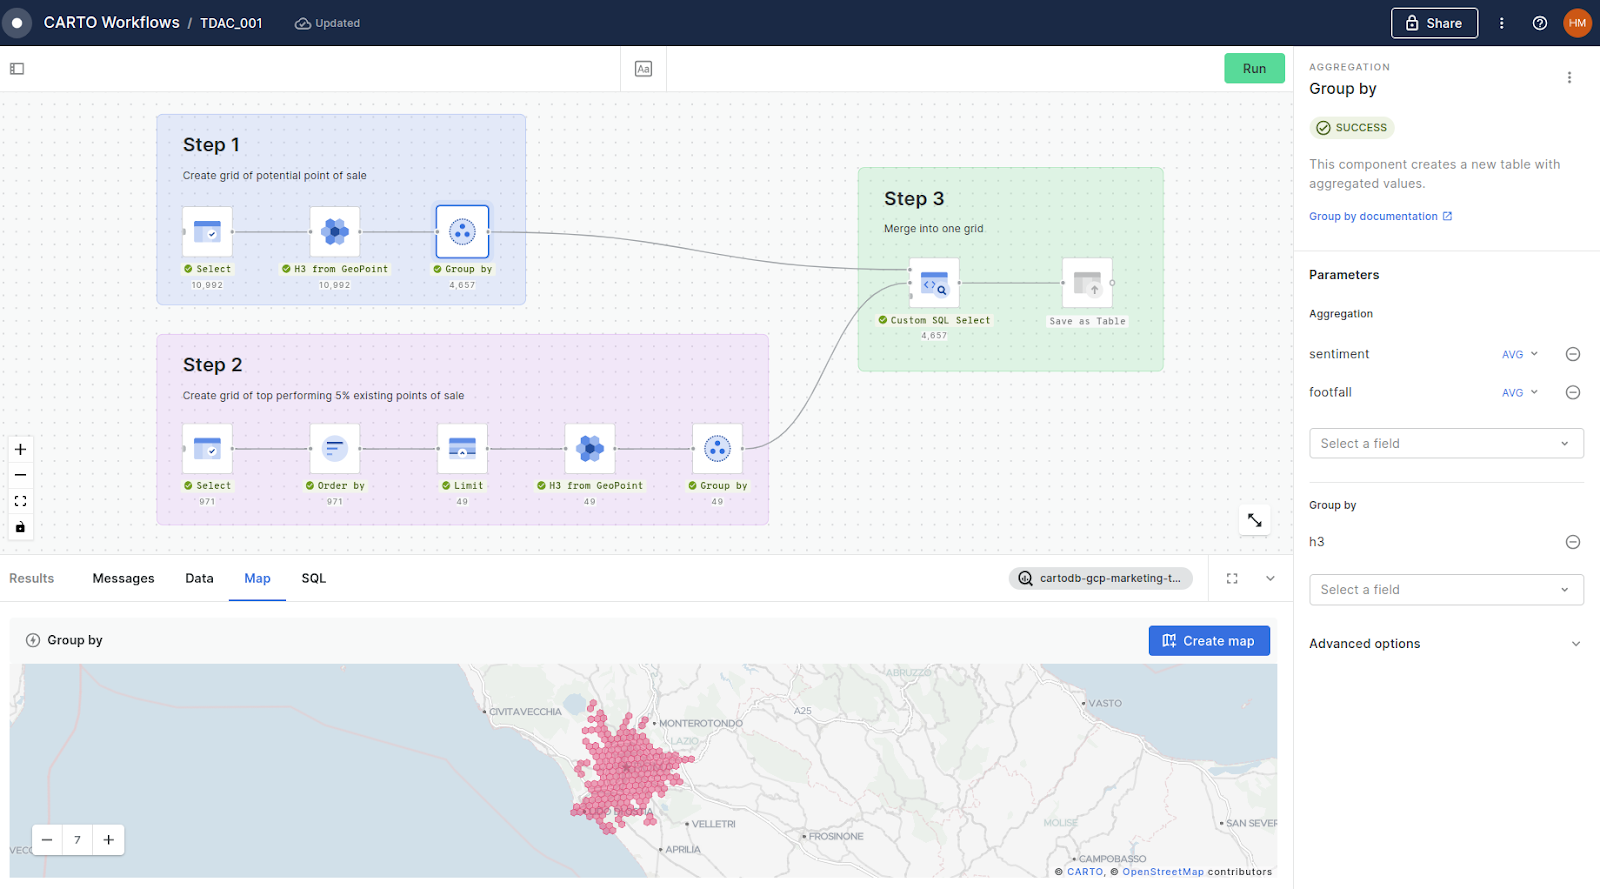
There are three main steps in this workflow.
Stage 1 Create a grid of potential point of sale locations (see above: blue)
- Use the component H3 from GeoPoint to create a H3 (a type of hexagonal spatial index) for each potential point of sale.
- Where multiple points of sale share the same H3 cell, use the Group by component to summarize the characteristics in each cell, here these are the average footfall and sentiment scores from the Data Appeal POI data.
Stage 2 Create a grid of the top performing existing points of sale (see above: purple)
- Use the Order By component to order the existing points of sale by revenue.
- Next, use the Limit component to filter this to the top 49 (i.e. 5%) highest performing stores in terms of revenue.
- Use the same process as in step 1 to convert these to a H3 index.
Stage 3 Join these results to create a single table (see above: green)
Finally we need to join these results into a single table. In order to retain all features from step 1, we will use a LEFT JOIN through a Custom SQL Select component; see the code for this below. Note you can call other workflow nodes through placeholders like $a and $b.
SELECT $a.*, $b.revenue FROM $a
LEFT JOIN $b ON $a.h3 = $b.h3
And that’s our preprocessing done - on to the next stage!
Step 2: Run twin areas analysis
Twin area analysis is a user-defined function from CARTO’s Analytics Toolbox which uses Principal Component Analysis to score a grid based on how similar cells are to a given set of input cells.
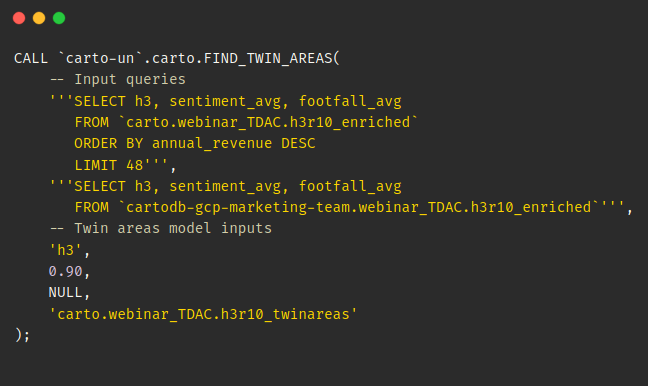
The code below shows how you can leverage our Find Twin Areas SQL function. To run this, we need to define two queries:
- Our top 5% performing points of sale (48 merchants) in terms of revenue.
- All other H3 cells along with the variables that we want to base this analysis on; here average sentiment and footfall.
We will then also set the analysis parameters and output table. You can find a full explanation of this code in the Retail module of your cloud’s Analytics Toolbox.
The twin area analysis results generate the following statistics:
- Similarity_score: the distance between the origin and target cell in the Principal Component (PC) Scores space.
- Similarity_skill_score: a relative measure, calculated as 1 - similarity_score(t) / similarity_score(<t>), where <t> is the average target cell. A higher similarity_skill_score indicates that the target cell is more similar to the origin, with a score of 1 indicating a perfect match or zero distance.
What does this mean for us? Essentially, merchants in locations with a higher similarity_skill_score will have footfall and sentiment scores more similar to our highest performing existing points of sale - so shall we see which these are?
Step 3: Select the top locations
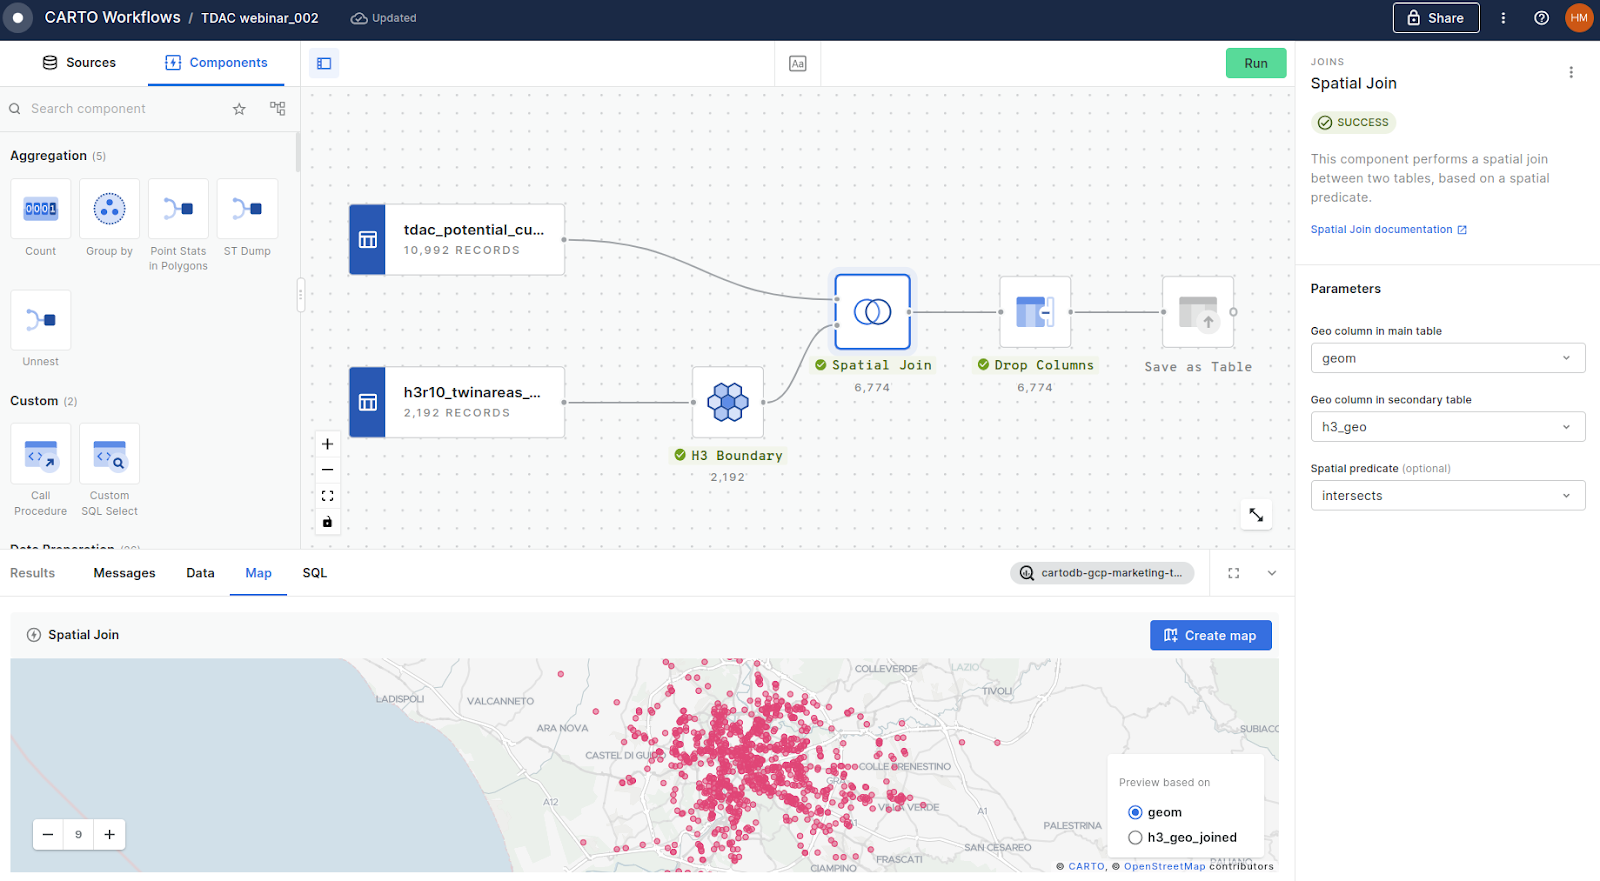
For this final stage, we just need to create another short workflow to assign the values from the H3 twin areas grid back to each individual store. In this workflow, we:
- Use H3 Boundary to temporarily convert the H3 grid into a polygon geometry
- Run a Spatial Join to assign the values from the grid to the potential points of sale based on where their locations intersect (learn more about intersections and other types of spatial relationships here)
An optional step is to use the Drop Columns component to clean up the output, only retaining relevant fields - before using Save as Table to… well, you can work that one out!
Shall we check out the results?
In the below map (open in full screen here) you can see the similarity skill scores of each individual point of sale. Larger, lighter points have a higher score - and therefore have a higher similarity to our top performing existing vendors. These high-scoring locations could be great priorities for stocking our coffee product!
Of course this is a highly simplistic look at this process, and when using this data and technique in practice you may wish to incorporate other variables - such as local demographics and spend levels.
Sentiment Analysis & Location Intelligence
Customer reviews and sentiment play a critical role in influencing purchase decisions, with an overwhelming majority of consumers trusting reviews more than brand messages. By incorporating sentiment data into your analysis, you could be generating valuable location-based insights for building customer-centric strategies.
Want to see this use case in action? Watch the webinar here!
Ready to get started? Sign up for a free 14-day trial today!