Determine Optimal Store Locations using White Space Analysis


As brick & mortar retailers, and the CPG categories they distribute, look to expand their footprint, network planners need access to insightful analysis and modeling techniques to drive better decisioning. After all opening a new location is often the single largest cost retailers have to bear. In this post we outline how spatial data and white space analysis can be used to surface the most viable new store sites.
Our Analytics Toolbox for BigQuery, a set of User Defined Functions for running advanced spatial analytics natively in BigQuery, has been further enhanced with a new set of retail-specific functions including revenue prediction and white space analysis.
White space analysis solves the ultimate question in retail expansion: where should I open my next store? The output of the analysis are the best potential locations understood as those where the expected revenue is higher and where other business criteria are also met: e.g. the presence or absence of existing stores and/or competitors.
In order to complete end-to-end white space analysis, three steps are necessary, each corresponding to a specific procedure in the CARTO’s Analytics Toolbox for BigQuery: data preparation model training and locating whitespace areas running the BUILD_REVENUE_MODEL_DATA BUILD_REVENUE_MODEL and FIND_WHITESPACE_AREAS procedures, respectively.
To showcase the usage of the white space analysis we will build on the same revenue prediction use-case of our previous blogpost. We are going to use a set of liquor store locations under the brand Hy-Vee and their associated annual revenue for 2019 extracted from the publicly available Iowa Liquor Sales datasets. All other liquor stores will be considered Hy-Vee's competitors.
In this particular example we are using an H3 grid at resolution 7 and the same set of enrichment variables we used in the previous blog post: total population and number of POIs for different categories, in particular, retail, financial, food & drinks, leisure, transportation and tourism, extracted from CARTO's Spatial Features dataset available via our Data Observatory.
Data preparation
This step has the objective of enriching the area of interest where the analysis will be performed using both the data provided by the retailer (existing store locations and their revenue and competitor locations), and data from the Data Observatory subscription detailed above .
The following SQL operation is performed using the BUILD_REVENUE_MODEL_DATA procedure:
CALL `carto-un`.carto.BUILD_REVENUE_MODEL_DATA(
-- Stores: revenue, store, geom
'''
SELECT store_name as store, any_value(store_location) as geom, sum(sale_dollars) as revenue FROM
`bigquery-public-data.iowa_liquor_sales.sales`
where store_name like "%HY-VEE%" and EXTRACT(YEAR FROM date)=2019
group by store_name
''',
-- Store variables
NULL,
-- Competitors: competitor, geom
'''
SELECT store_name as competitor, any_value(store_location) as geom FROM
`bigquery-public-data.iowa_liquor_sales.sales`
where store_name not like "%HY-VEE%" and EXTRACT(YEAR FROM date)=2019
group by store_name
''',
-- Area of interest: geom
'''
SELECT state_geom AS geom
FROM `bigquery-public-data.geo_us_boundaries.states`
WHERE state_name='Iowa'
''',
-- Grid params: grid type and level
'h3', 7,
-- Decay params: kring size and decay function
1, '',
-- Data Observatory enrichment
[("population_f5b8d177", 'sum'), ("retail_21cb1815", 'sum'),("financial_9b8bb507", 'sum'),("food_drink_bd2ef444",'sum'), ("leisure_16da1bd6", 'sum'),
("transportation_63a2617a",'sum'), ("tourism_fc201498", 'sum')],
'carto-data.do_subscription',
-- Custom data enrichment
NULL, NULL,
-- Output destination prefix
'cartobq.docs.whitespace_analysis_iowa'
);
The result is a table (cartobq.docs.whitespace_analysis_iowa_model_data) including one row for every H3 grid cell at resolution 7; each containing their associated enrichment values, including the number of stores, competitors and the variables coming from CARTO’s Spatial Features dataset specified earlier. You can learn more about enriching spatial data here.
Model training
This step builds the revenue prediction model using the data resulting from the data preparation step. The model is trained using BigQuery ML’s Boosted Tree Regressor which the user can tweak using the options parameter of the BUILD_REVENUE_MODEL procedure.
The following SQL operation is performed:
CALL `carto-un`.carto.BUILD_REVENUE_MODEL(
-- Model data
'cartobq.docs.revenue_prediction_iowa_whitespace_analysis_data',
-- Options
'{"MAX_ITERATIONS": 20}',
-- Output destination prefix
'cartobq.docs.whitespace_analysis_iowa'
);
Finding whitespace areas
Once we have enriched our area of interest using the chosen spatial resolution and trained our revenue prediction model the last step consists in finding the locations within our area of interest where a new store would perform best. For that purpose we are going to use the FIND_WHITESPACE_AREAS procedure, which takes the following parameters as input:
- Table containing the enriched dataset of our area of interest (result from running the BUILD_REVENUE_MODEL_DATA).
- Revenue prediction model (result from running BUILD_REVENUE_MODEL).
- Optional spatial filter to reduce the search area.
- Optional minimum amount of revenue and maximum number of results.
- Two flags indicating whether to include in the search those cells where competitors and/or the retailer’s own stores are present.
- Collection of locations (generators) around which the search will be performed. Since the algorithm will look for whitespaces only in the surroundings of these locations it will avoid offering results that are not of interest to the user. For instance these could be the locations of existing stores their competitors or a collection of POIs that are known to drive commercial activity to an area.
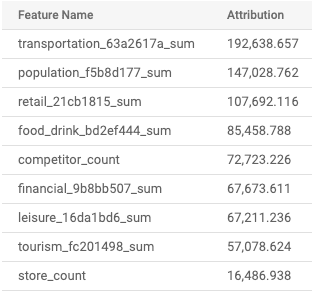
For our particular analysis, a good choice for the generator locations is the set of transportation retail and food & drink POIs, as those are the ones with the highest feature importance in our revenue prediction model (see table below). The location of these POIs has been extracted from the OpenStreetMap planet nodes dataset and those for Iowa have been stored in the table cartobq.docs.whitespace_analysis_iowa_generator_pois.
We can use this procedure to run a preliminary exploration to visualize all areas with a minimum amount of potential revenue, in this case $200 000. The result has been stored in the table whitespace_analysis_iowa_result_allcells_min2e5.
CALL `carto-un`.carto.FIND_WHITESPACE_AREAS(
'cartobq.docs.whitespace_analysis_iowa_revenue_model',
'cartobq.docs.whitespace_analysis_iowa_revenue_model_data',
'SELECT * FROM cartobq.docs.whitespace_analysis_iowa_generator_pois',
NULL, -- AOI query
200000, -- Minimum revenue
NULL, -- Max results
TRUE, -- Include cells with own stores
TRUE -- Include cells with competitors
)
The following map displays the resulting whitespace areas coloured by the amount of potential revenue where darker colors represent higher values of revenue. The generator locations have also been included for reference in the visualization.
Open the map full screen here.
Then, we can rerun the procedure to find only the areas with the top 10 highest potential revenue where no previously existing stores or competitors are present.
CALL `carto-un`.carto.FIND_WHITESPACE_AREAS(
  'cartobq.docs.whitespace_analysis_iowa_revenue_model',
  'cartobq.docs.whitespace_analysis_iowa_revenue_model_data',
  'SELECT * FROM cartobq.docs.whitespace_analysis_iowa_generator_pois',
  NULL,  -- AOI query
  2e5,  -- Minimum revenue
  10,  -- Max results
  FALSE,  -- Include cells with own stores
  FALSE -- Include cells with competitors
)
The resulting white space areas are represented in red in the following map.
Open the map full screen here.
As we have seen in this post white space analysis gives both retailers and CPG brands the flexibility to explore network expansion opportunities based on valuable spatial insights. This approach takes the guesswork out of site selection decisions so businesses can hone in on those retail locations most likely to succeed.
These procedures are now available to CARTO users as part of the Analytics Toolbox for BigQuery. They can be run directly from the BigQuery console or from your SQL or Python Notebooks using the BigQuery client. Additionally they will soon power the white space analysis engine integrated in CARTO's Site Selection application.